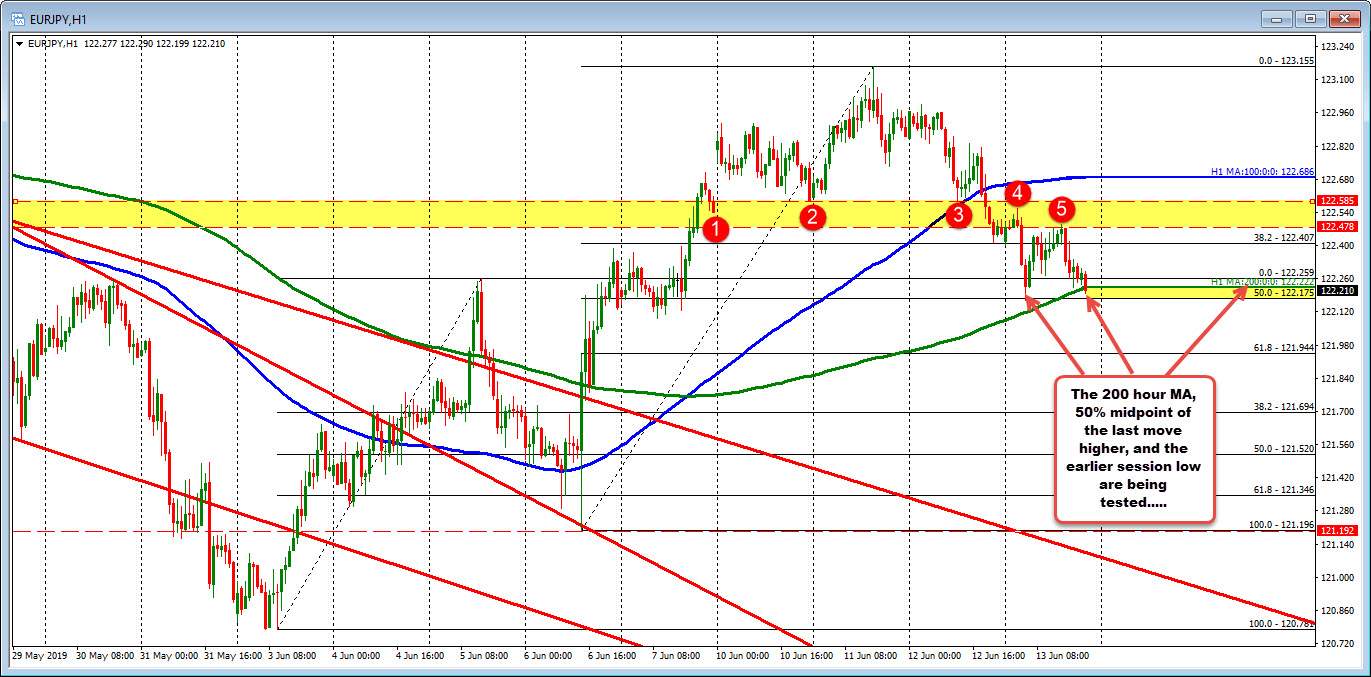
122.17-122.222 have a cluster of support in the EURJPY
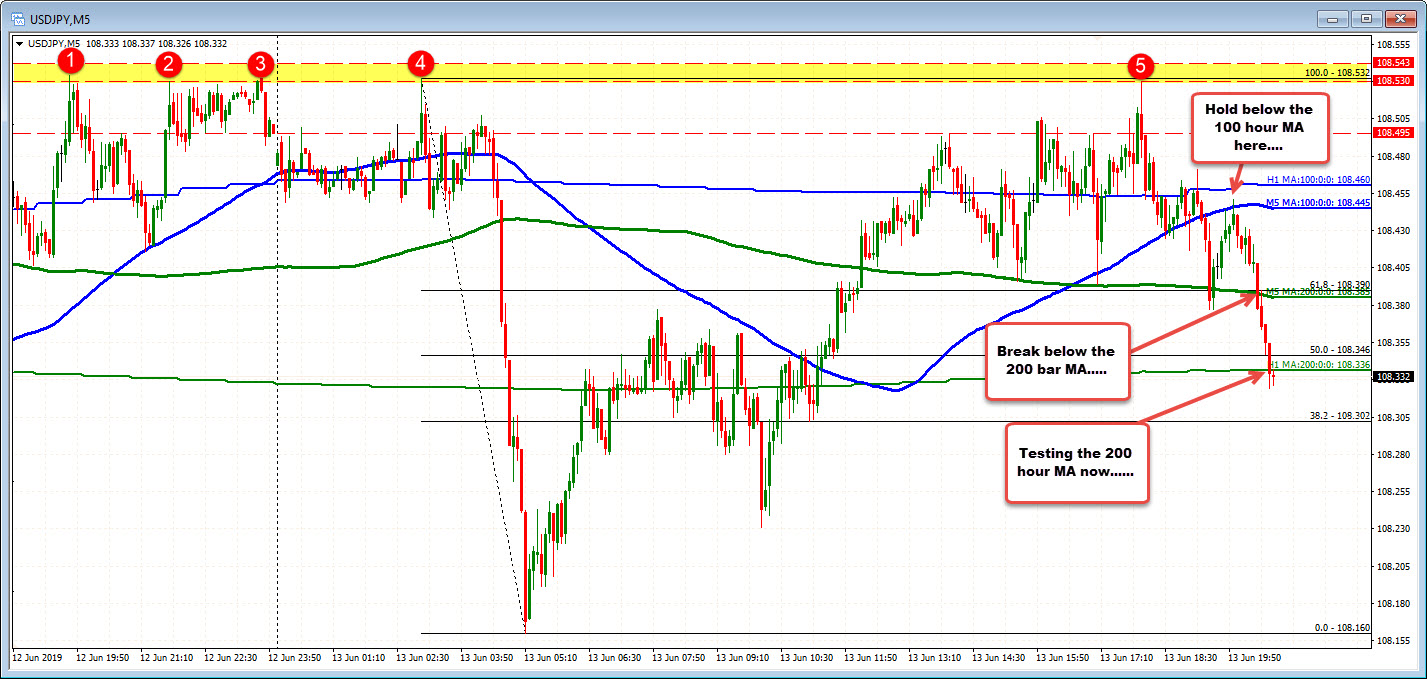
The EURJPY is back down testing a cluster of support defined by the 200 hour MA, 50% midpoint retracement and the earlier low for the day. The corrective move higher today (off the earlier lows) stalled in a swing area defined by recent swing highs and lows. So the pairs 2nd fall today, comes after holding topside resistance. Bearish. A move below the support area should solicit more selling with the 122.00 natural level and the 61.8% of the move up from the June 6 low at 121.944 the next downside targets. PS the USDJPY is down testing the 200 hour MA after offiically completing the down and up lap up at 108.53. The 200 hour MA comes in at 108.336.
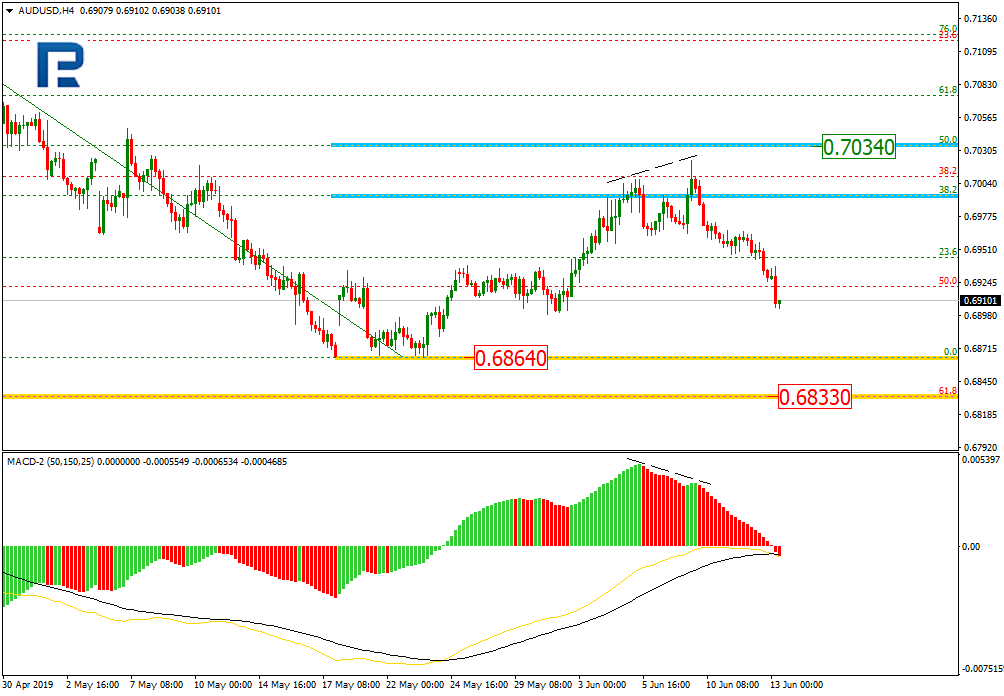
As we can see in the H4 chart, there was a divergence on MACD, which made AUDUSD complete the correctional uptrend at 38.2% fibo and start a new decline. If the price starts a new rising impulse, the upside target may be 50.0% fibo at 0.7034. Still, the current decline is looking quite stable, that’s why the instrument is expected to break the low at 0.6864 and mid-term 61.8% fibo at 0.6833.
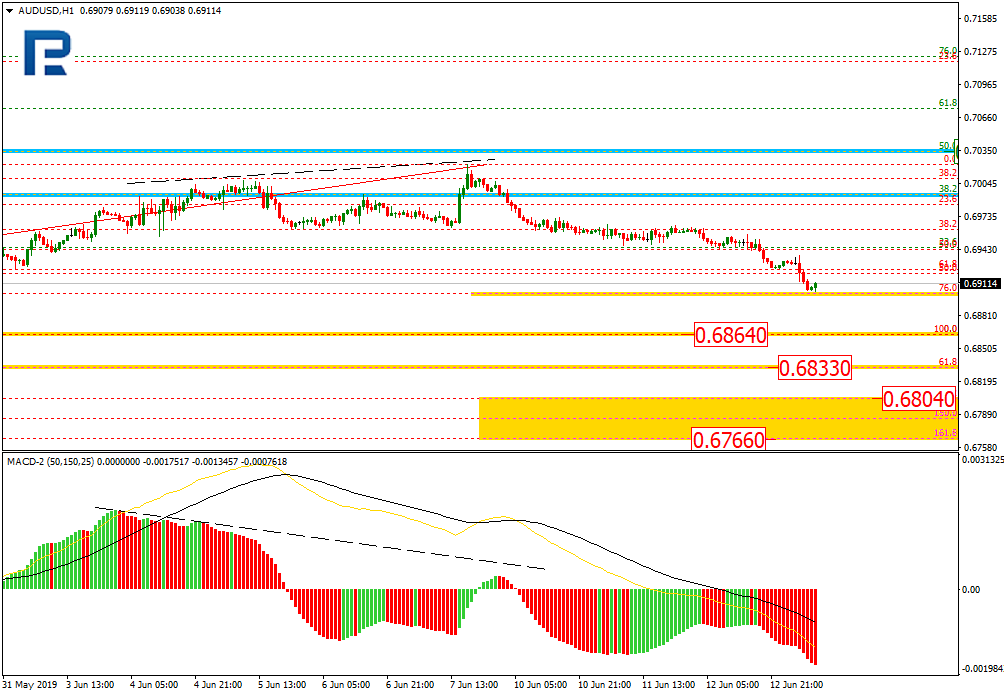
In the H1 chart, the divergence made AUDUSD start a new downtrend, which has already reached 76.0% fibo. In this light, the instrument is expected to break the low and then continue falling towards the post-correctional extension area between 138.2% and 161.8% fibo at 0.6804 and 0.6766 respectively.
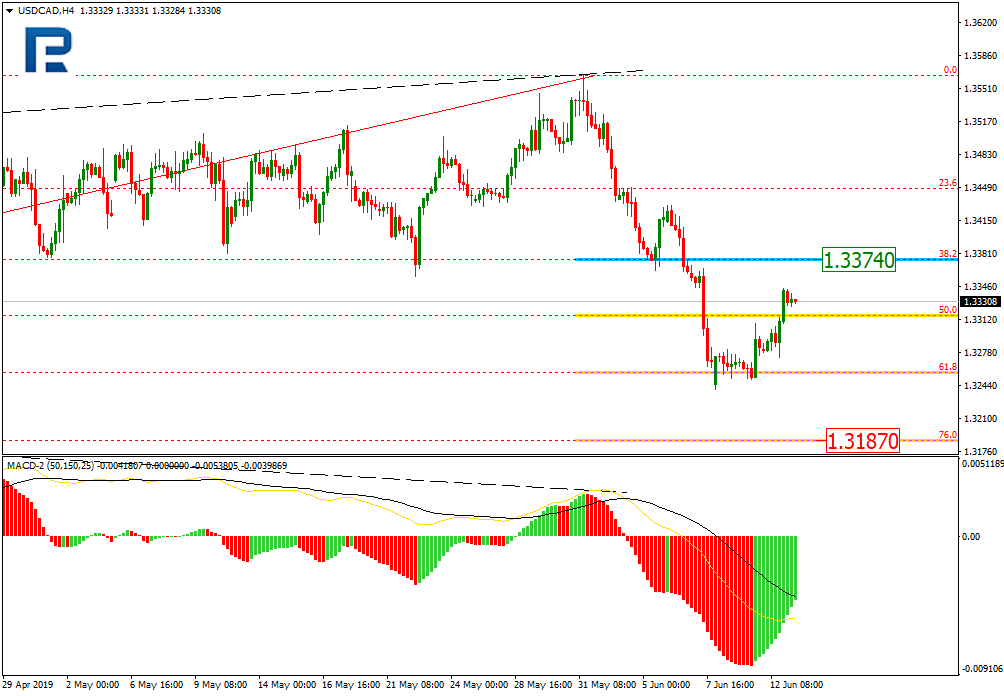
USDCAD, “US Dollar vs Canadian Dollar”
As we can see in the H4 chart, the current descending impulse has reached 61.8% fibo. Right now, the pair is forming an upwards pullback towards the resistance at 38.2% fibo at 1.3374. After completing the pullback, the price may start a new descending wave towards 76.0% fibo at 1.3187.
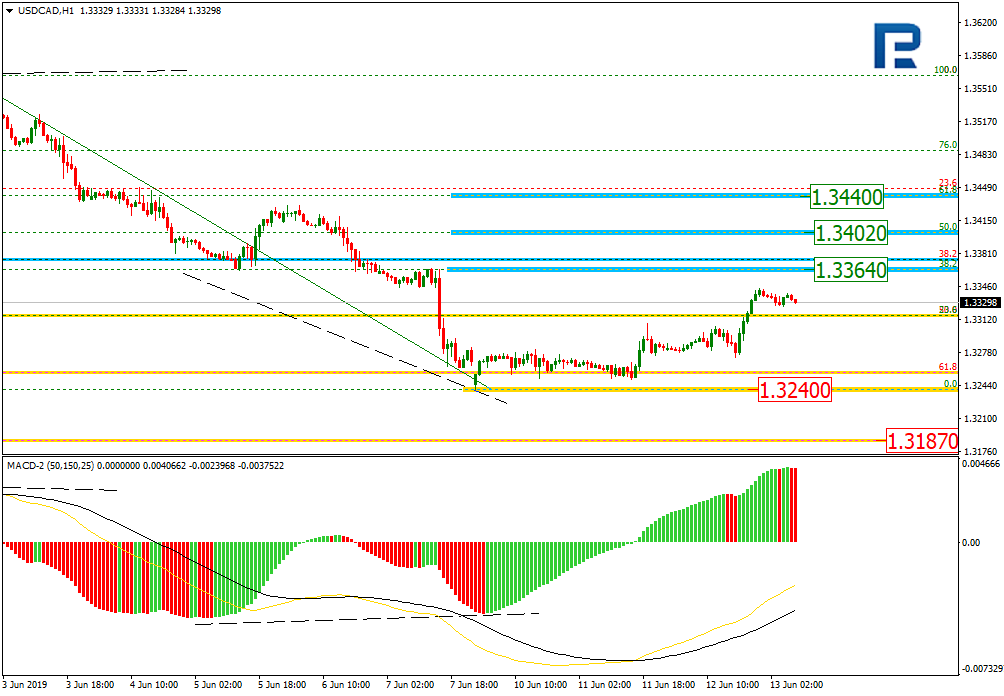
The H1 chart shows more detailed structure of the current correctional uptrend, which is heading towards 38.2% fibo at 1.3346 or even higher, 50.0% and 61.8% fibo at 1.3402 and 1.3440 respectively. The local support is the low at 1.3240.
Levels of the AUDUSD through the employment report
Australian employment data will be released in the new trading day. The estimate is for
employment change of 16.0K vs 28.4K last month.
Unemployment rate is exected to fall to 5.1% from 5.2%.
Full time jobs fell -6.3K last month
Part time jobs rose 34.7K last month.
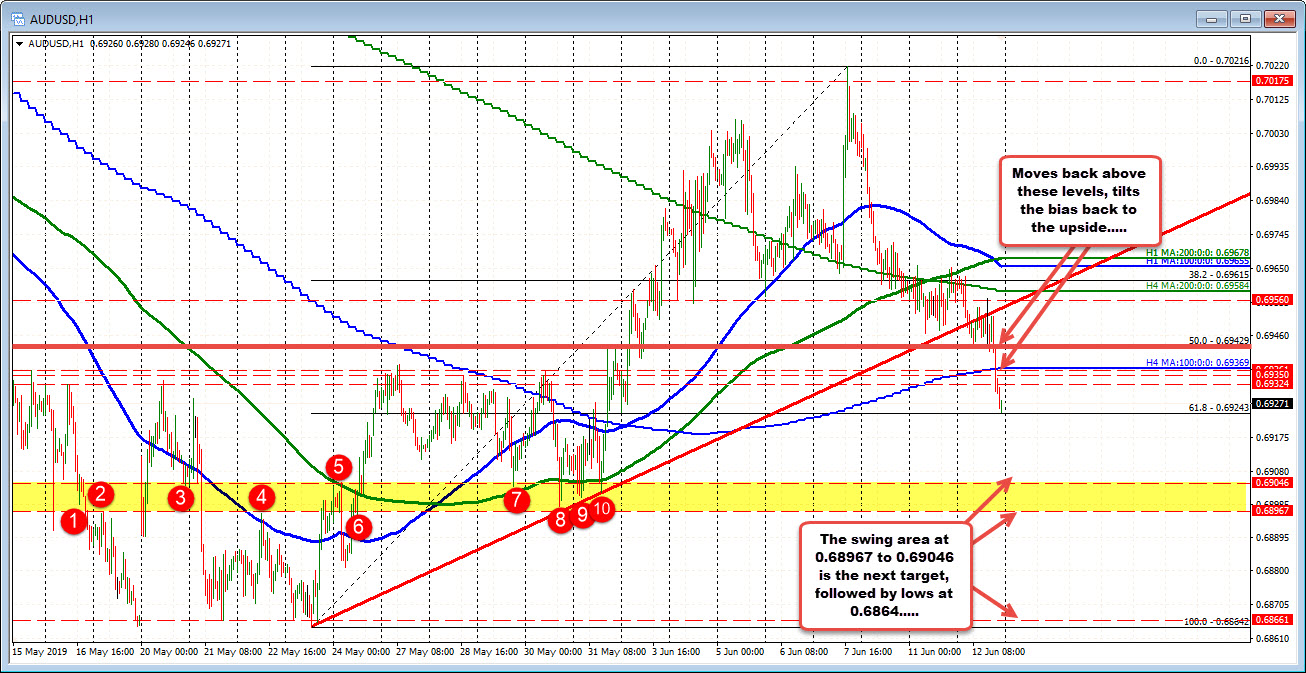
The AUDUSD has moved lower since peaking last on Friday. The fall today fell away from the
200 hour MA (at 0.69678 currrently),
below a trend line,
the 50% retracement at 0.69429,
and the 100 bar MA on the 4-hour chart at 0.69369.
The 100 bar MA and the 50% retracement will be risk/bias shifting levels in the new day. Trade back above those levels, and the bias tilts more back to the upside (likely on stronger data). On the downside, the 0.6896 to 0.6904 is home to a number of swing levels (see red numbered circles). A move below that level will have traders looking toward the May lows at 0.6864. Below that level, and the 2016 low at 0.6826 and the January 3 flash crash low at 0.6741
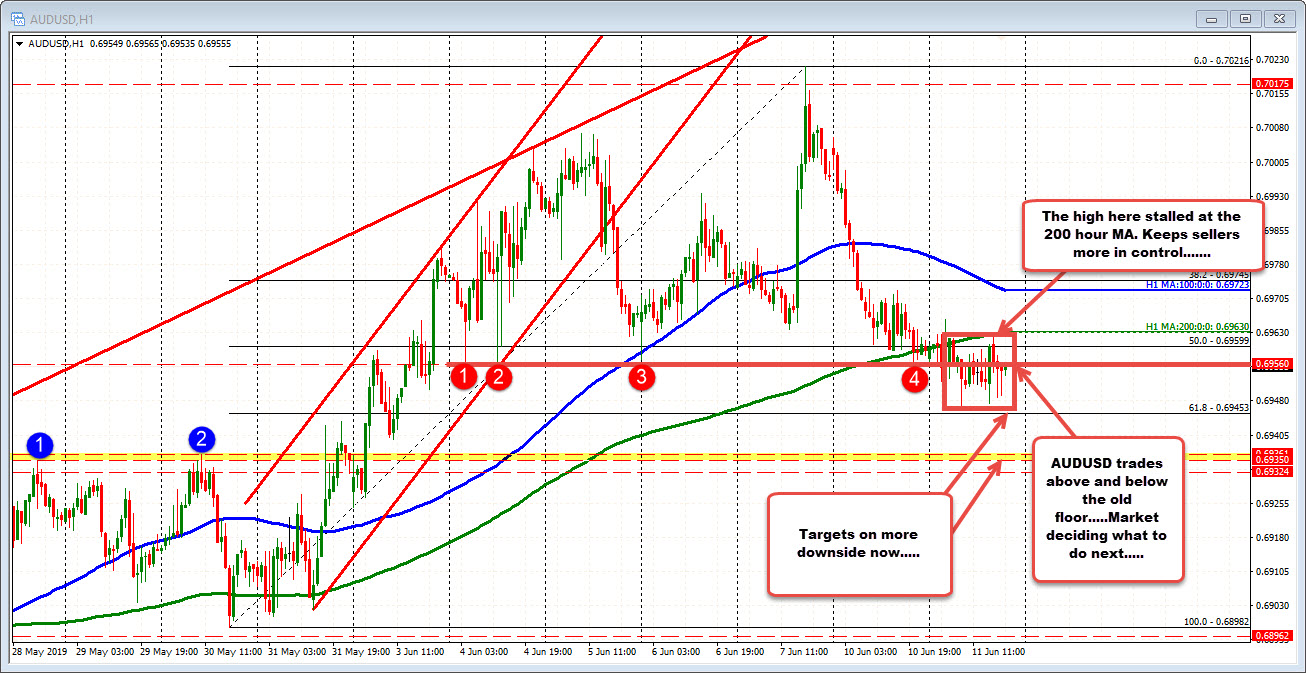
The AUDUSD has been waffling up and down in trading today. The low to high trading range is only 20 pips on the day. The 22 day average is 41 pips. So the range is 1/2 what is normal over the last month of trading. The price has been trading above and below an old floor area at the 0.6956 level. The market is unsure what to do now.
The most recent high in the NY session stalled at the 200 hour MA (green line currently at 0.6963). The price is also below the 50% retracement of the move up from the May 30 low at 0.69599. Stay below each keeps the sellers more in control/tlts the bias to the downside. If the sellers are able to keep the the lid on the pair (stay below 200 hour MA), the 61.8% at 0.69453, and then the 0.6935-36 area (swing highs from May 28 and May 30) will be targeted.
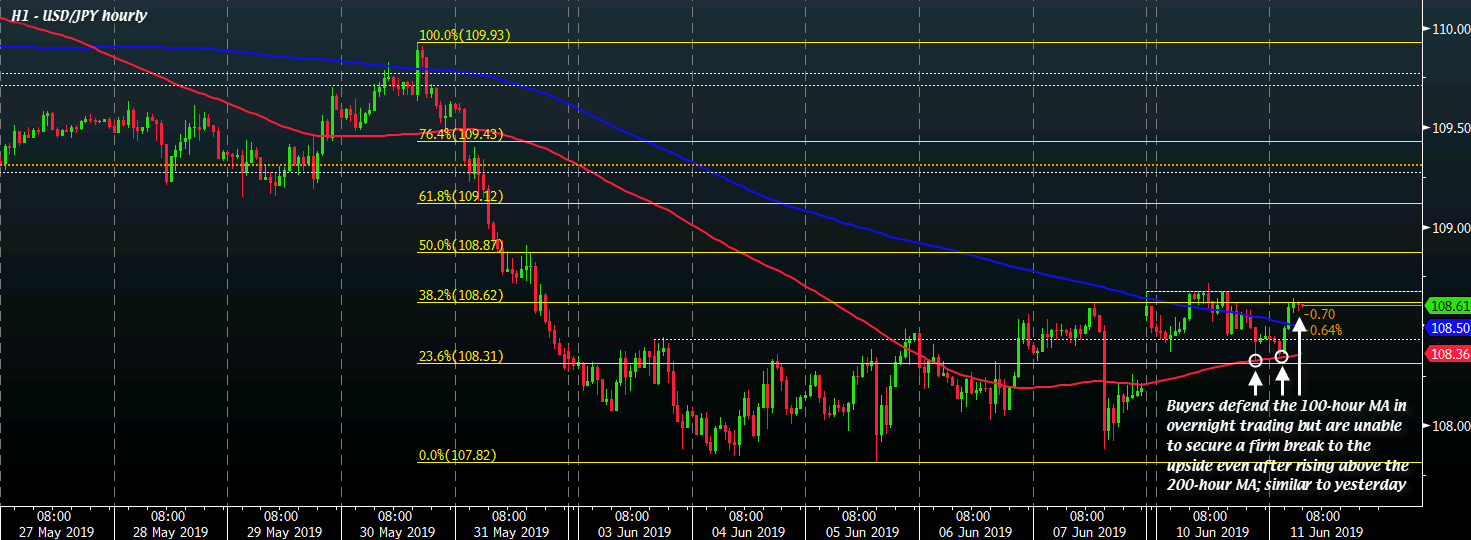
USD/JPY is back to where it started in the European morning yesterday
Price is trading just above the 200-hour MA (blue line) again near 108.60 in an exact repeat of the start of European trading yesterday. Buyers are in near-term control but they continue to lack the drive to extend the upside momentum as markets remain a bit cautious despite some improvement in global trade tensions. Overnight, we saw US equities finish higher but near their lows and that indicates some nervousness still present among investors for the time being. With Treasury yields also trading more flat today, I reckon it’s giving reason for buyers to not get too carried away as we begin the new week. They did however defend the 100-hour MA (red line) yesterday and earlier today, which shows that they are poised to stay in near-term control. Hence, that level @ 108.36 and the 200-hour MA @ 108.50 will be key downside levels to watch out for today. Not to mention, there’s also large expiries rolling off at 108.50 too which could play a part in anchoring price action amid calmer tones today. As for upside levels, they remain similar to yesterday with further resistance seen around 108.87-90 before offers at 109.00 come into play. That is if price action starts moving away from the 38.2 retracement level and yesterday’s highs around 108.62-72. Looking ahead, the focus of the pair will remain on global trade tensions as we’ll have to see if Mexico will play ball to avoid tariffs and if Trump and Xi are set to meet at the G20 summit to help alleviate fears that we’re headed towards an all-out trade war.
The Yen continues retreating. Overview for 10.06.2019
10.06.2019
On Monday, USDJPY continues growing; the Japanese currency is under pressure.
The Japanese Yen is keeping the negative momentum and getting cheaper against the USD on Monday morning. The current quote for the instrument is 108.65.
In the morning, Japan published the final report on the GDP for the first quarter 2019. The indicator expanded by 0.6% q/q, which is a bit better than the preliminary reading. The components of the report show that the key contribution was made by the Capital Expenditure, which added 0.3% q/q against the expected reading of -0.3% q/q. The Net Export added 0.4%. In general, the GDP improves just as expected, although the Japanese economy is obviously under significant pressure due to escalated global trade wars.
The Bank Lending added 2.6% y/y in May against the expected reading of +2.4% y/y.
The Eco Watchers Survey dropped to 44.1 points in May after being 45.5 points the month before. The indicator shows sentiment of large companies’ staff towards the consumer expenditure dynamics. If the value is below 50 points, pessimistic sentiment prevails.