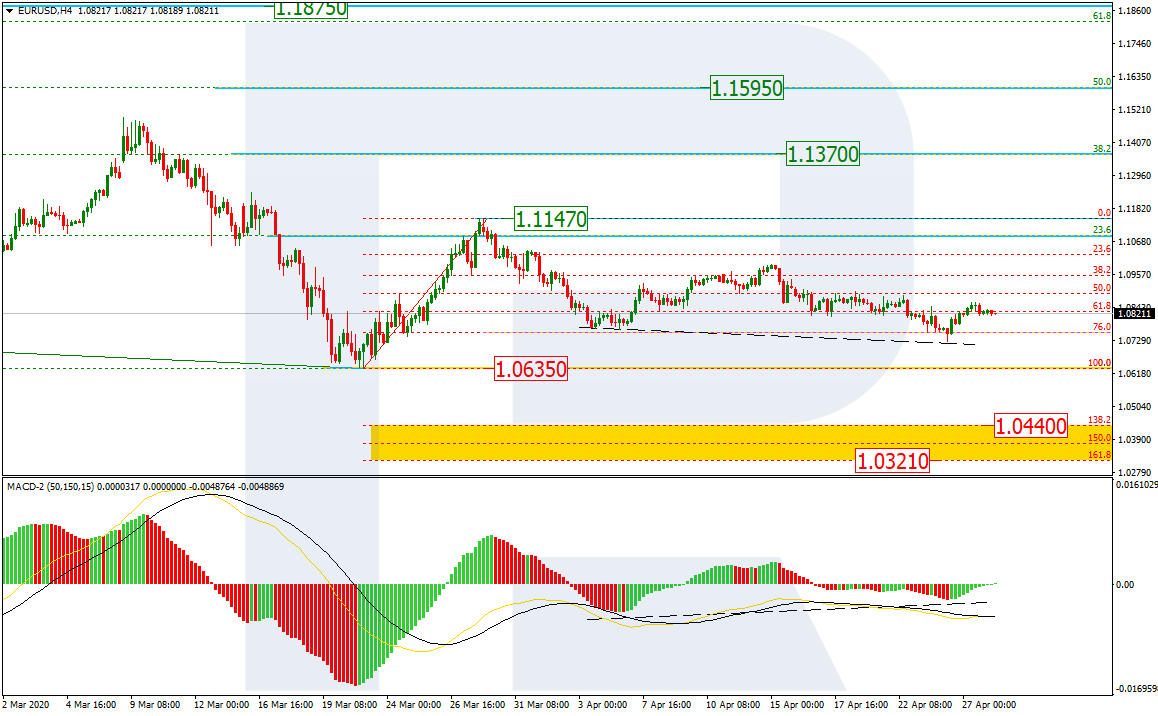
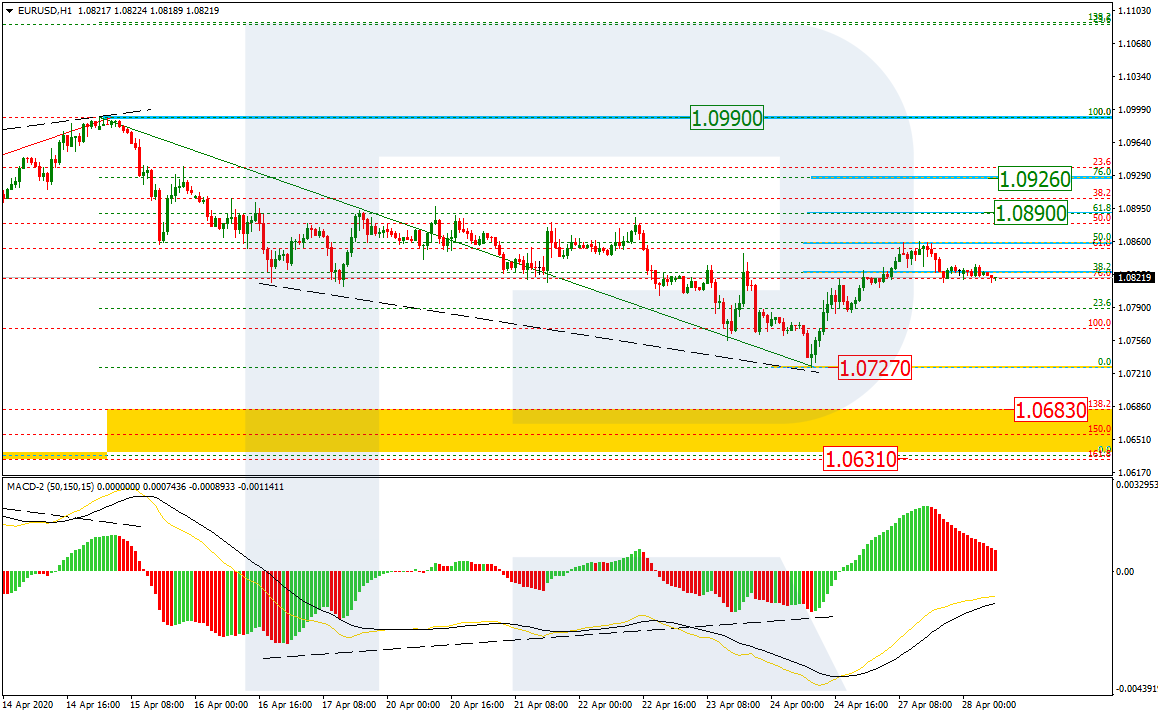
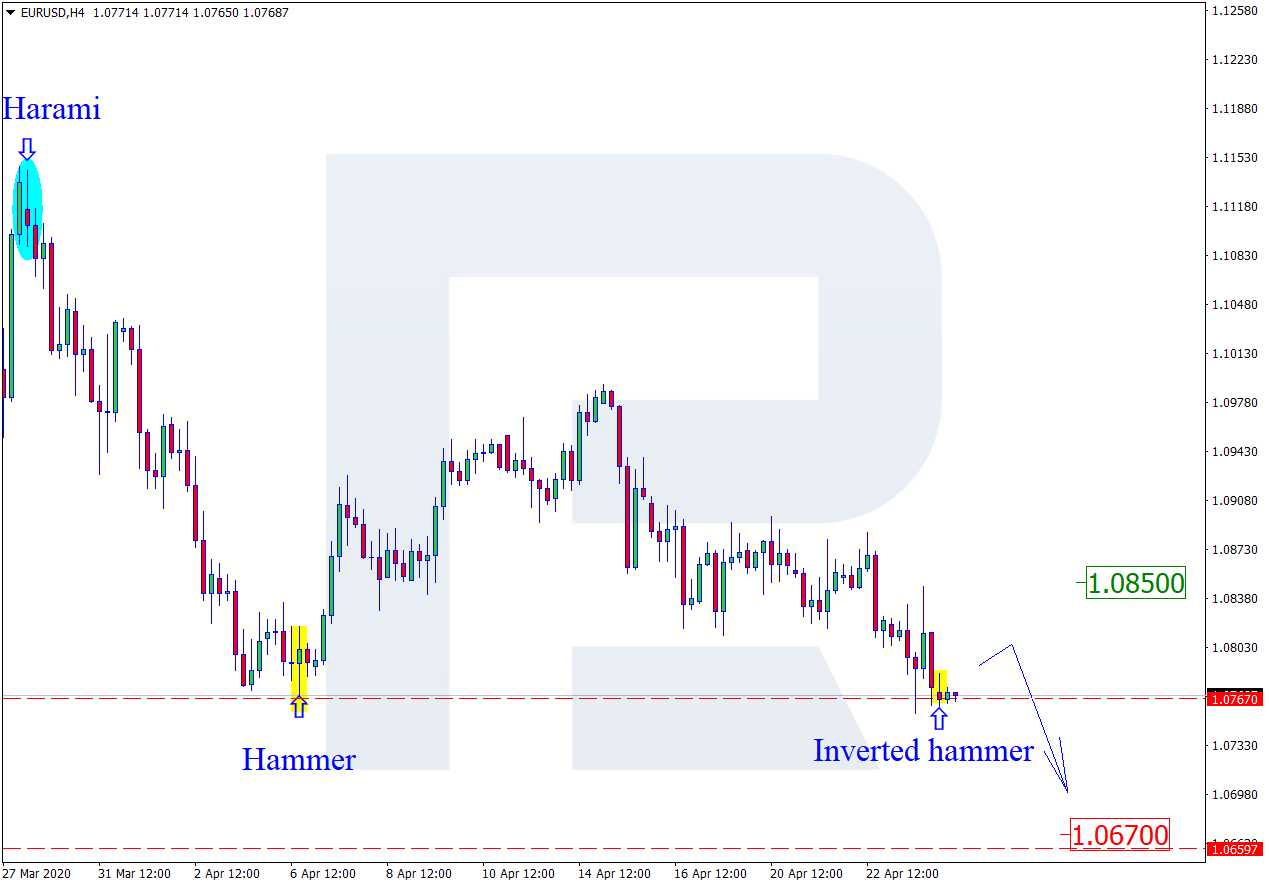
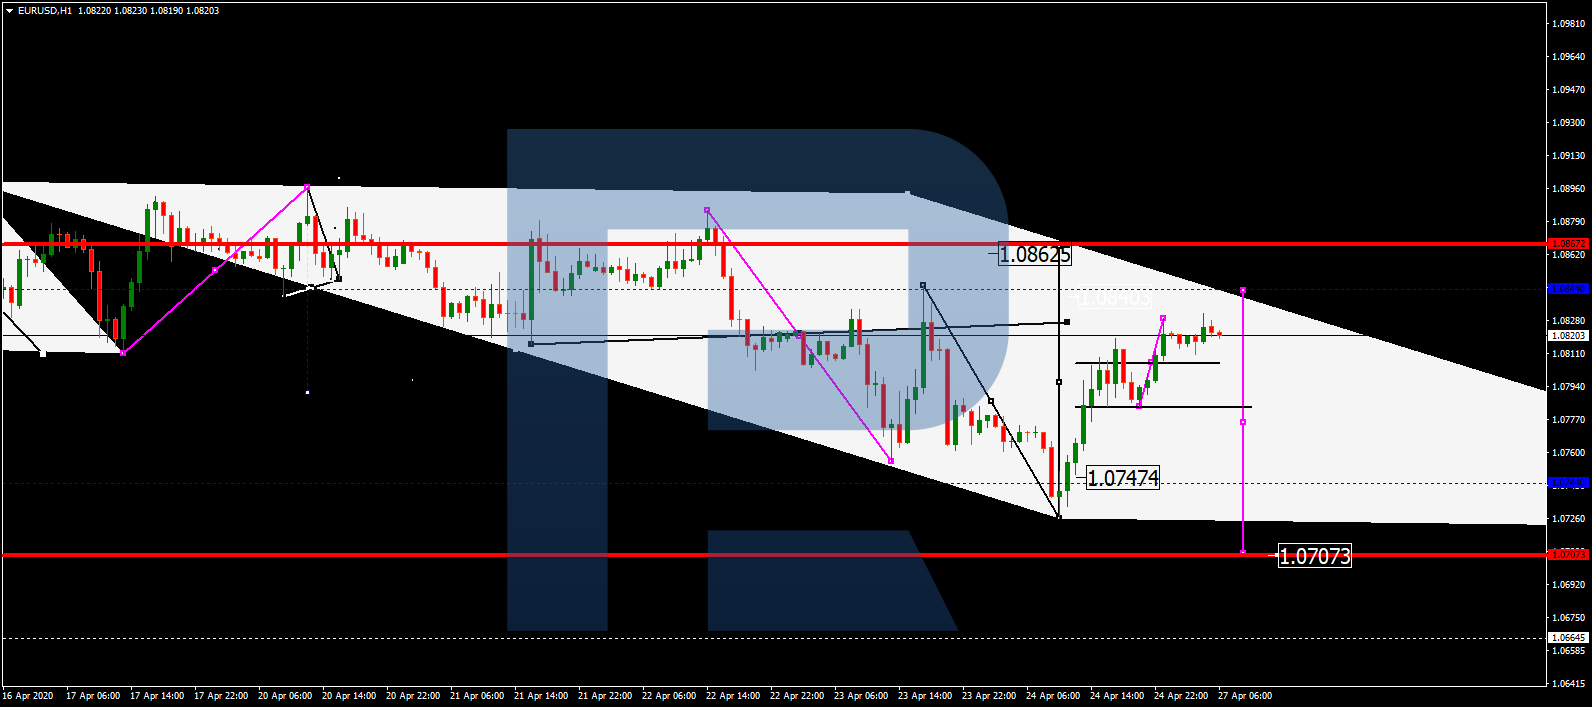
EURUSD, “Euro vs US Dollar”
After finishing the descending wave at 1.0730 and then forming the consolidation range around 1.0800, EURUSD has broken it to the upside; right now, it continues the ascending correction. Possibly, the pair may grow to reach 1.0860 to complete the correction and then resume trading inside the downtrend with the target at 1.0700.

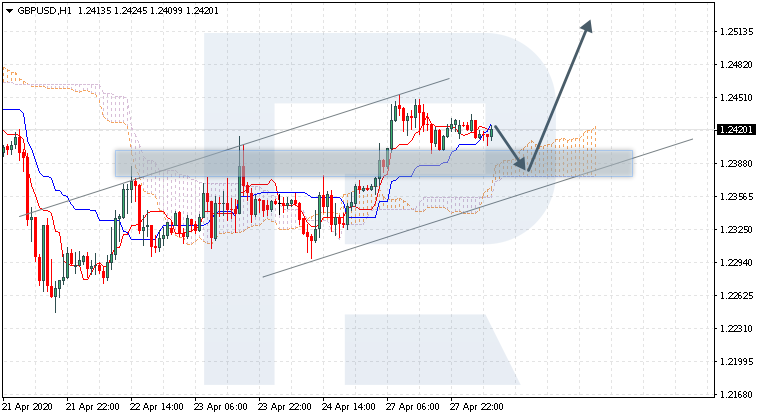
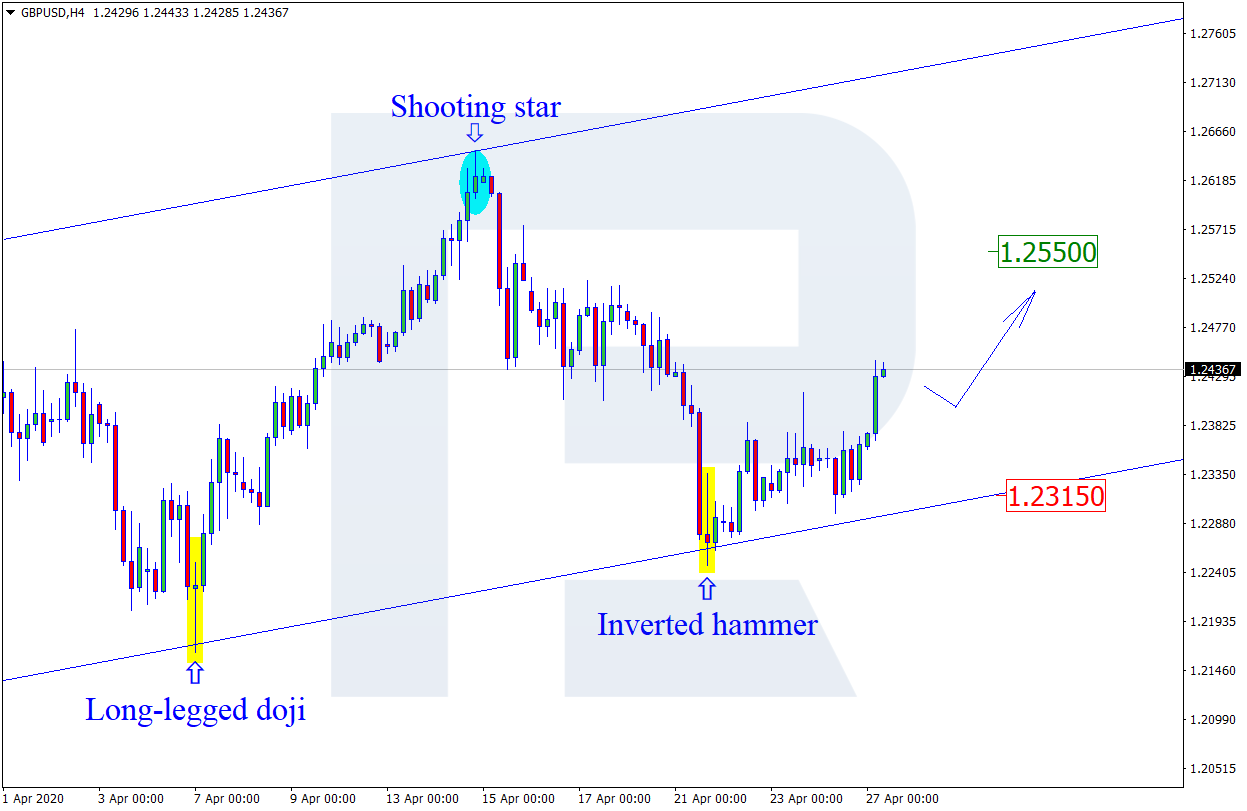
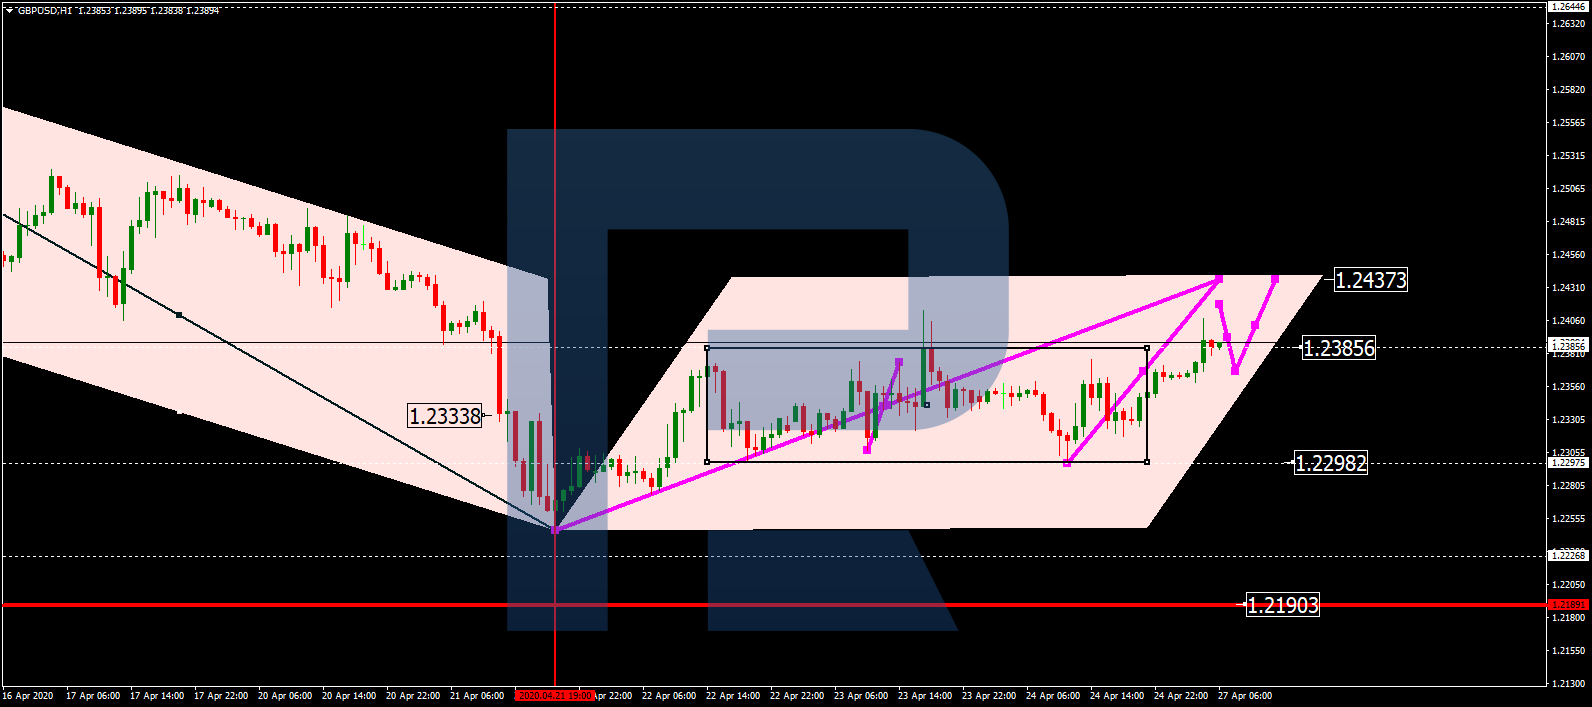
GBPUSD, “Great Britain Pound vs US Dollar”
After forming the consolidation range around 1.2340 and breaking it to the upside at 1.2385, GBPUSD is expected to choose an alternative scenario and continue the correction towards 1.2437. After that, the instrument may start another decline with the short-term target at 1.2190.
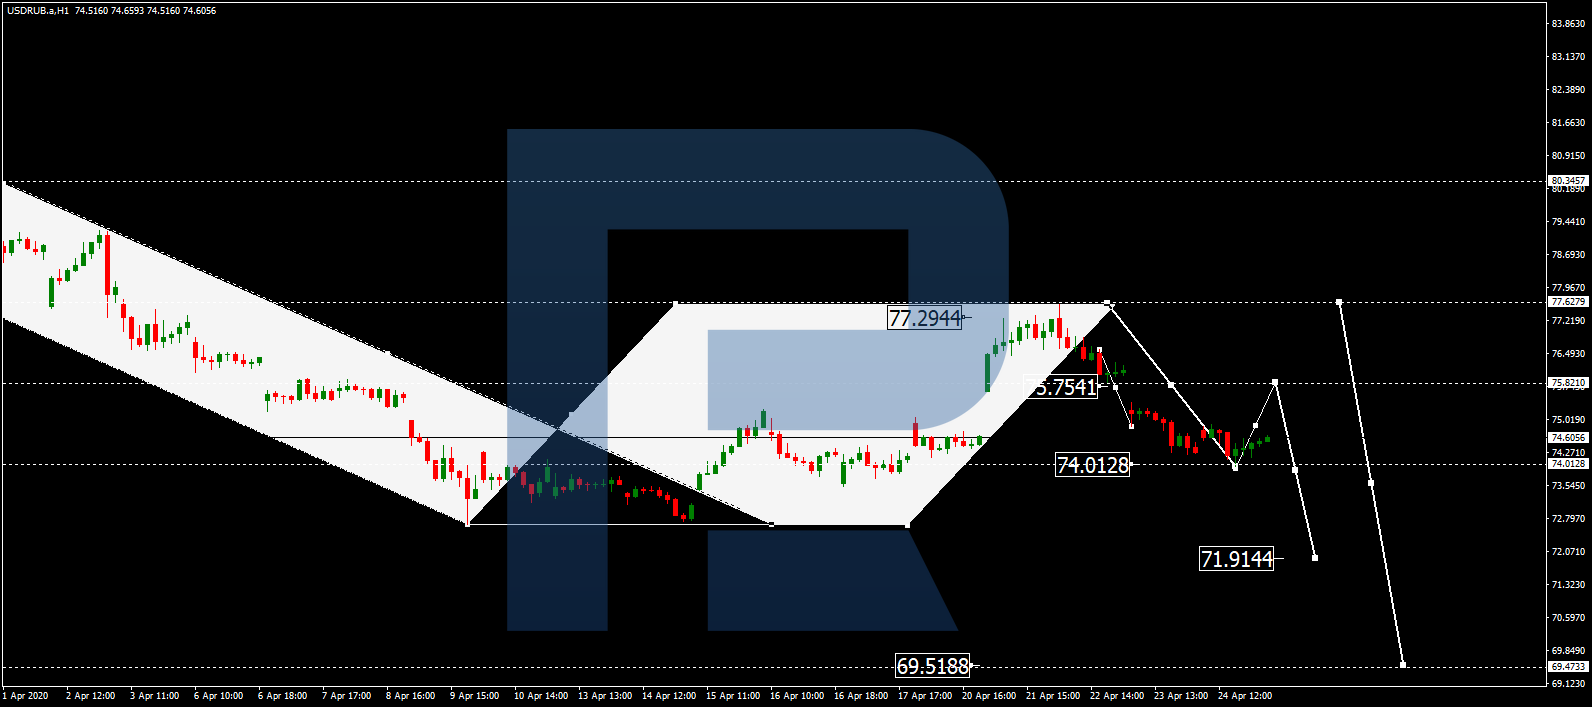
USDRUB, “US Dollar vs Russian Ruble”
After finishing the descending wave at 74.00, USDRUB is expected to correct towards 75.80. After that, the instrument may form a new descending structure to break 74.00 and then continue trading inside the downtrend with the short-term target at 71.92.
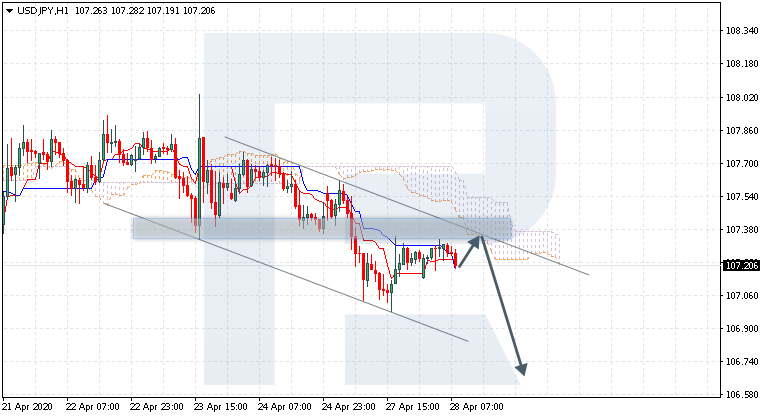
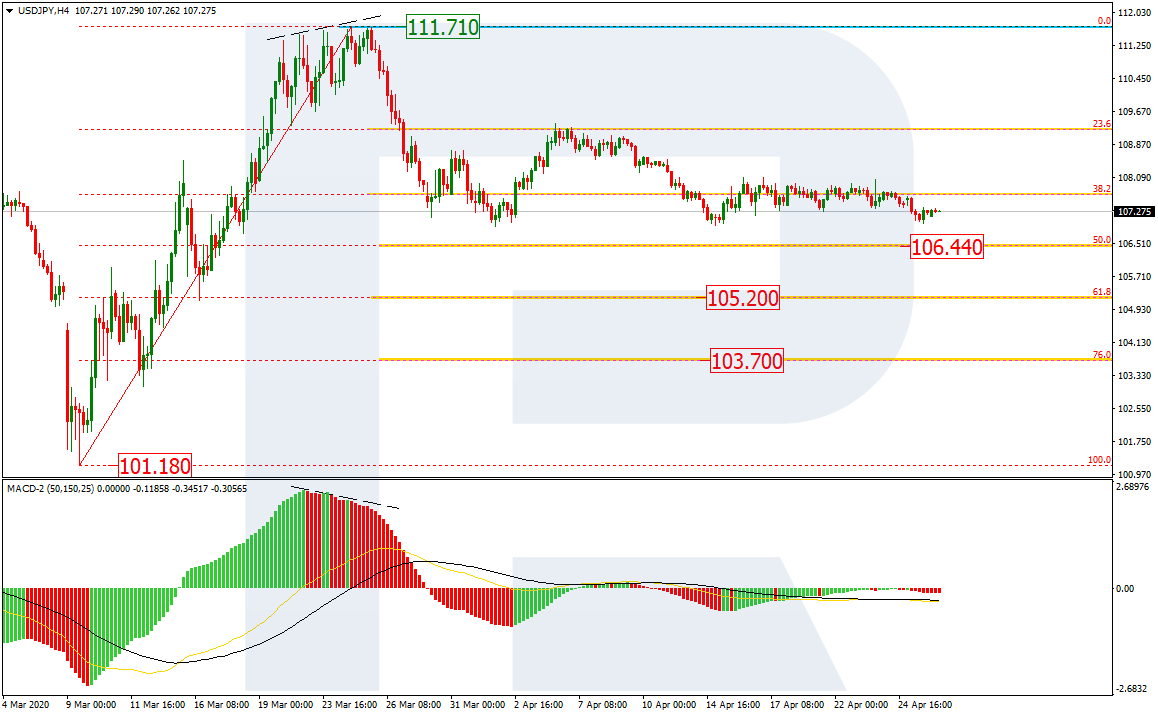
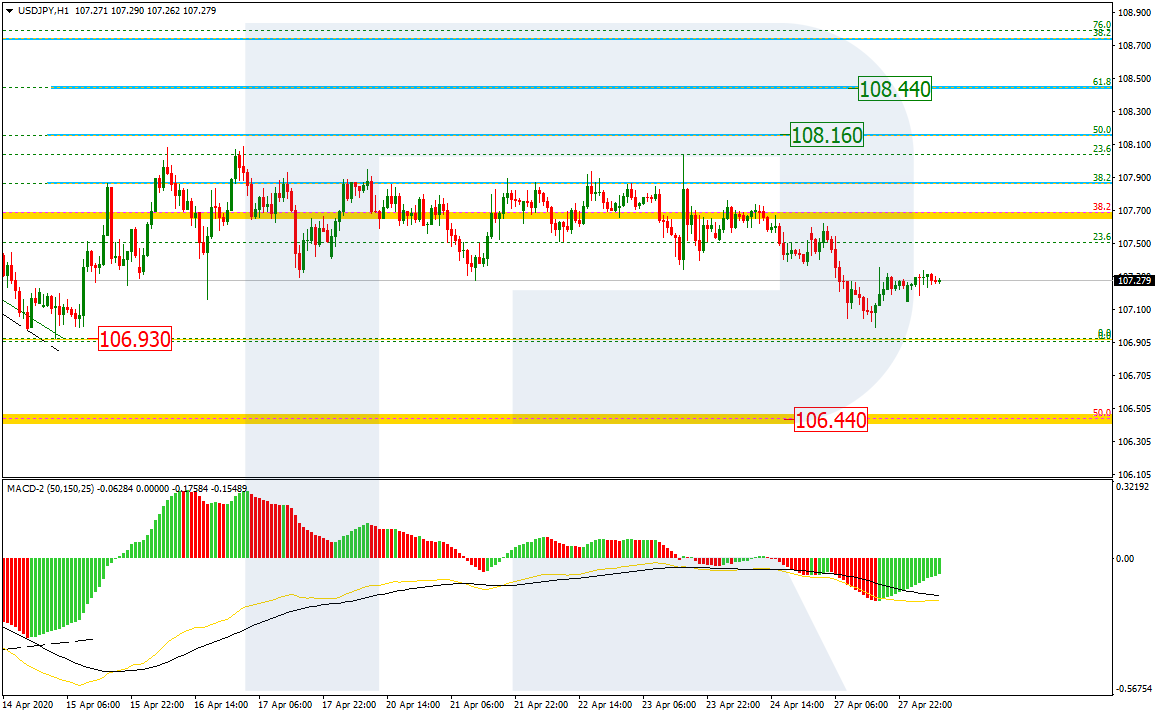
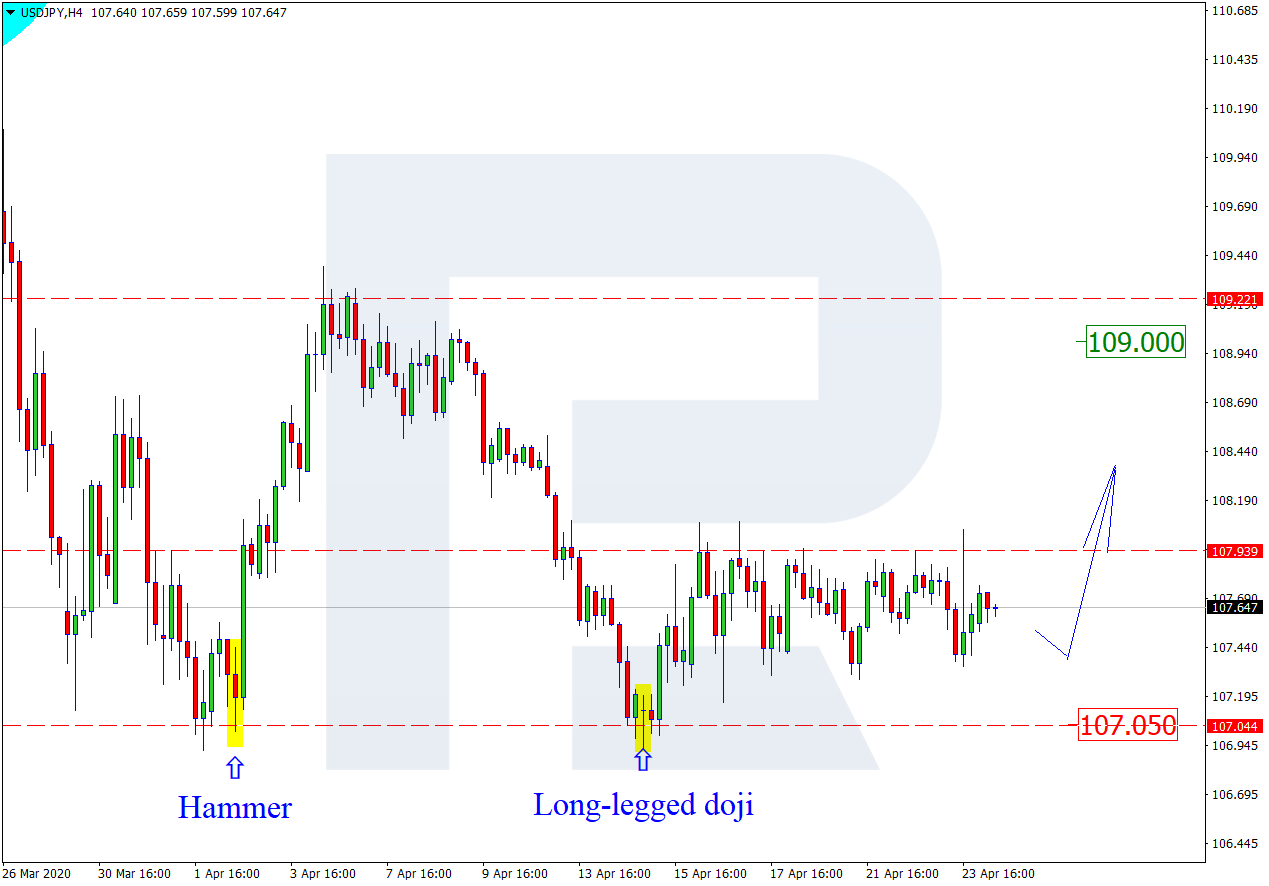
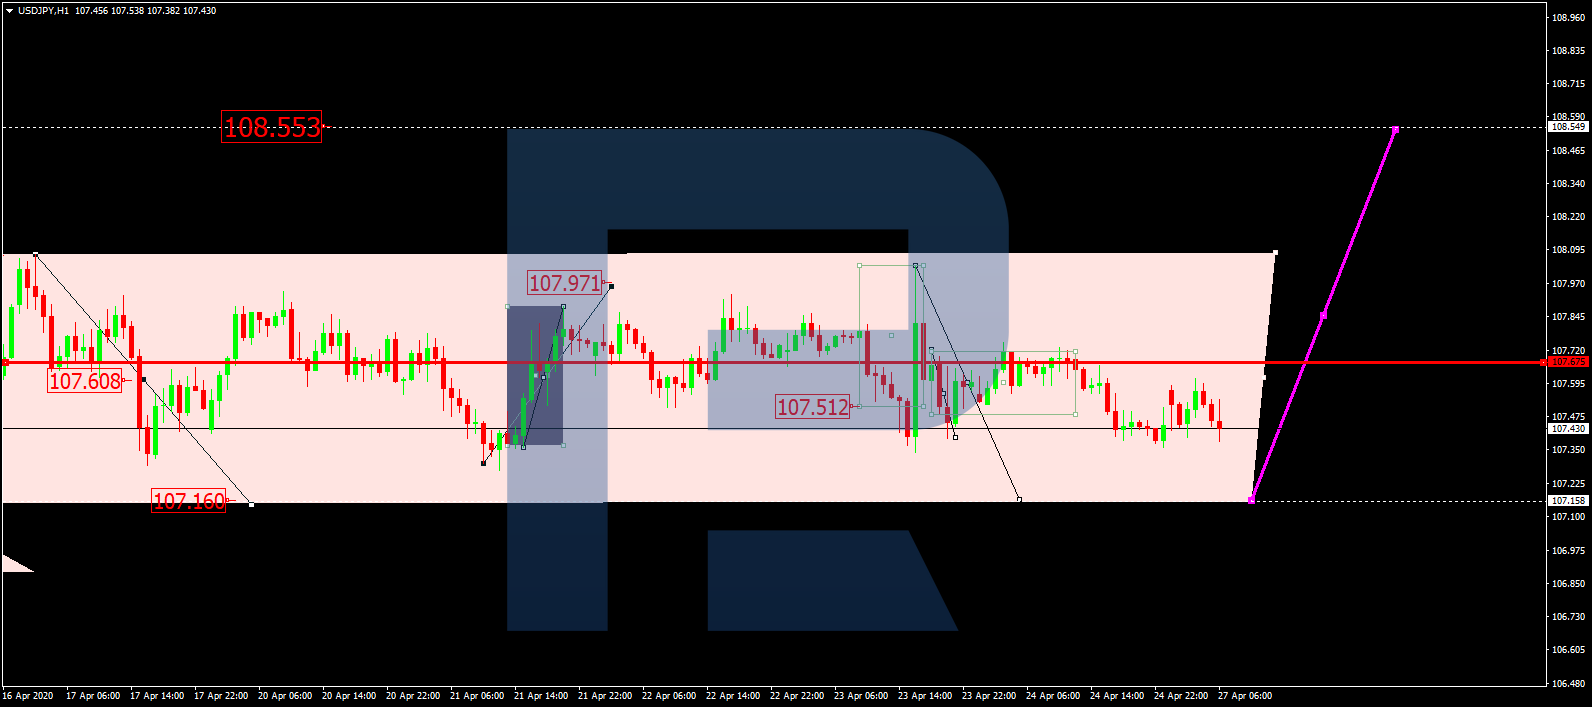
USDJPY, “US Dollar vs Japanese Yen”
After breaking 107.60, USDJPY continue moving downwards to reach 107.15. Later, the market may grow to break 107.60 and then continue trading upwards with the target at 108.05.
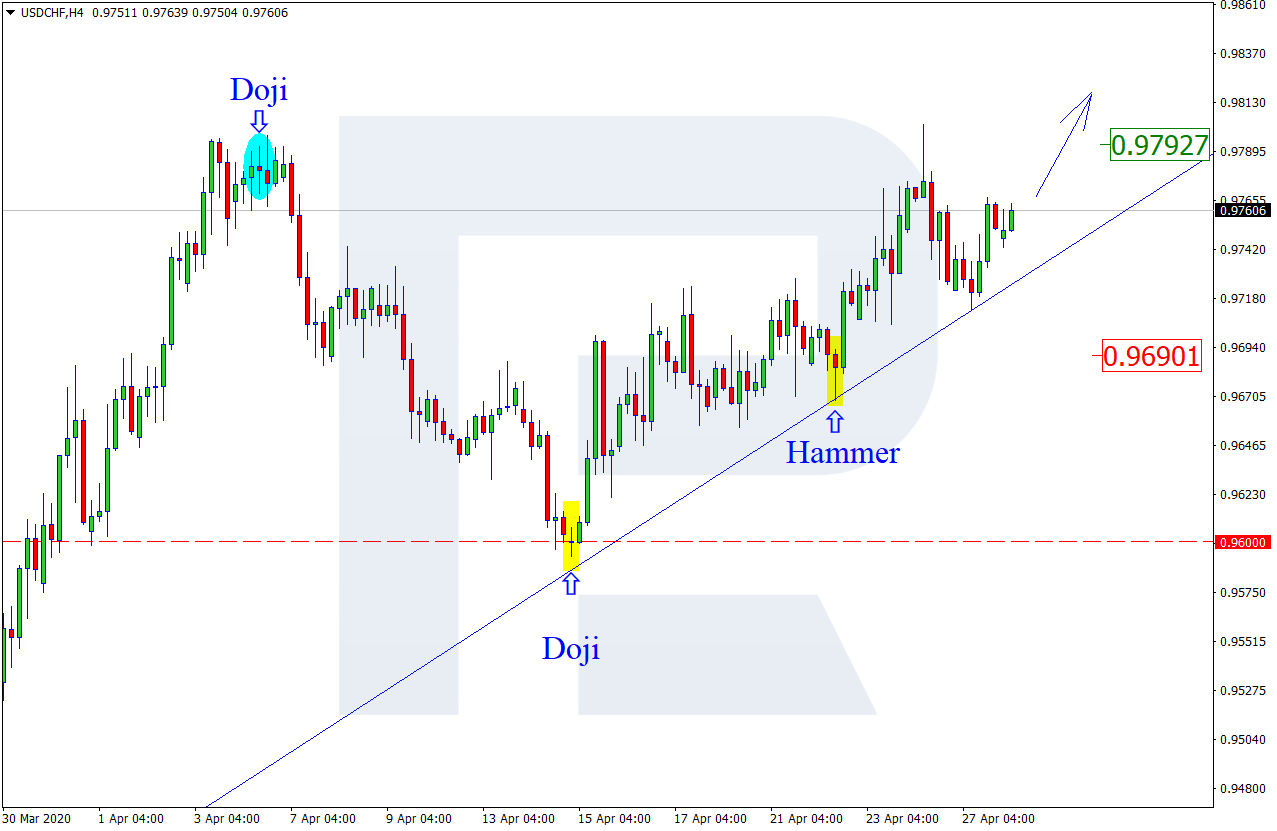
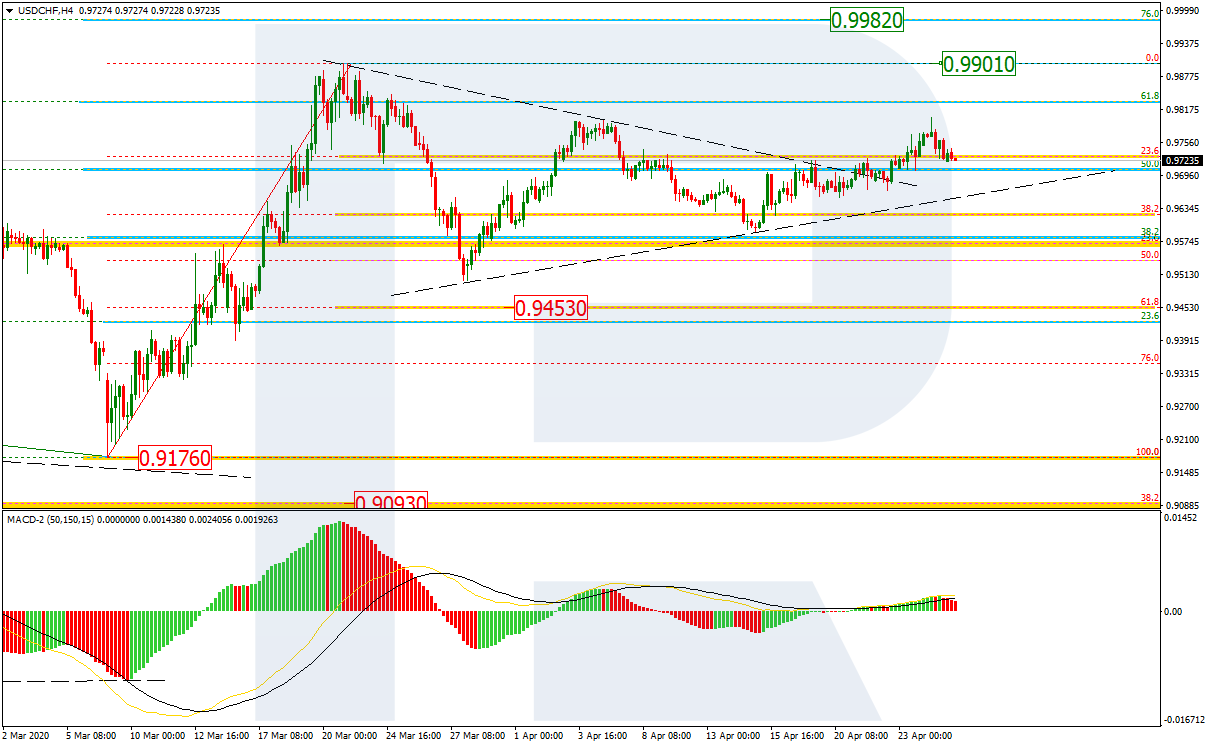
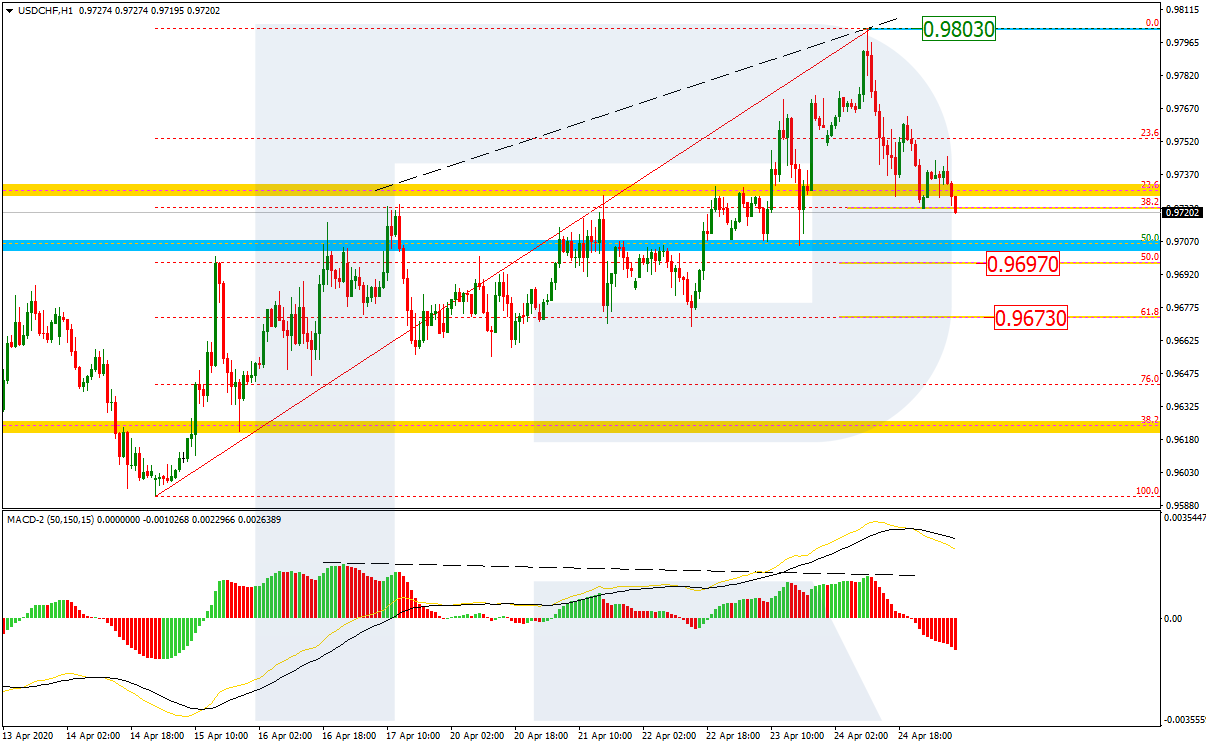
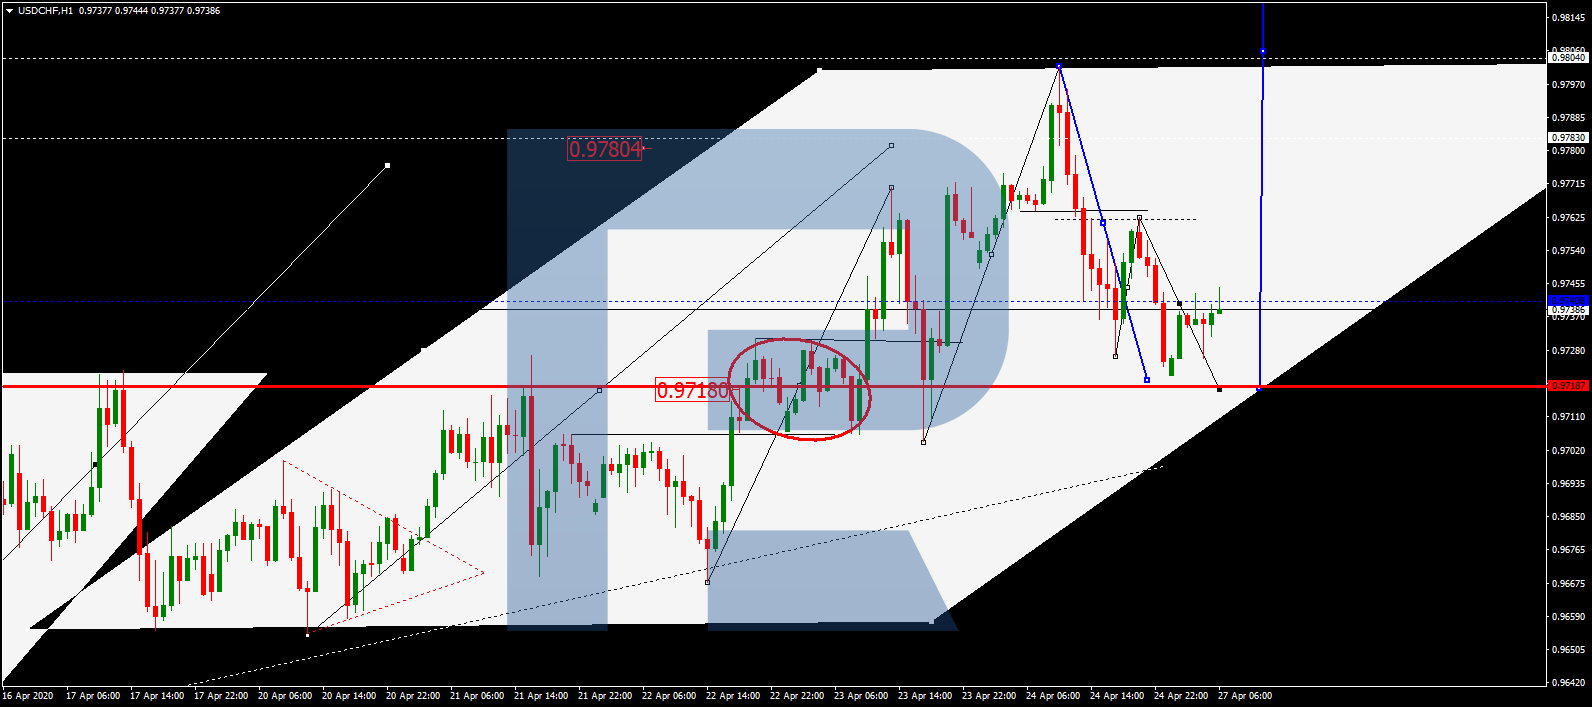
USDCHF, “US Dollar vs Swiss Franc”
After completing the ascending wave at 0.9800, USDCHF is correcting downwards to reach 0.9715. after that, the instrument may form one more ascending structure with the target at 0.9850.
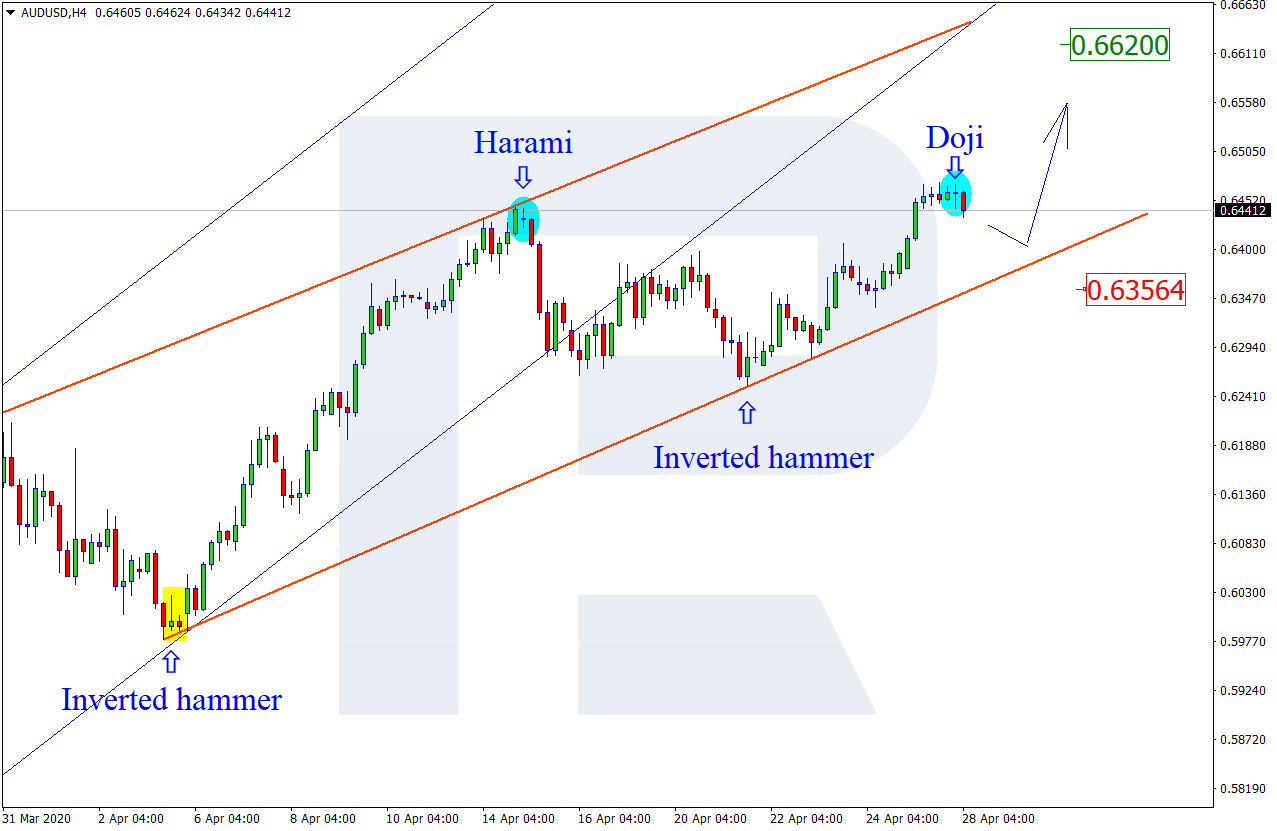
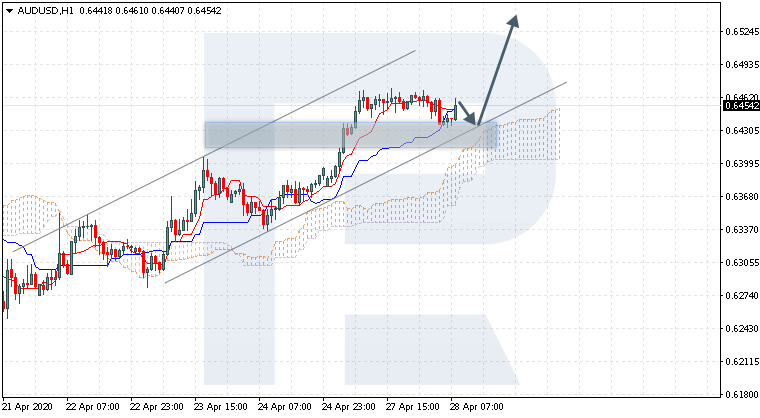
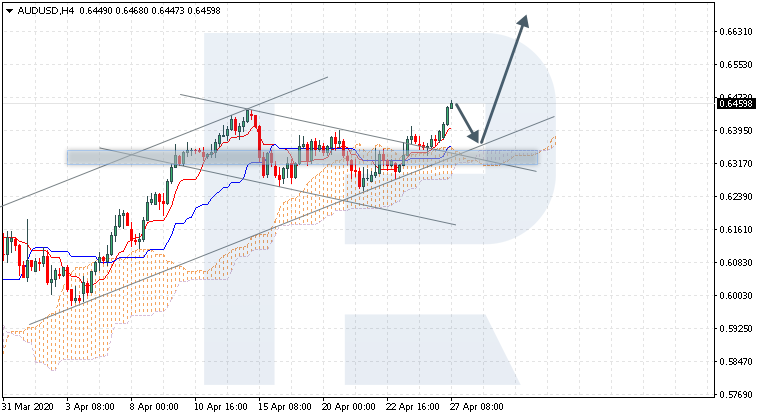
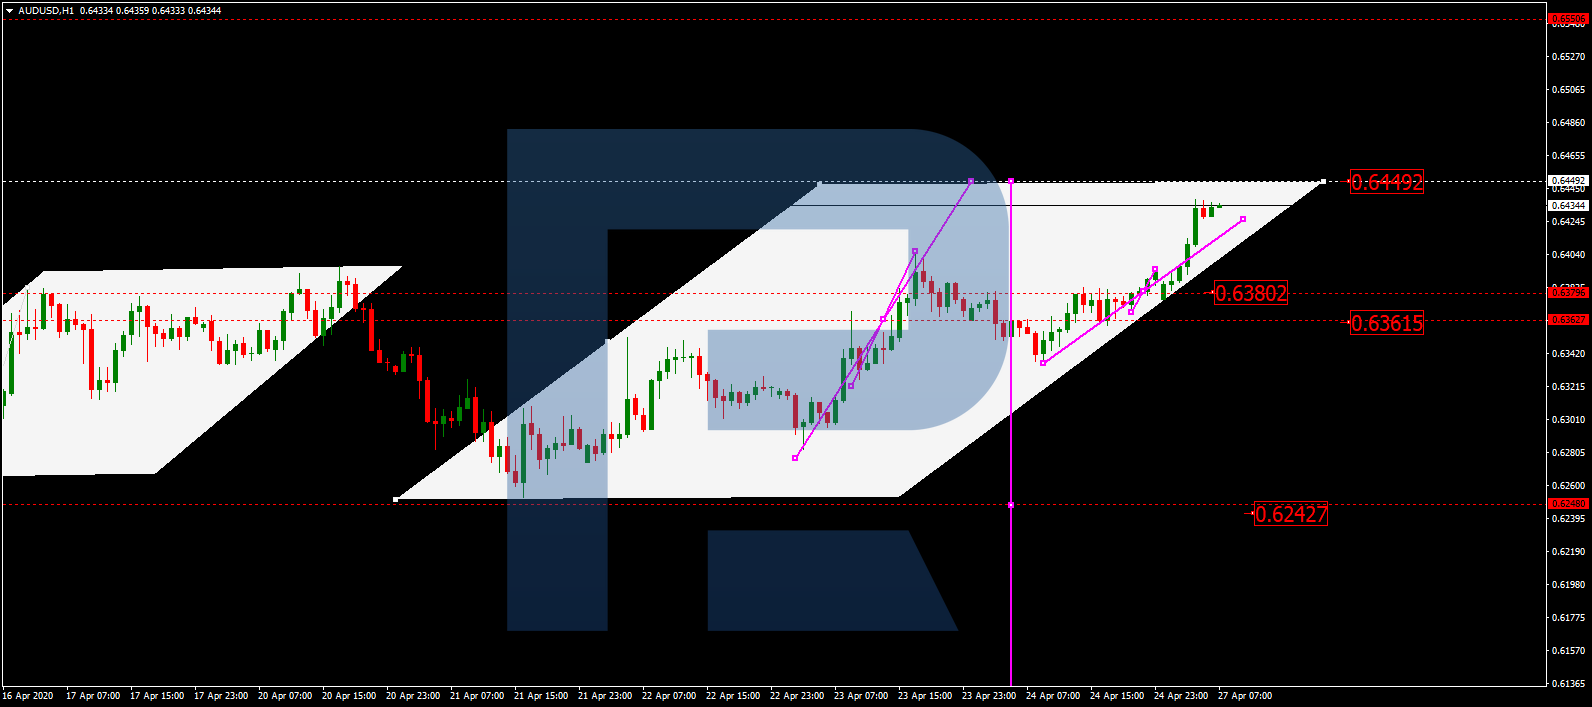
AUDUSD, “Australian Dollar vs US Dollar”
AUDUSD is still growing. Possibly, the pair may reach 0.6444 and then fall to break 0.6380. After that, the instrument may continue trading downwards with the target at 0.6250.
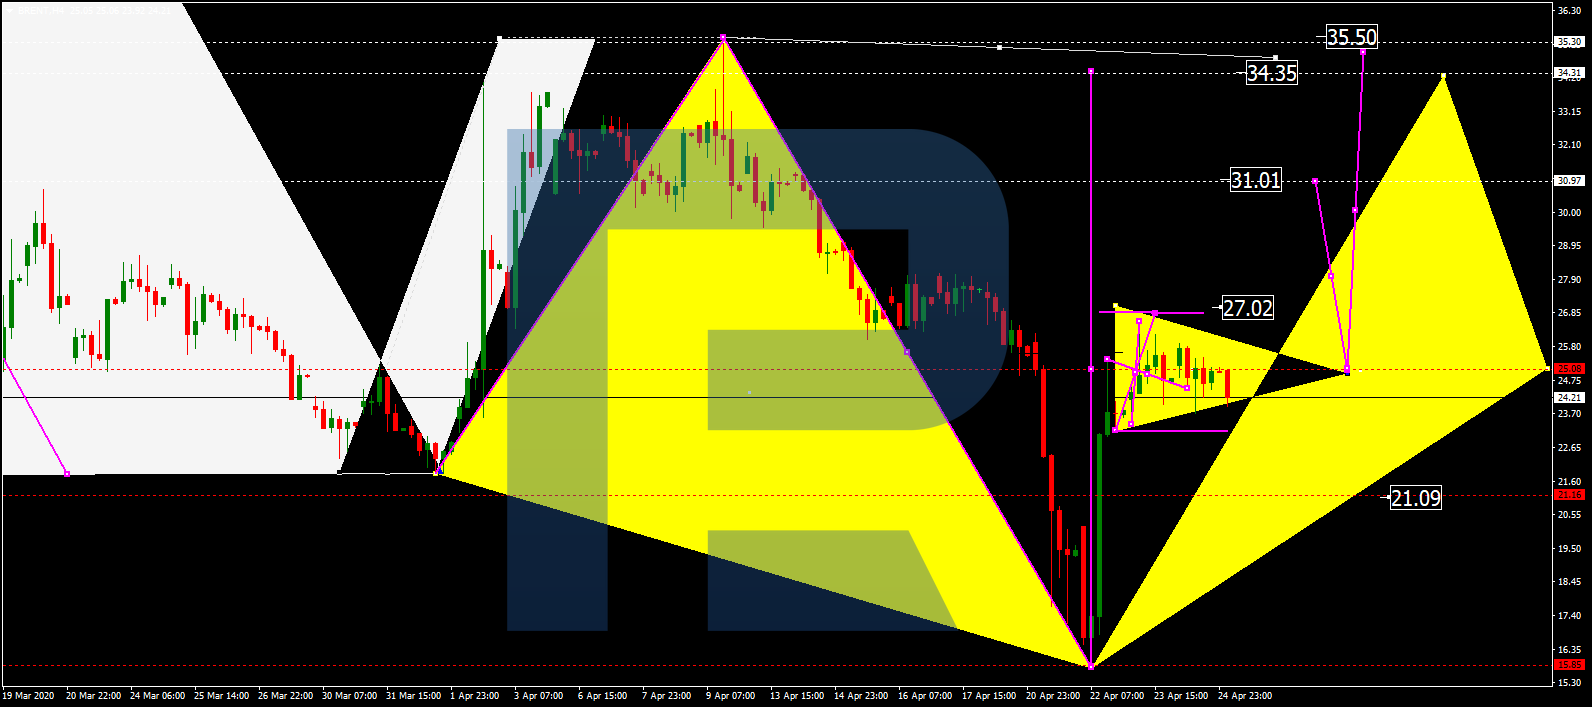
BRENT
Brent is consolidating around 25.00 without any particular direction. Possibly, the pair may break 23.06 to the downside and then start a new correction to reach 21.10. Later, the market may form one more ascending structure to break 27.00 and then continue trading upwards with the short-term target at 31.00.
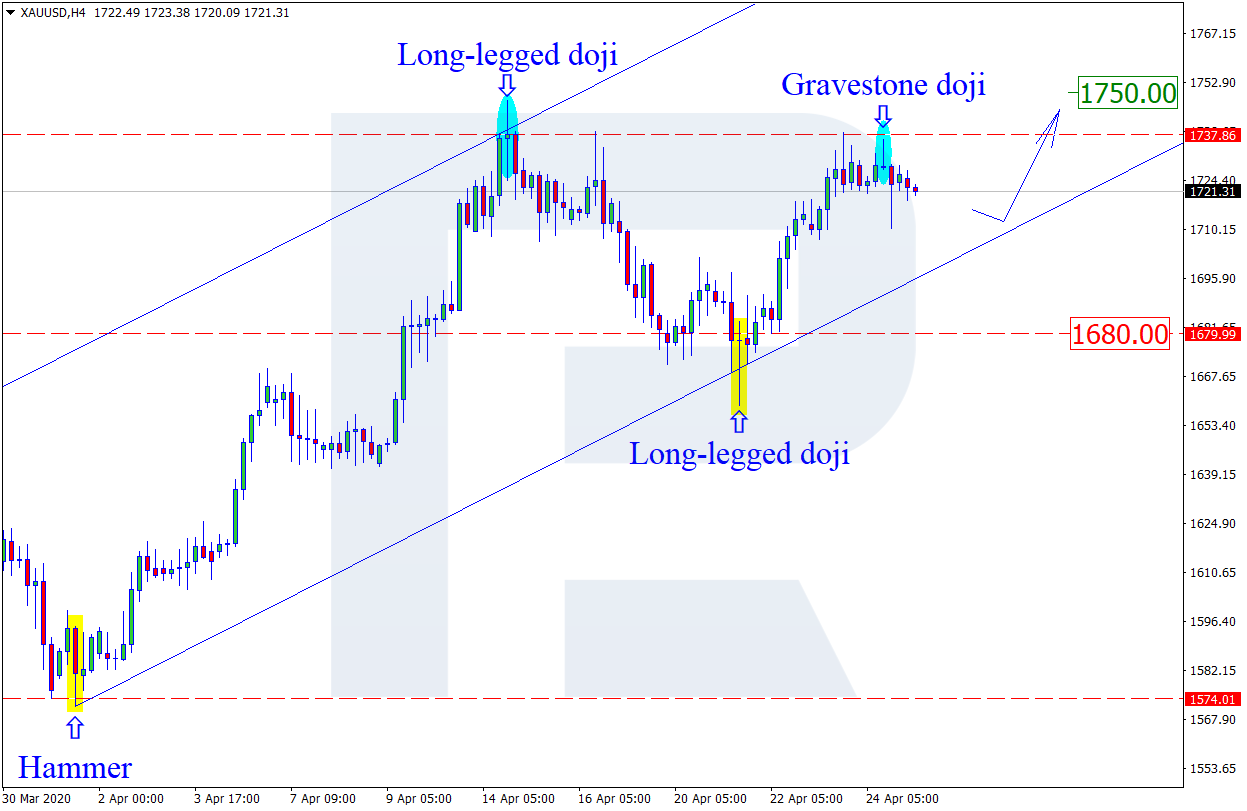
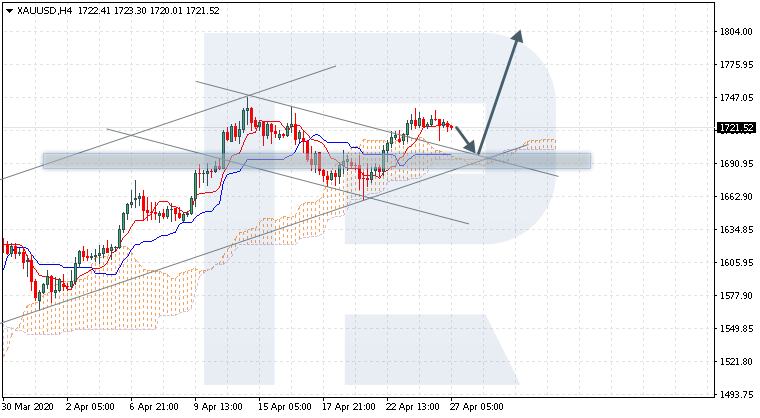
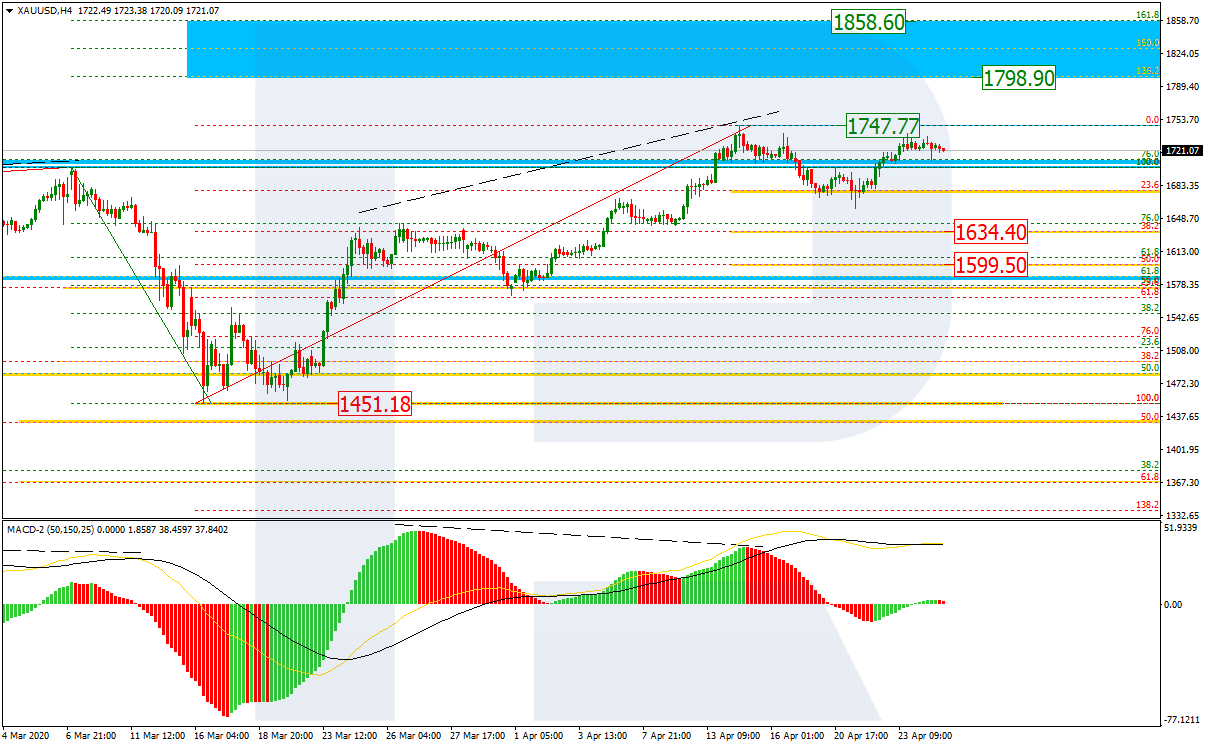
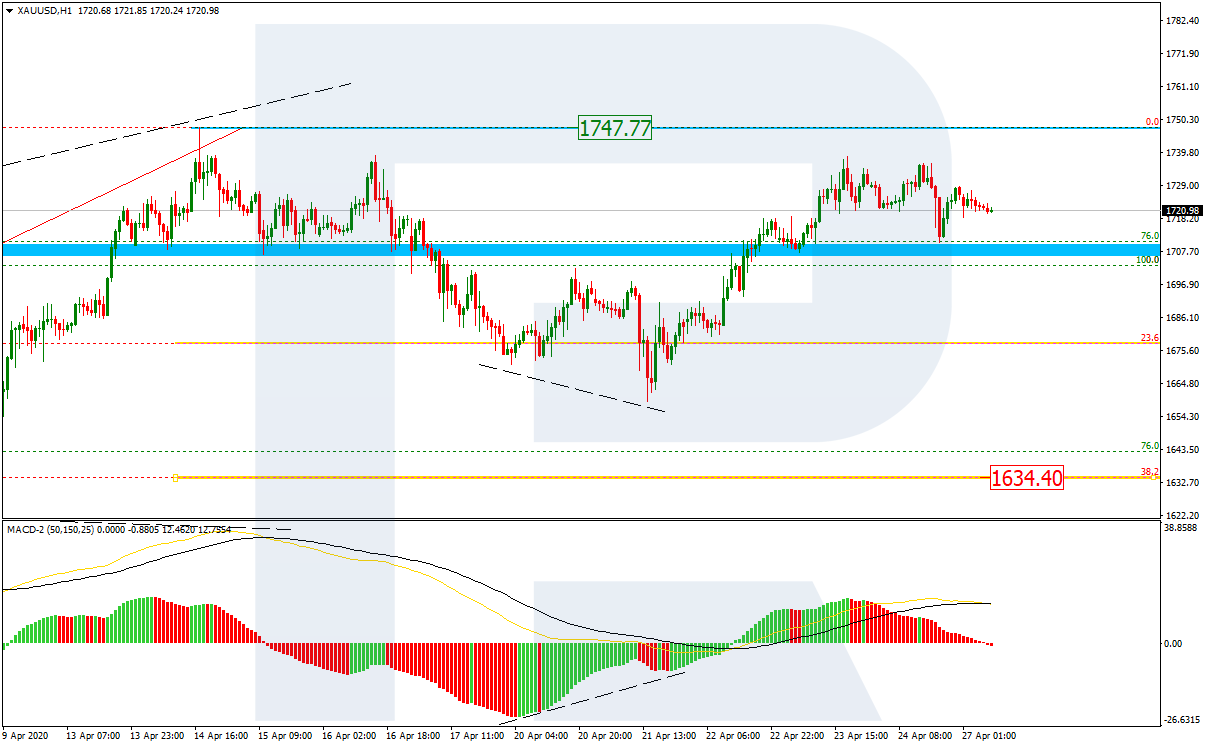
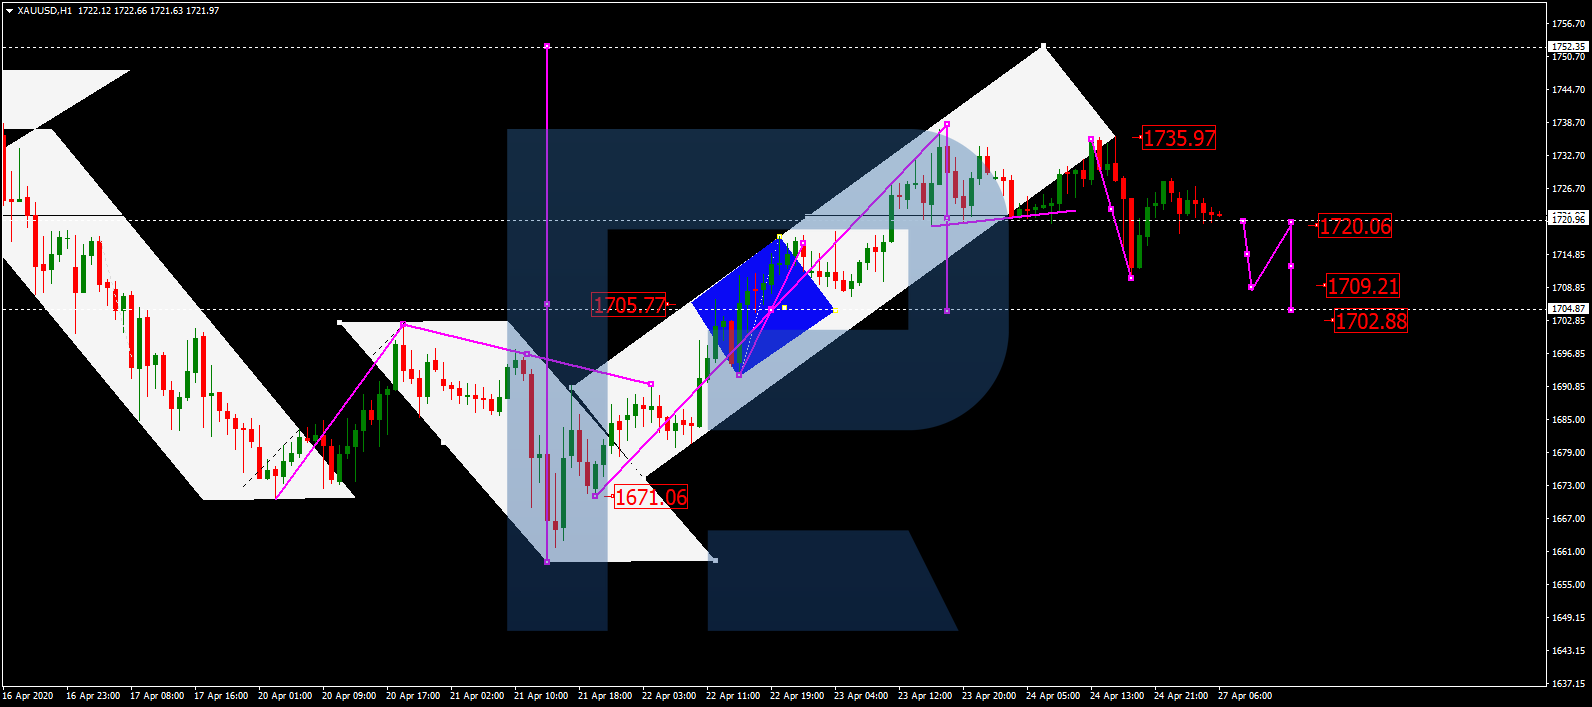
XAUUSD, “Gold vs US Dollar”
Gold is still consolidating around 1720.00. Today, the pair may fall towards 1702.88 and then grow to return to 1720.00, thus forming a new consolidation range. If later the price breaks this range to the downside, the market may correct with the target at 1695.50; if to the upside – start another growth to reach 1752.35.
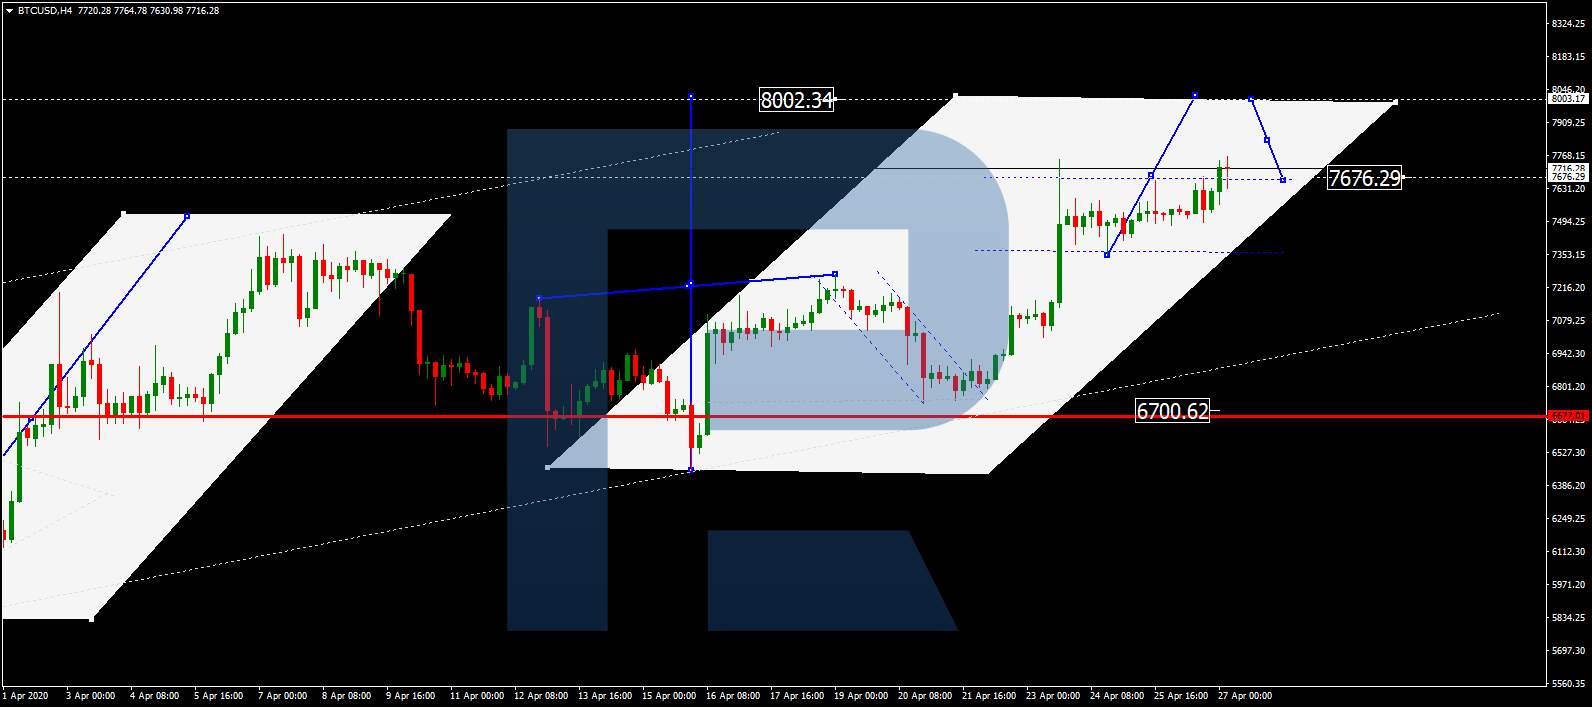
BTCUSD, “Bitcoin vs US Dollar”
BTCUSD is moving upwards; it has broken 7600.00 and may continue growing towards 8000.00. Later, the market may start a new correction to reach 7250.00 and then form one more ascending structure with the target at 9000.00.
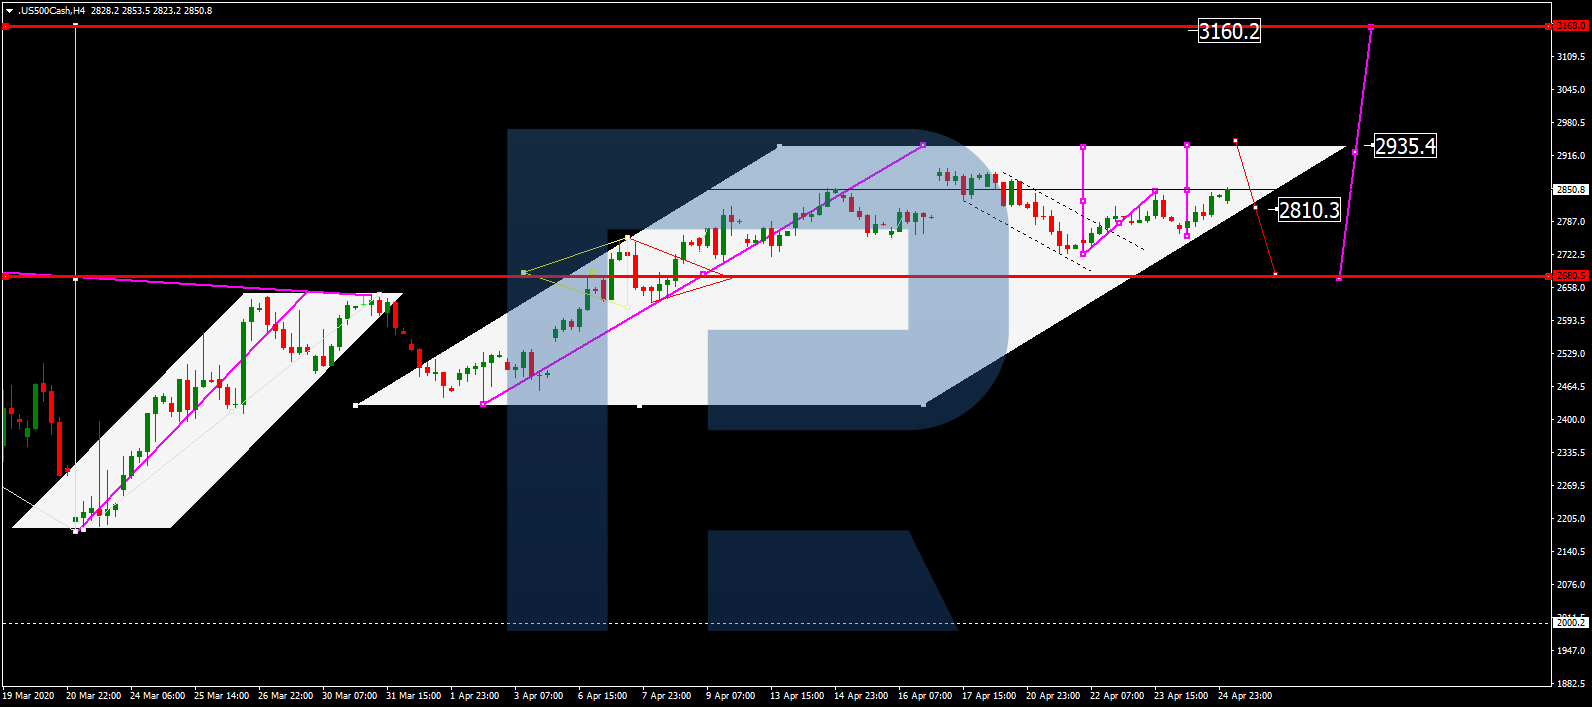
S&P 500
S&P 500 is moving upwards; it has broken 2845.1 and may continue growing towards 2935.4. after that, the instrument may correct to reach 2680.5 and then start another growth with the target at 3160.2.