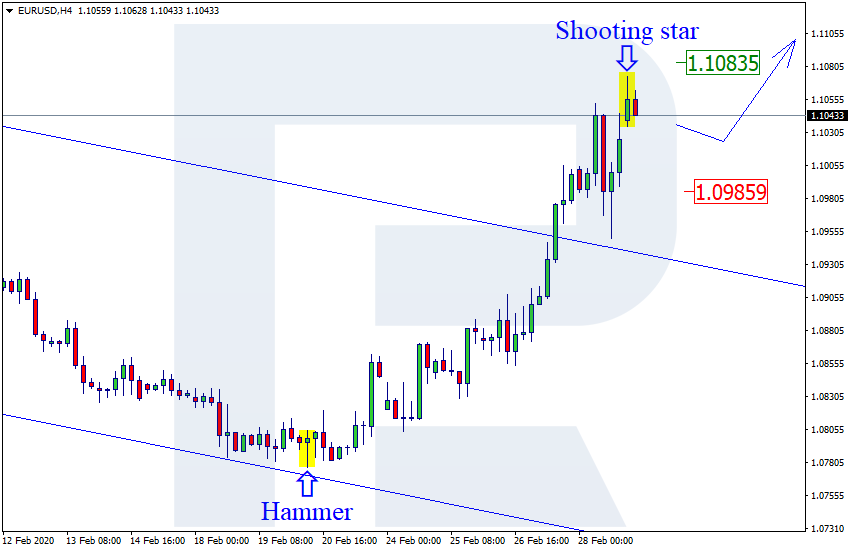
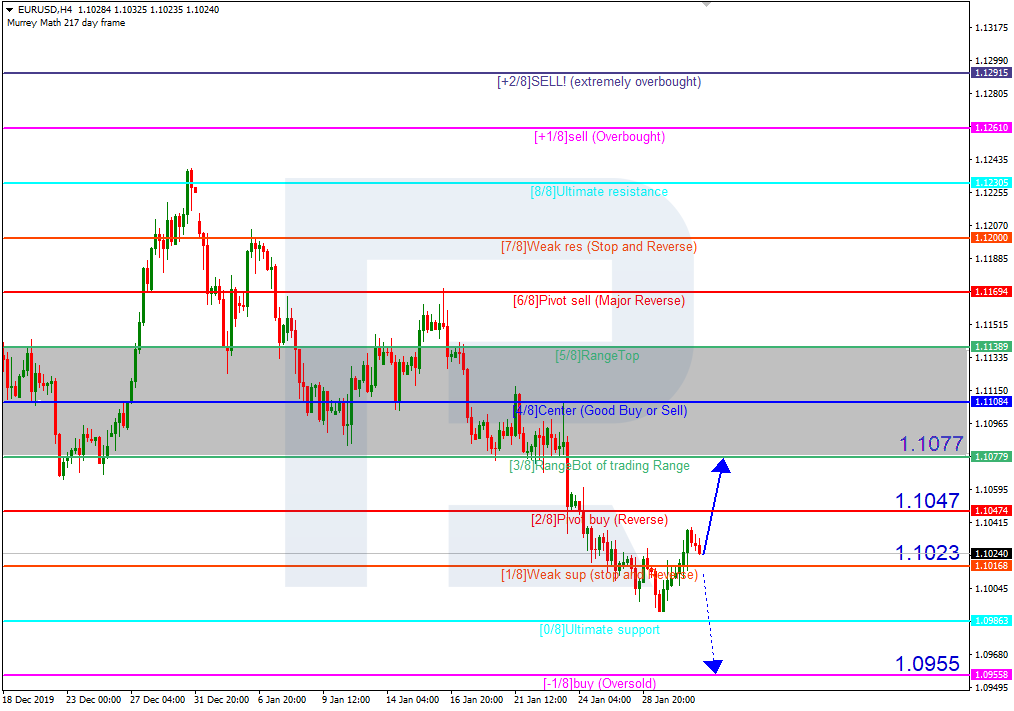
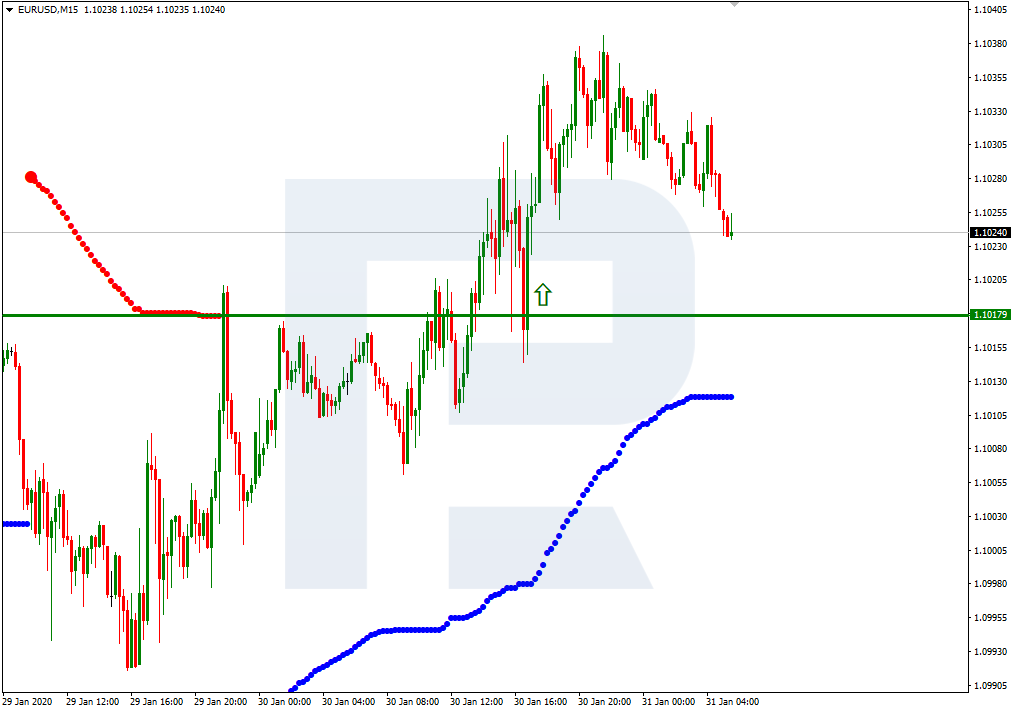
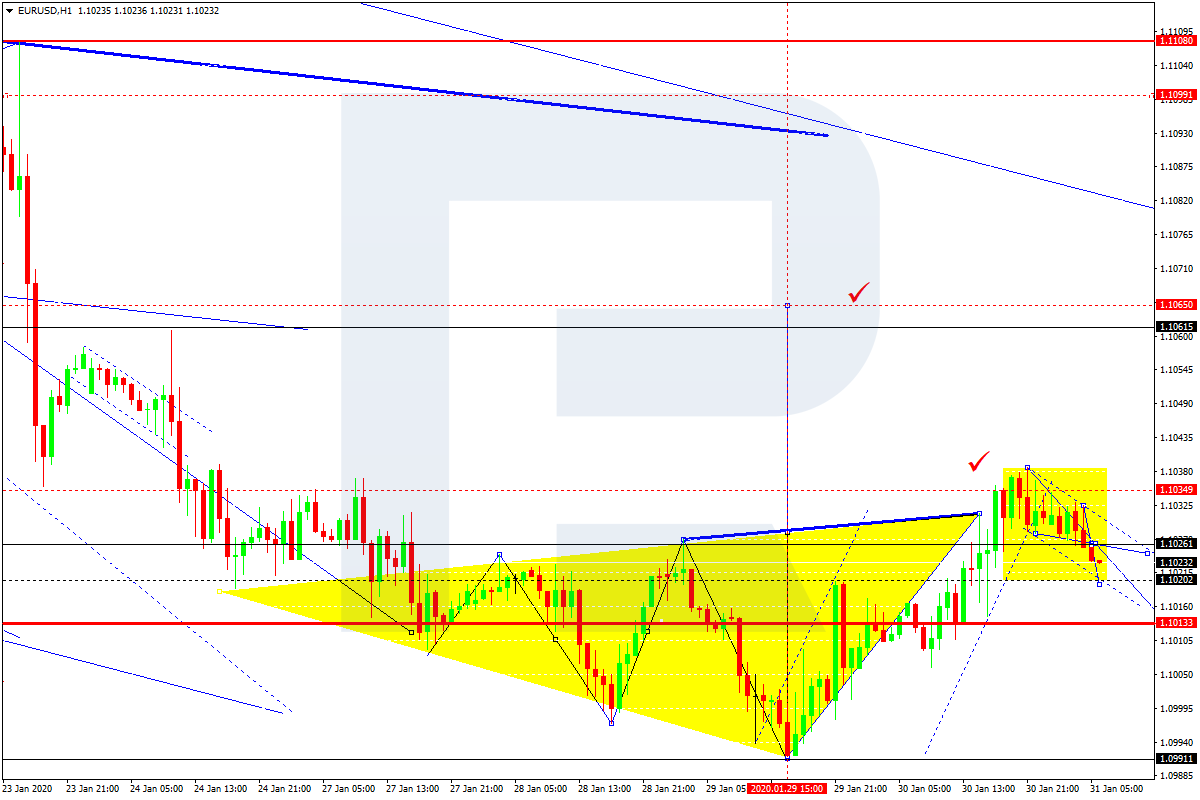
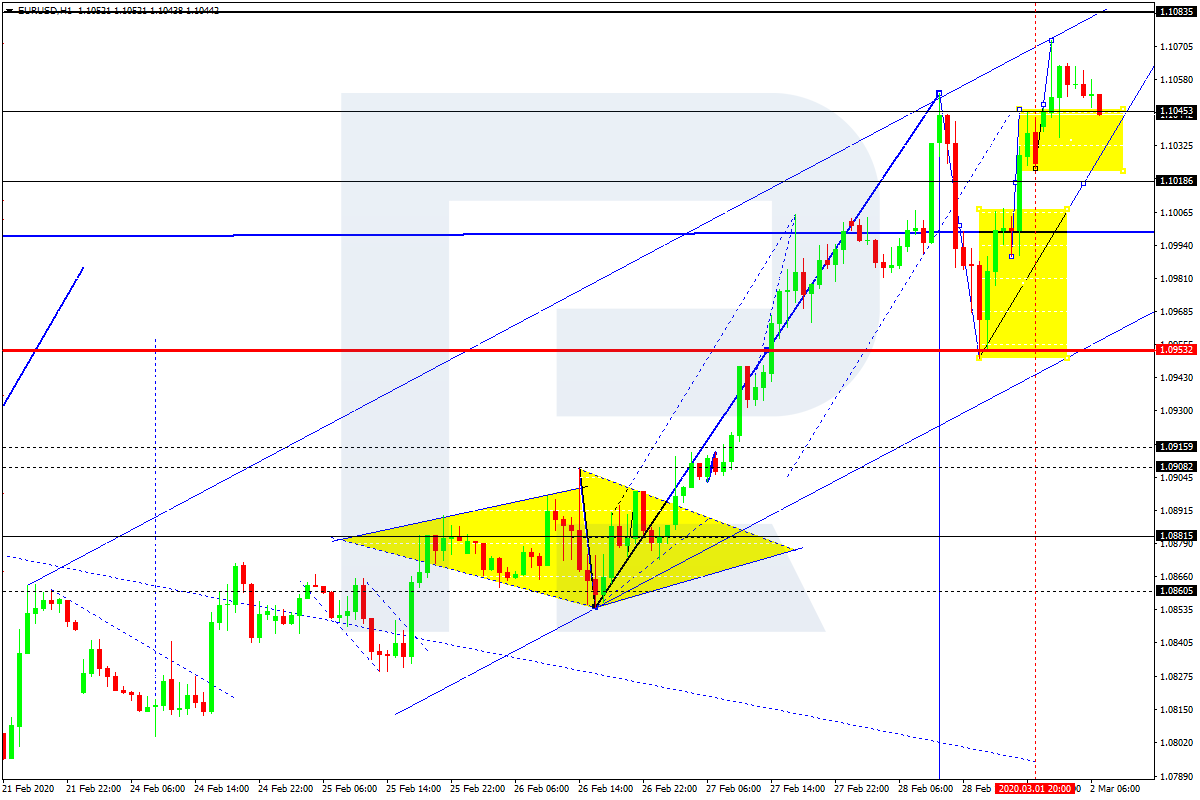
EURUSD, “Euro vs US Dollar”
EURUSD is consolidating at the top. Today, the pair may form a new descending impulse towards 1.1000 and then grow to update 1.1083. After that, the instrument may resume trading downwards with the target at 1.0950.

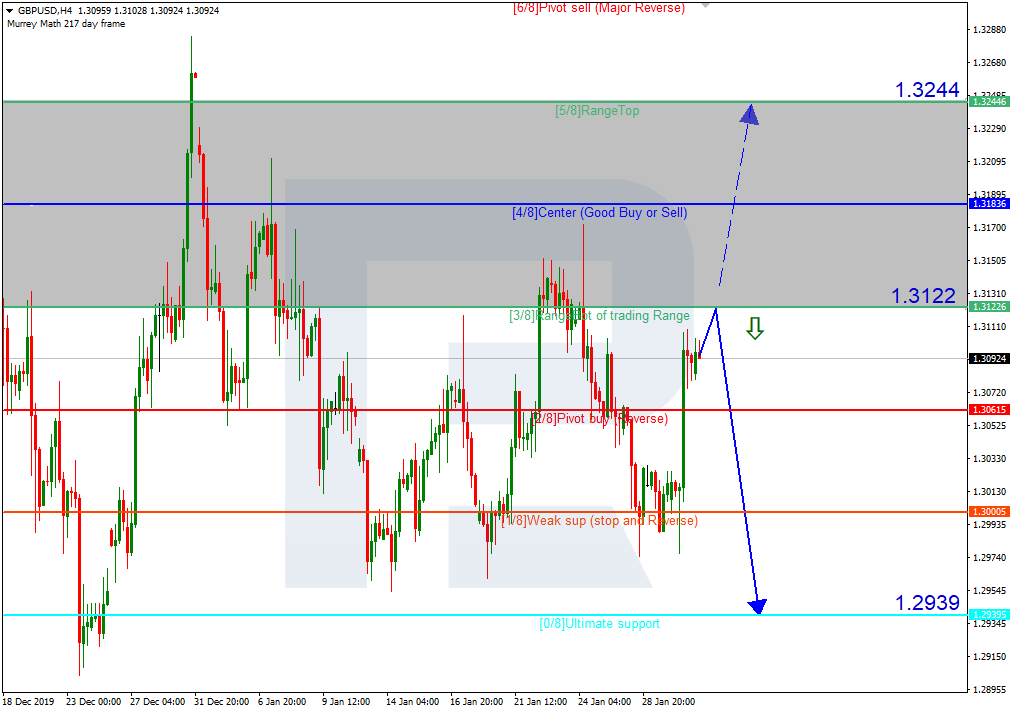
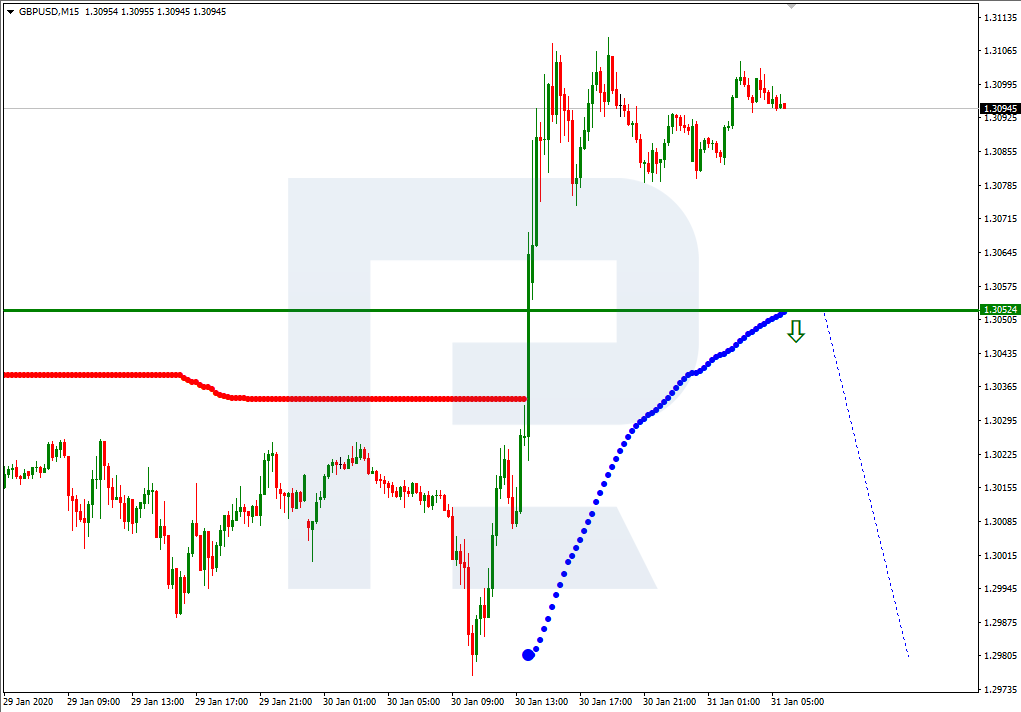
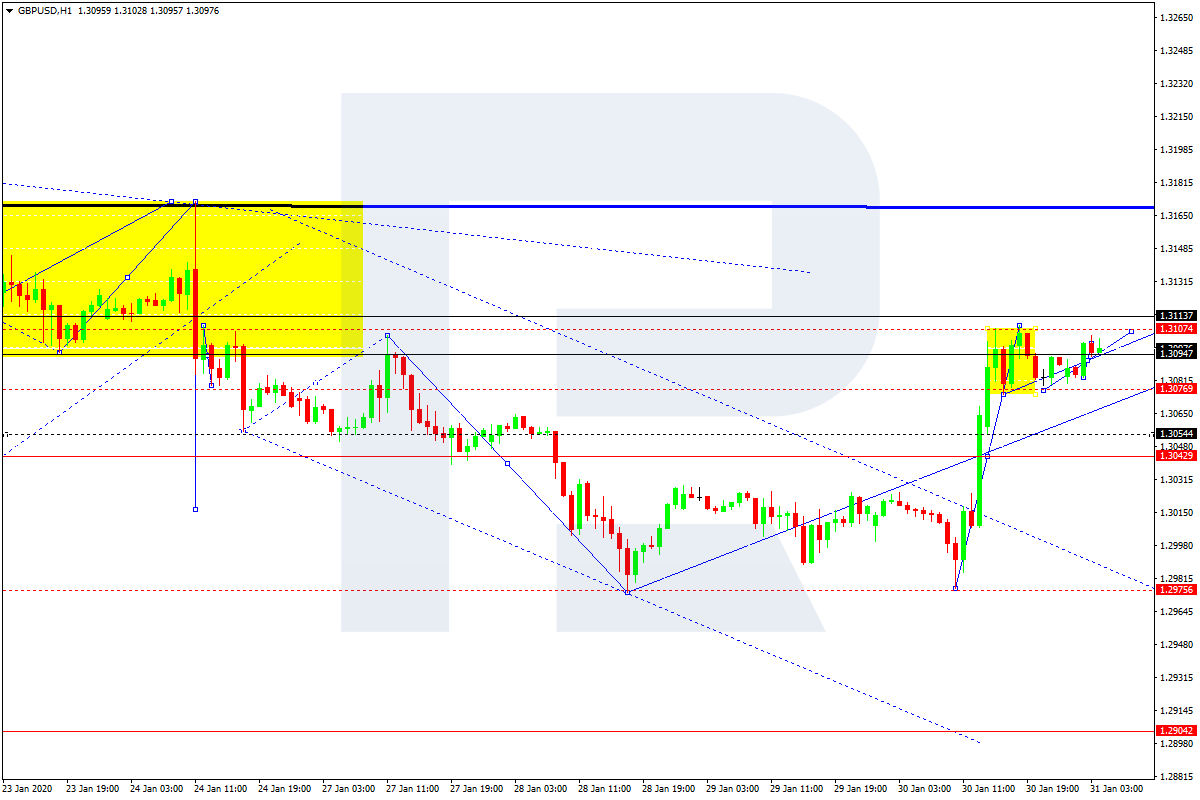
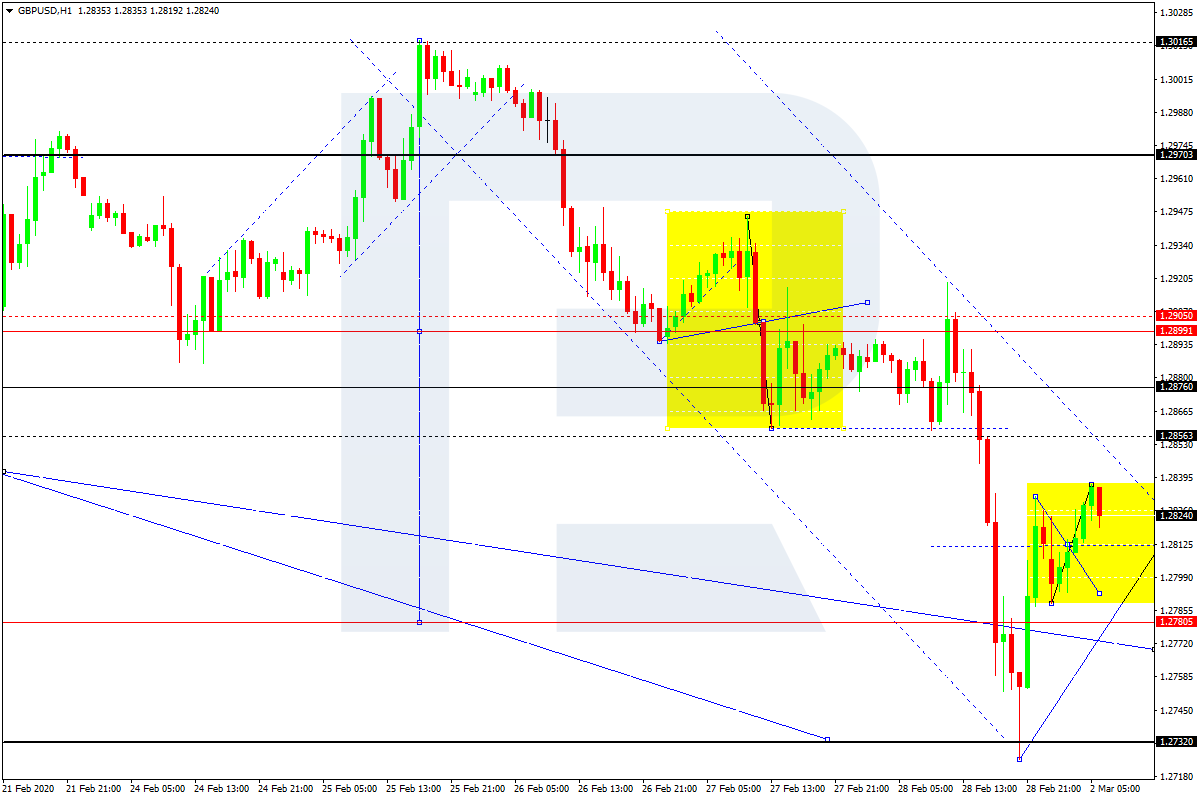
GBPUSD, “Great Britain Pound vs US Dollar”
After completing another descending wave towards 1.2773, GBPUSD has finished the ascending impulse at 1.2828; right now, it is forming a new consolidation range. If later the price breaks this range to the upside, the market may start another correction to reach 1.2856; if to the downside – resume trading inside the downtrend. The next target is at 1.2660.
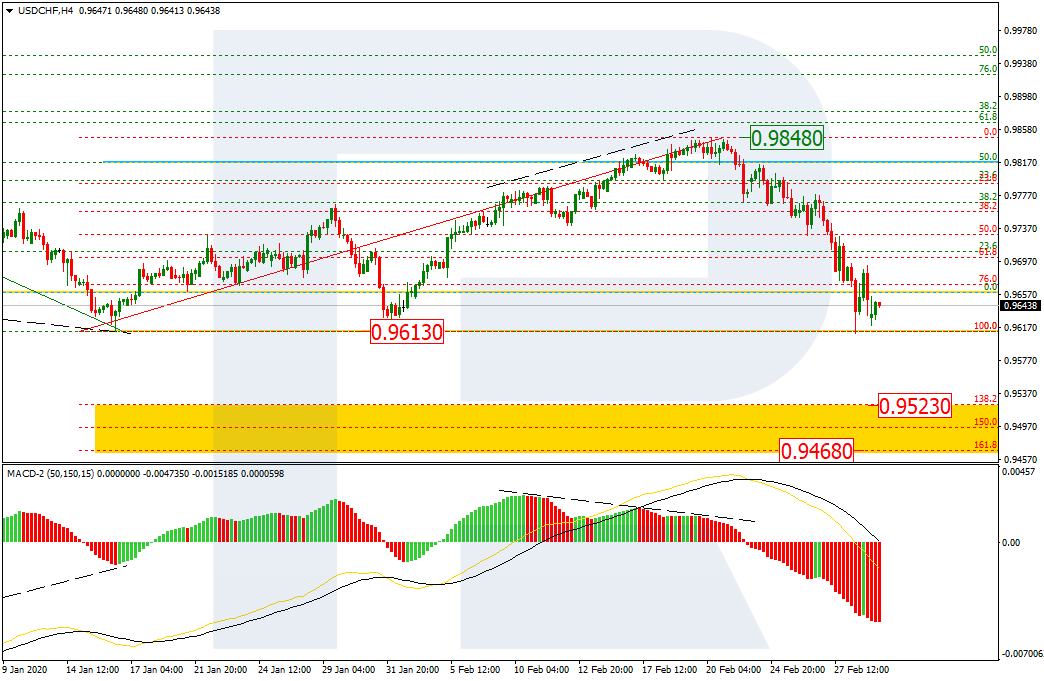
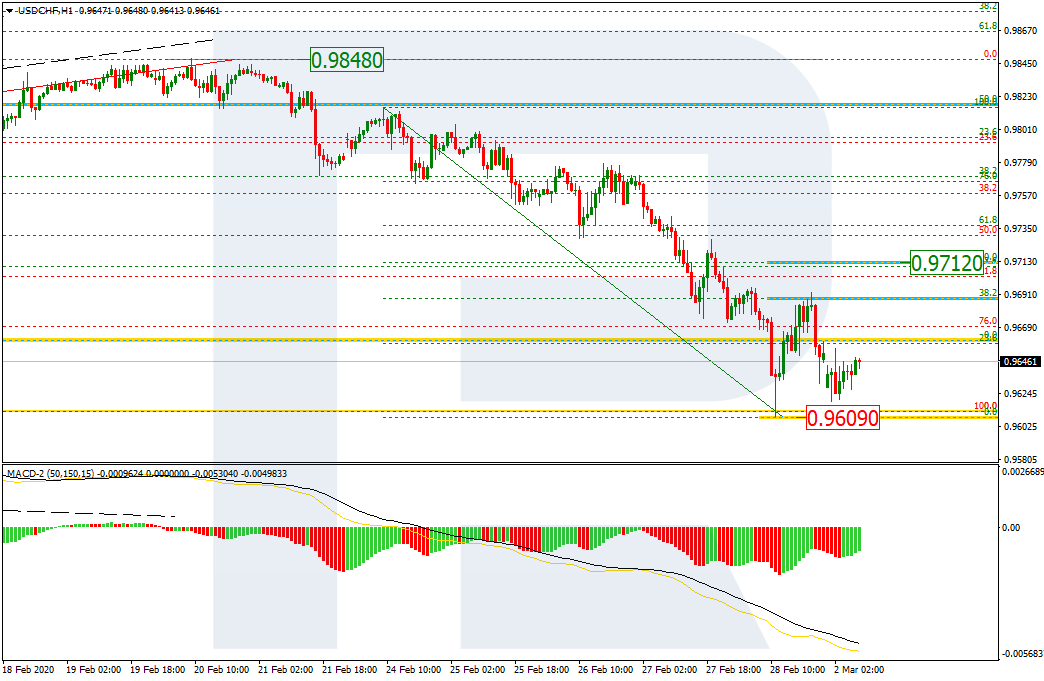
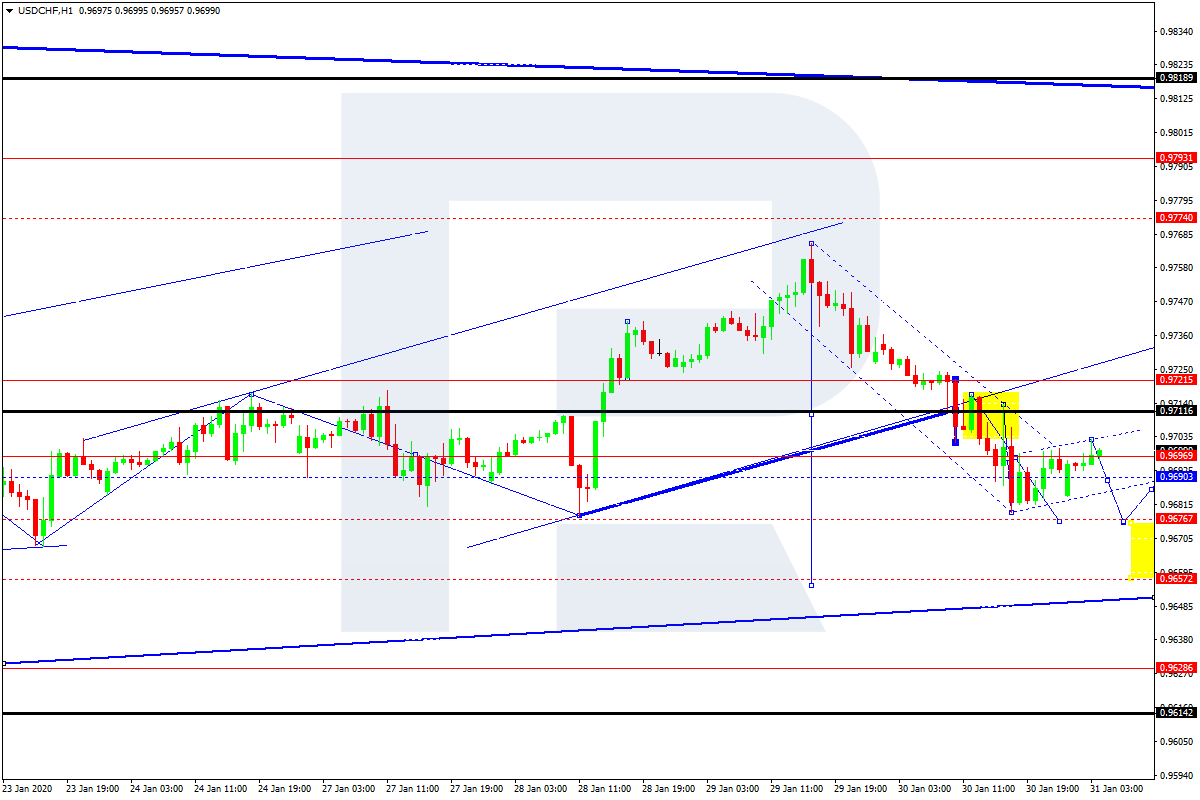
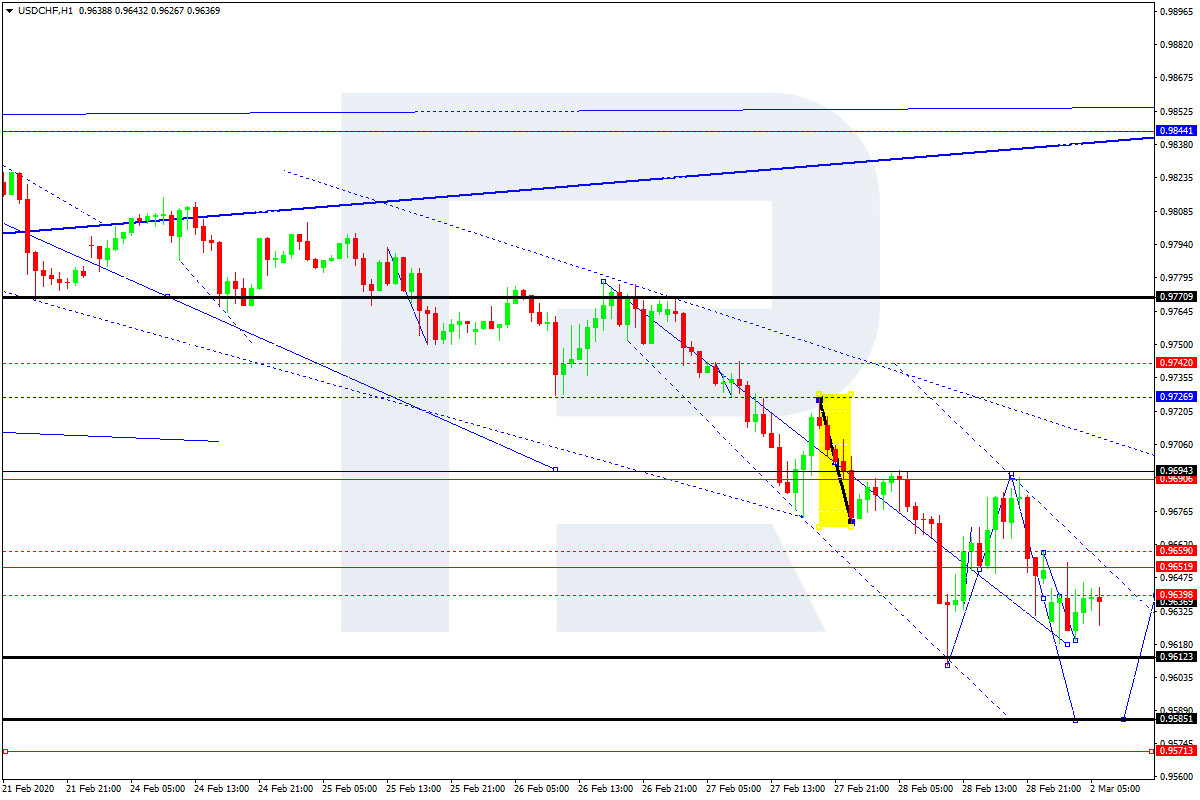
USDCHF, “US Dollar vs Swiss Franc”
USDCHF is still consolidating around 0.9640. Possibly, the pair may expand this range down to 0.9585 and then start another growth with the target at 0.9696.
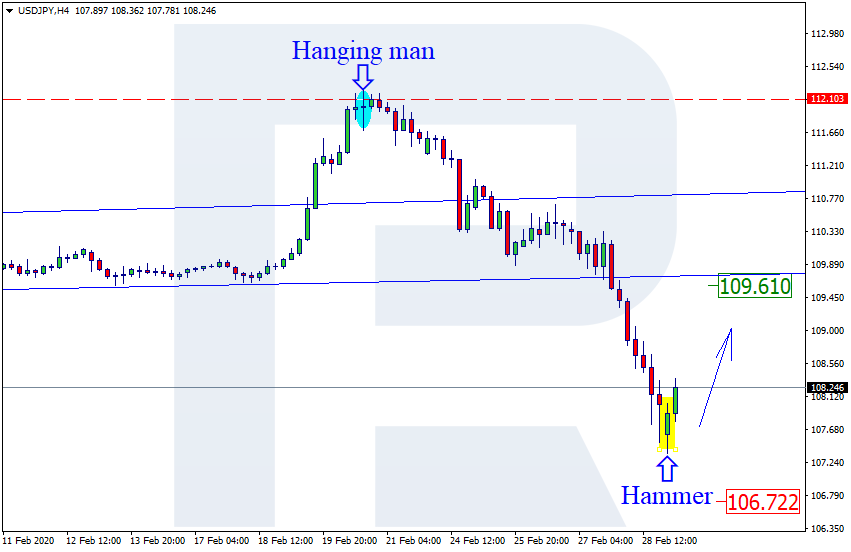
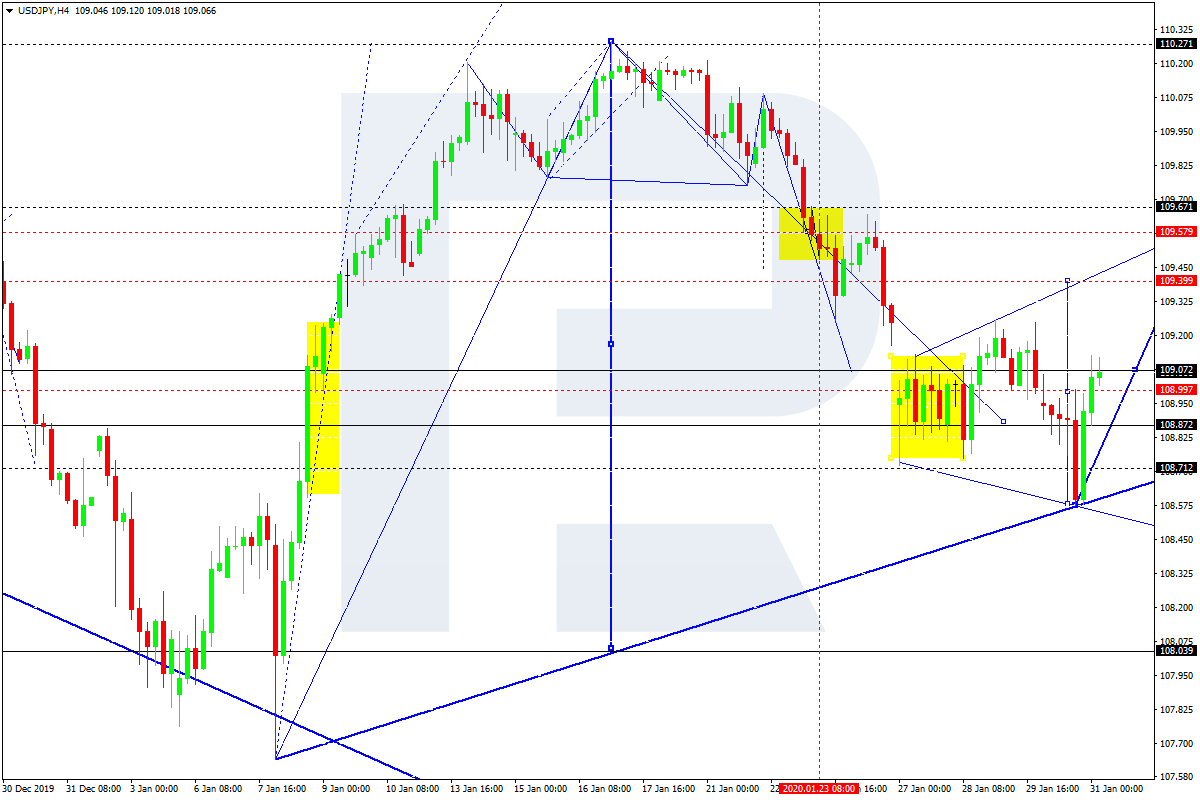
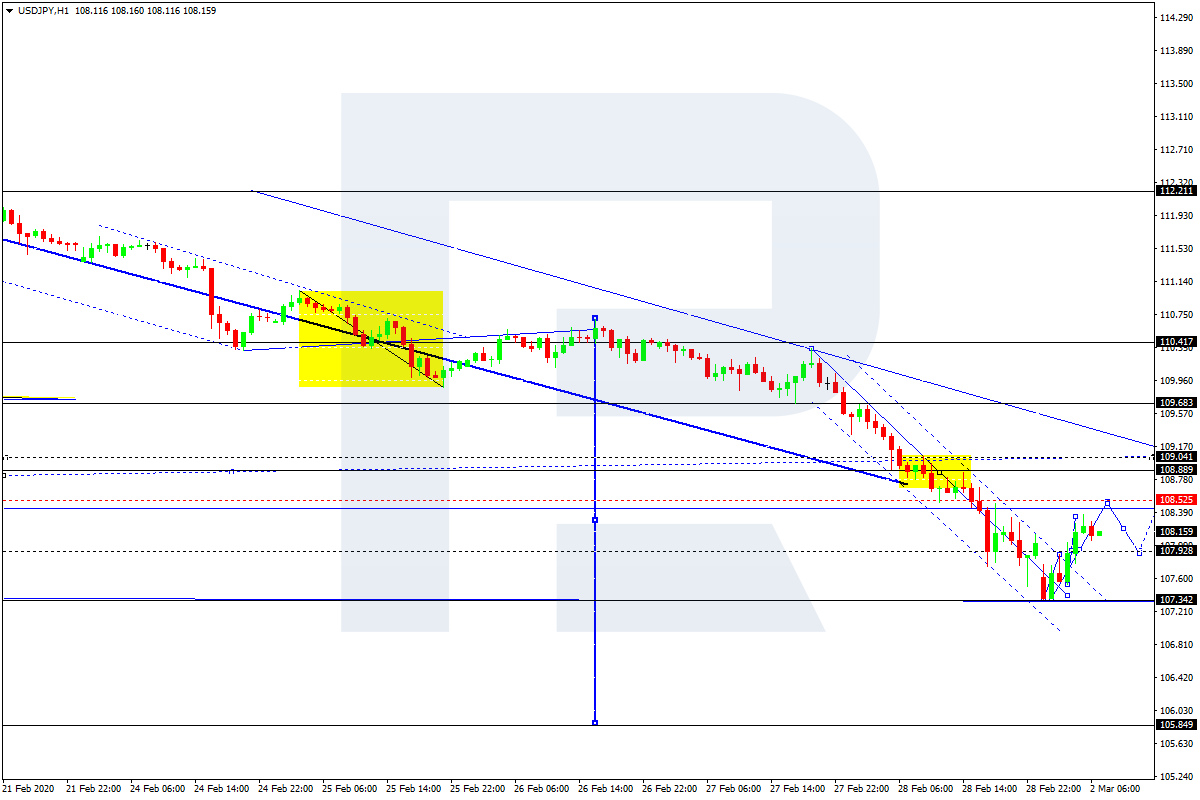
USDJPY, “US Dollar vs Japanese Yen”
USDJPY is growing towards 108.53. After that, the instrument may fall to reach 107.93, thus forming a new consolidation range between the above-mentioned levels. If later the price breaks this range to the upside, the market may start another correction to reach 110.47; if to the downside – resume trading inside the downtrend with the target at 105.85.
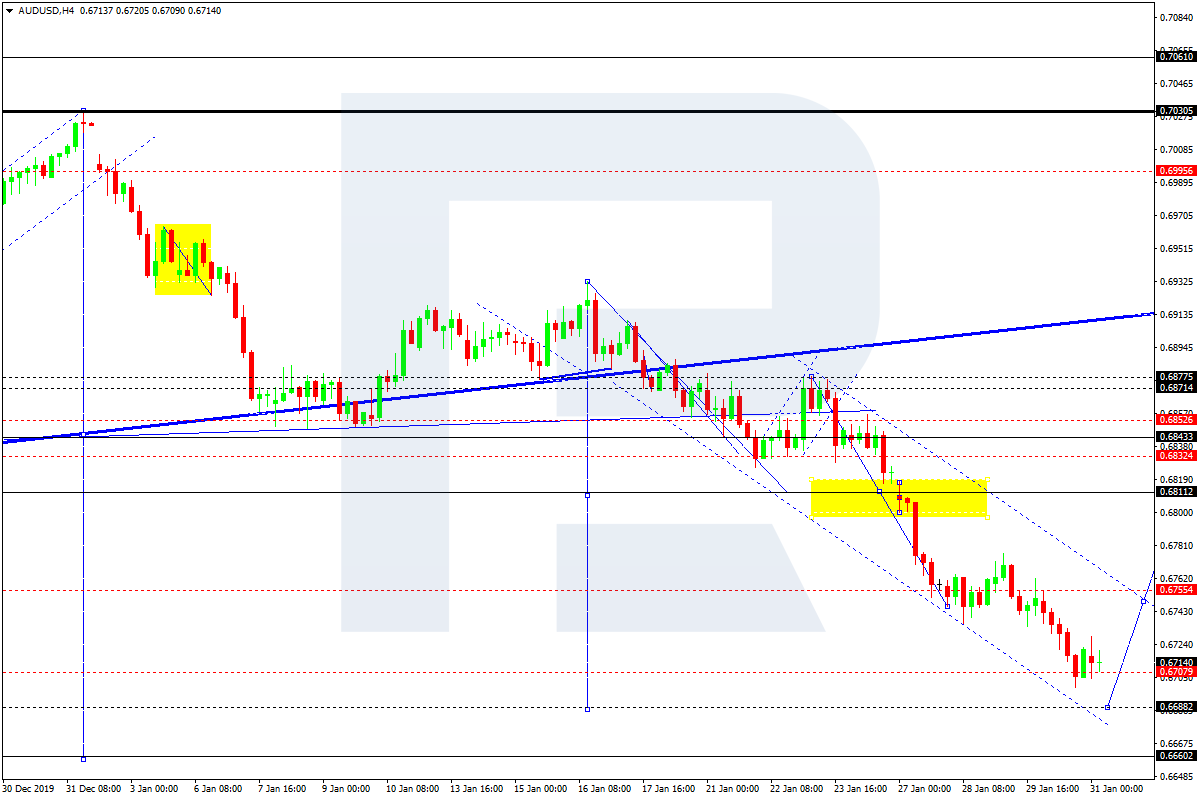
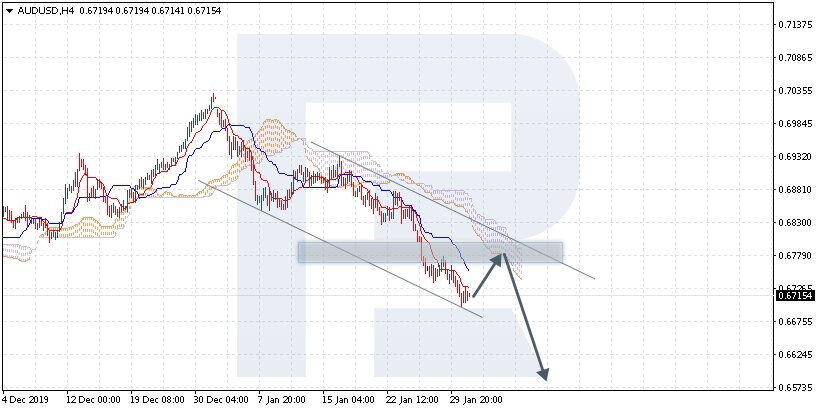
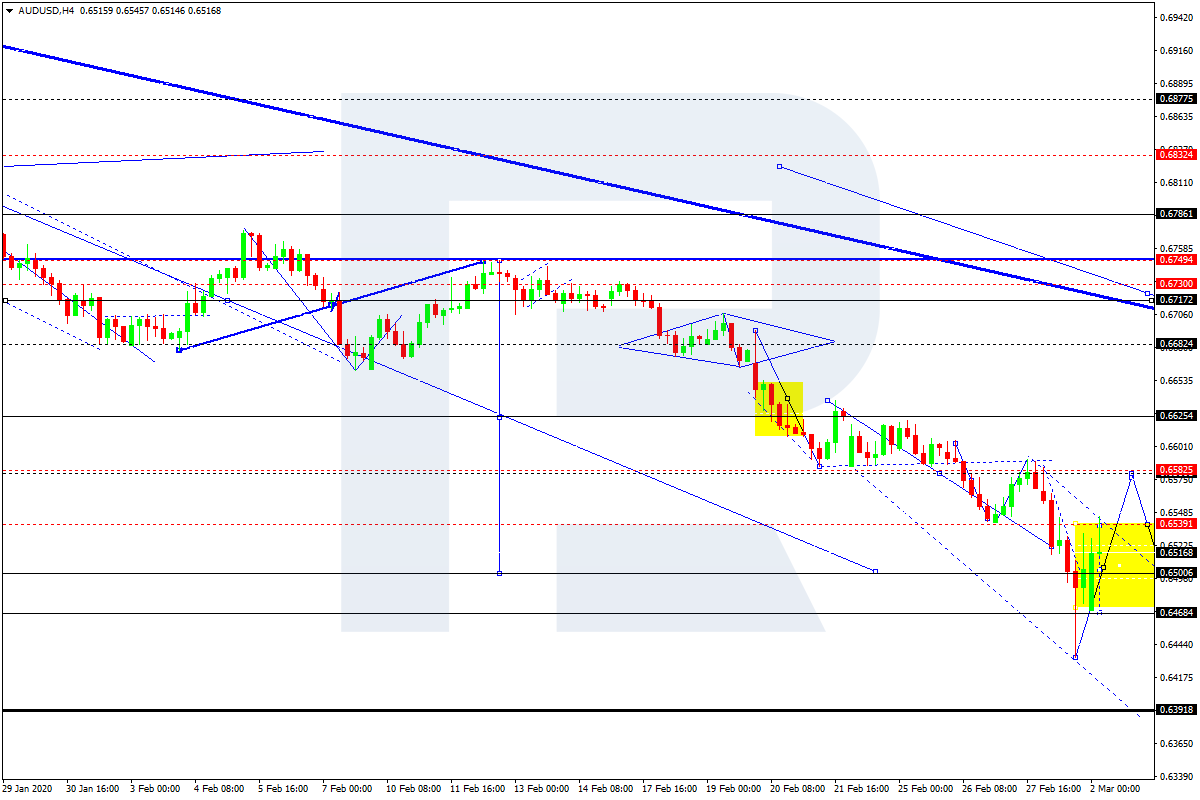
AUDUSD, “Australian Dollar vs US Dollar”
After reaching another downside target at 0.6433, AUDUSD is moving upwards. Possibly, today the pair may reach 0.6585 and then fall towards 0.6500, thus forming a new consolidation range between the above-mentioned levels. If later the price breaks this range to the upside, the market may start another growth to reach 0.6750; if to the downside – resume trading inside the downtrend with the target at 0.6390.
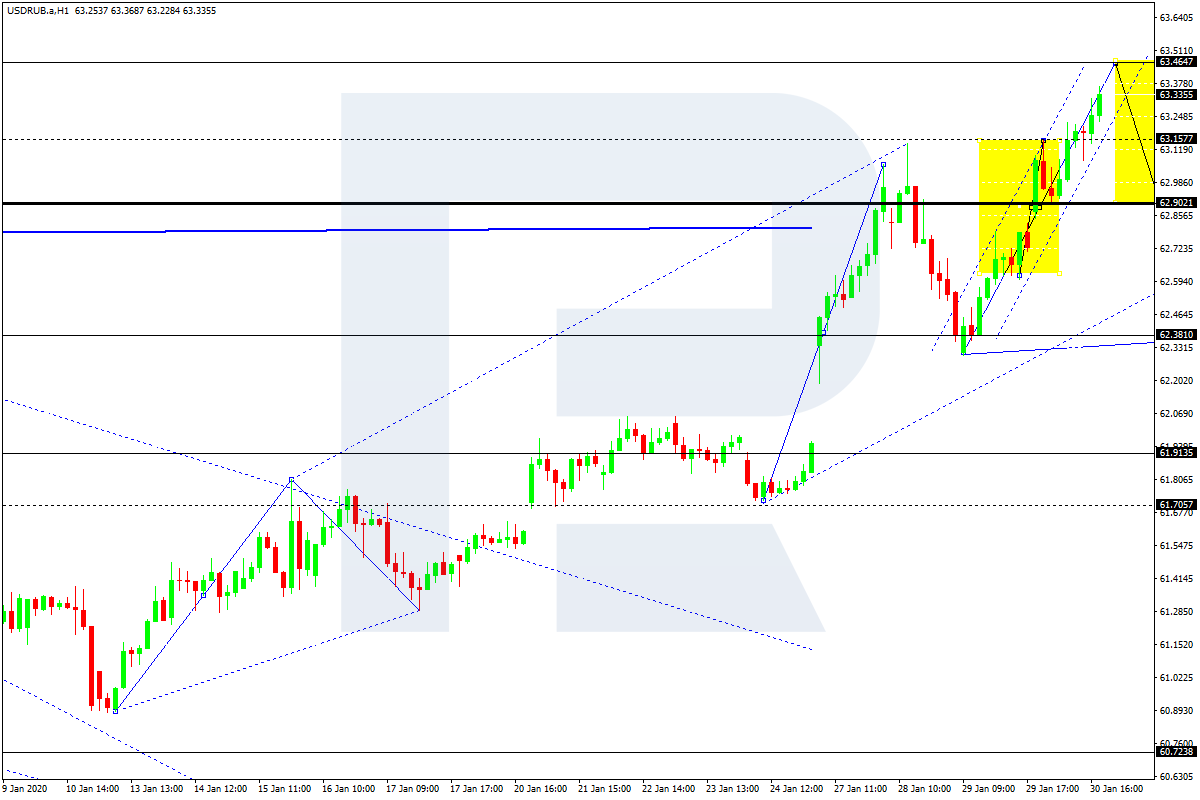
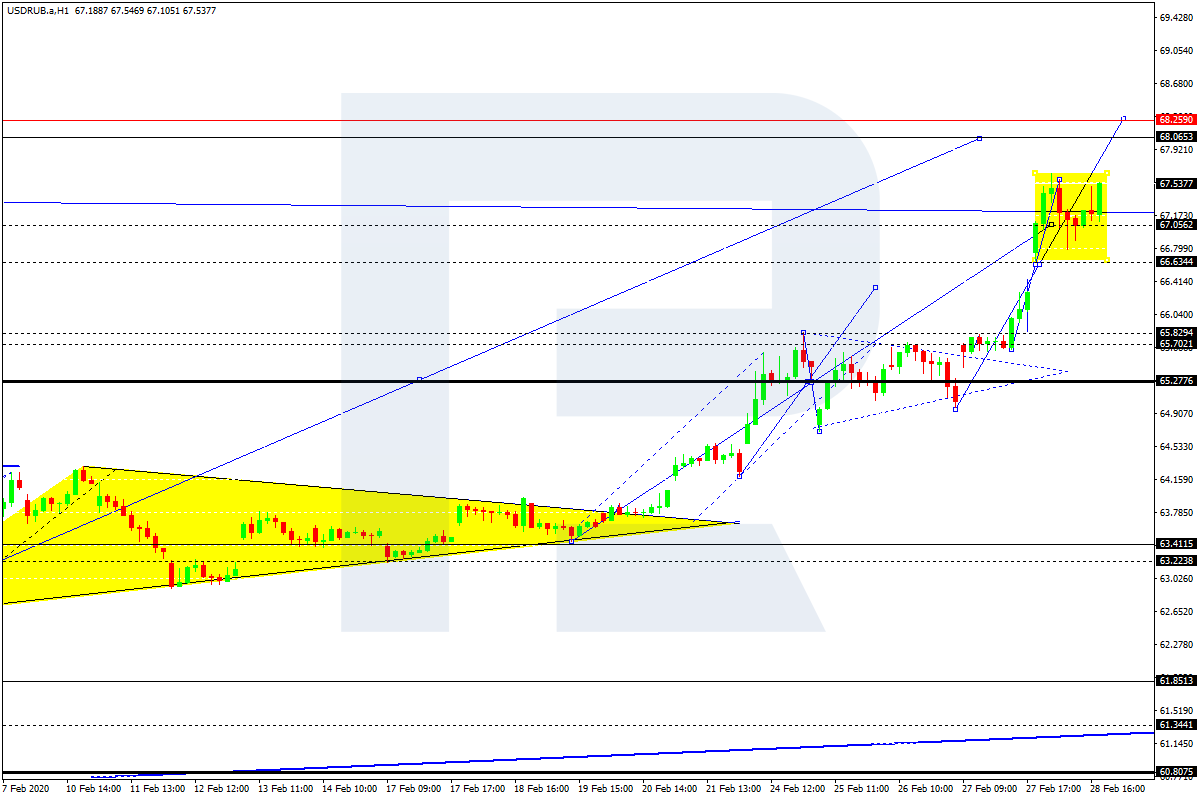
USDRUB, “US Dollar vs Russian Ruble”
After finishing the ascending wave at 67.07, USDRUB is forming a new consolidation range above it. According to the main scenario, the price is expected to fall to break 66.60 and then continue trading downwards with the first target at 65.25. Another scenario implies that the instrument may break 67.55 and extend the ascending wave up to 68.25.
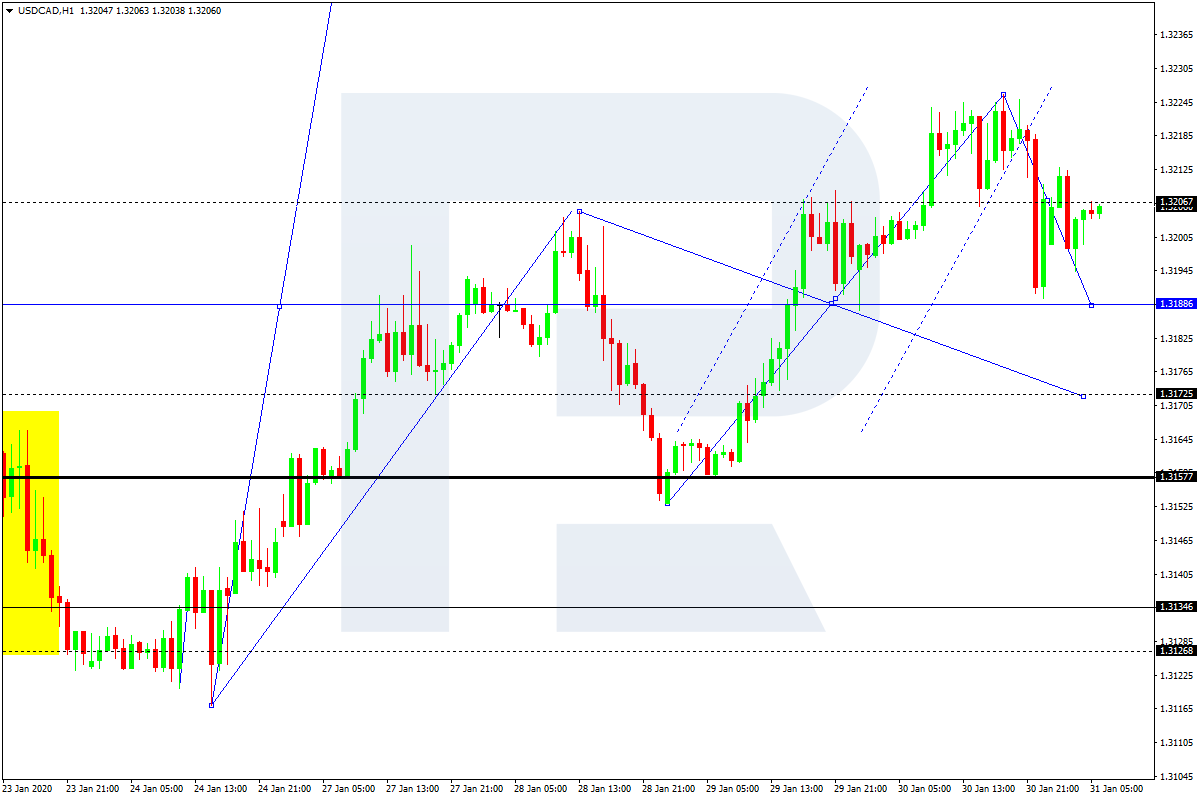
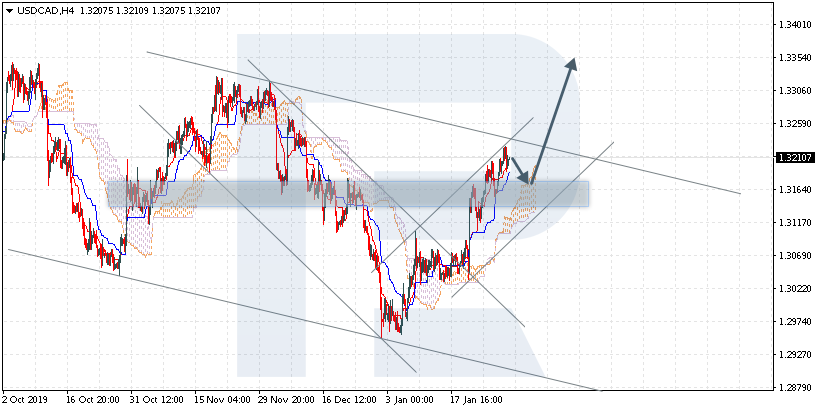
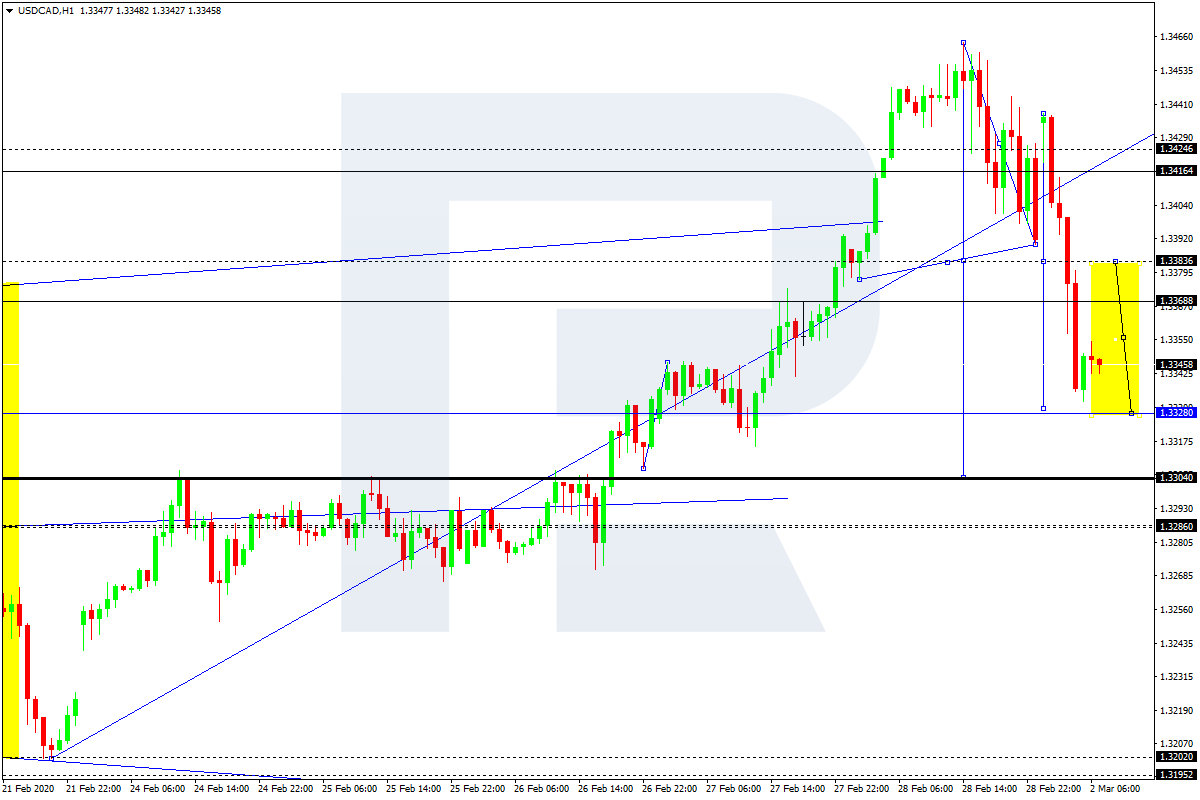
USDCAD, “US Dollar vs Canadian Dollar”
USDCAD is forming the first descending impulse. Today, the pair may reach 1.3328 and then form one more ascending structure towards 1.3383. Later, the market may resume trading downwards with the first target at 1.3303.
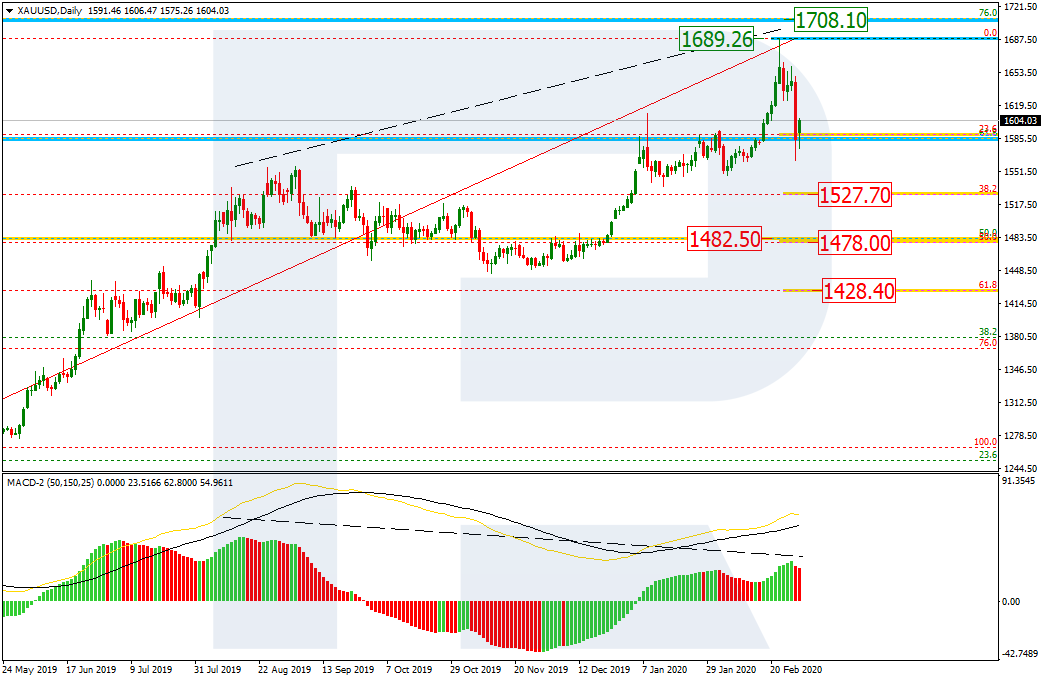
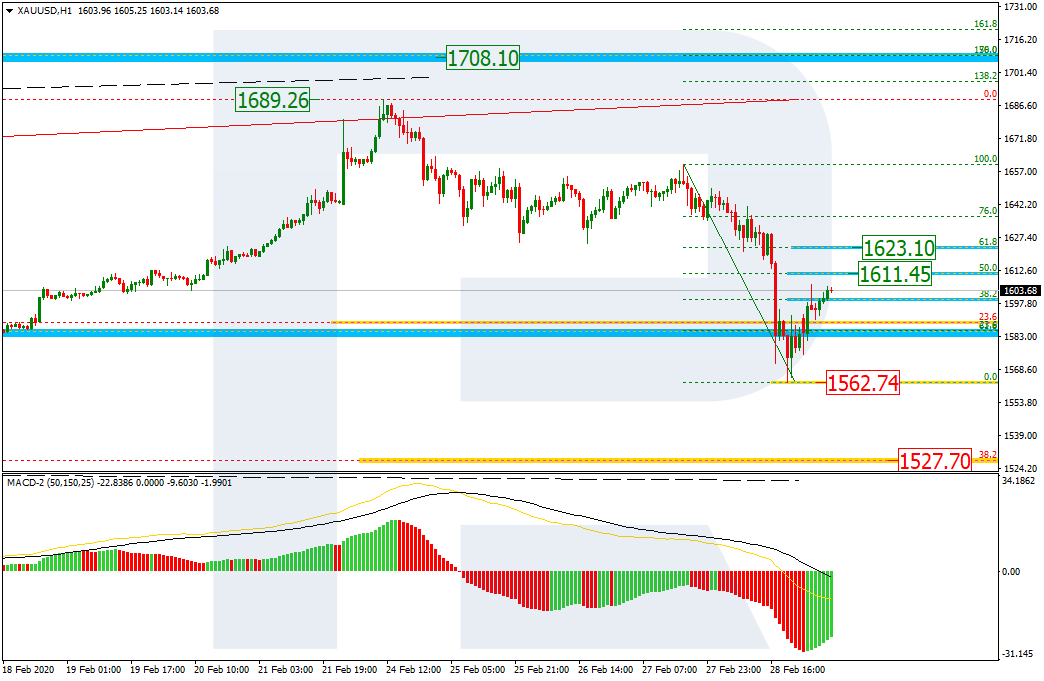
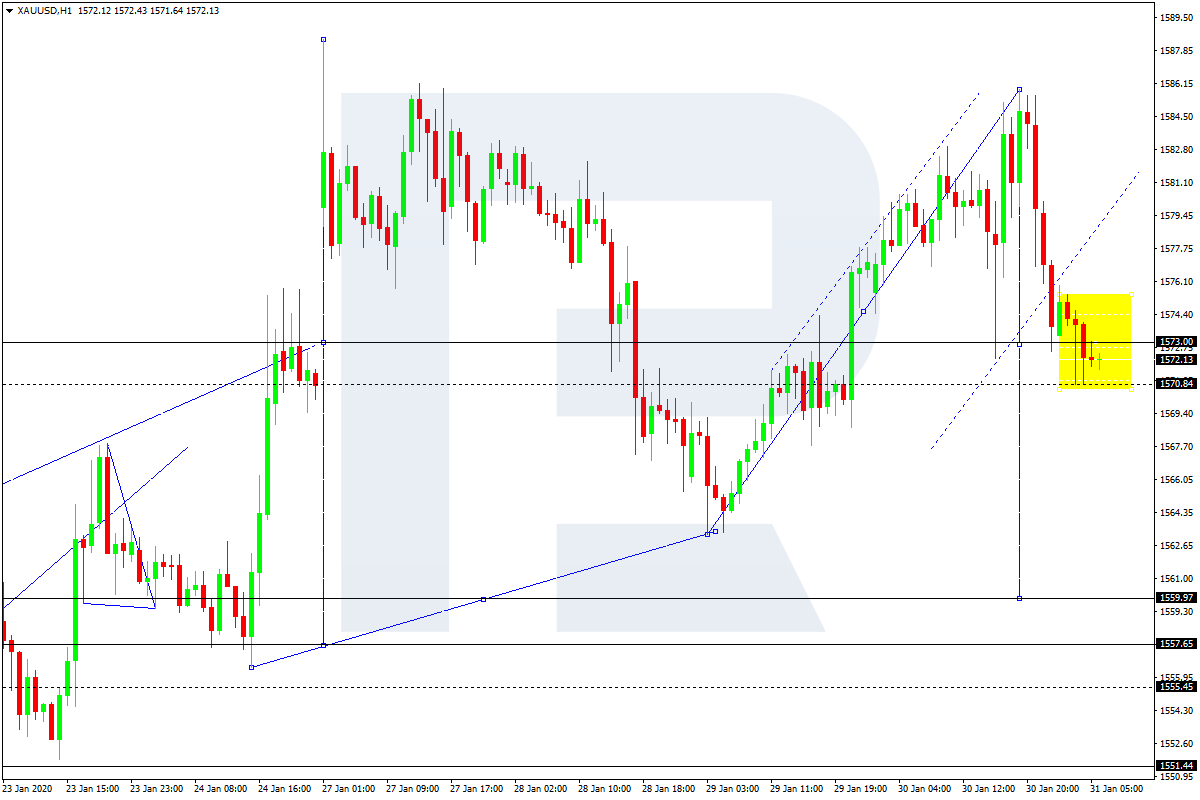
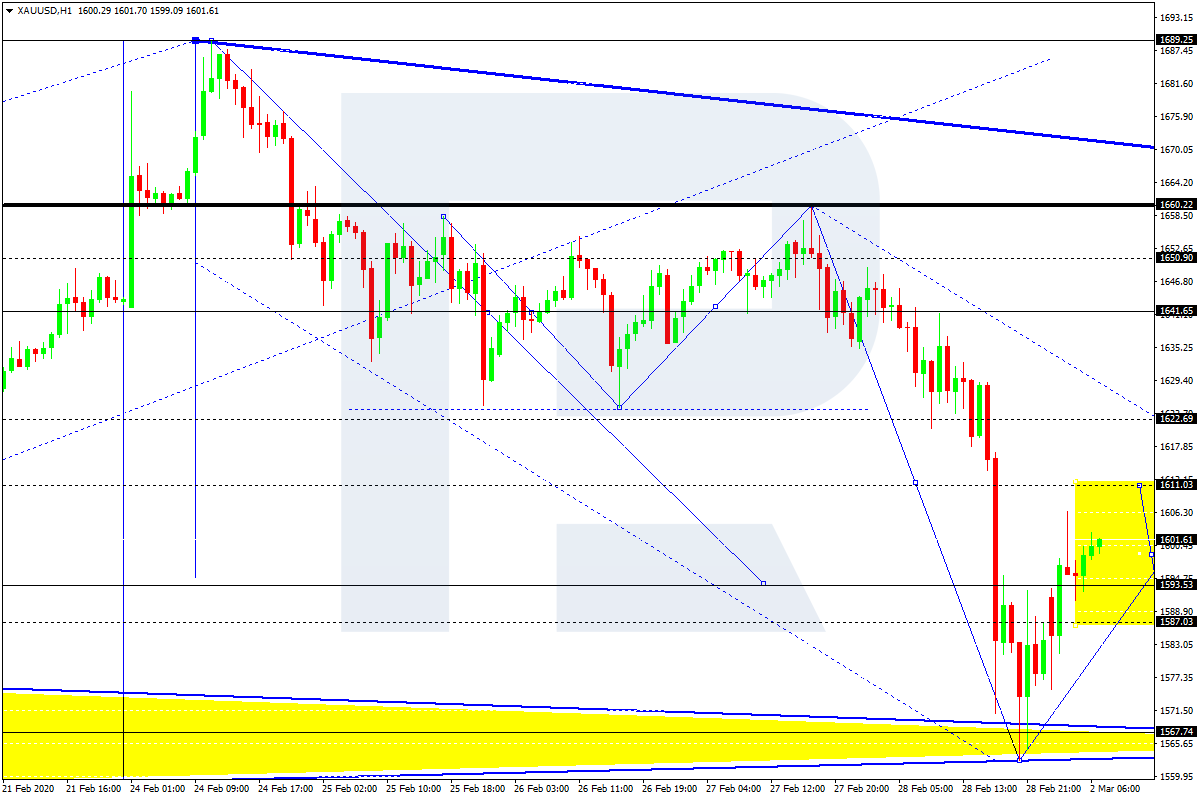
XAUUSD, “Gold vs US Dollar”
Gold has completed the first descending wave at 1567.77. Possibly, today the pair may correct towards 1641.65 and then form a new descending structure with the short-term target at 1484.44.
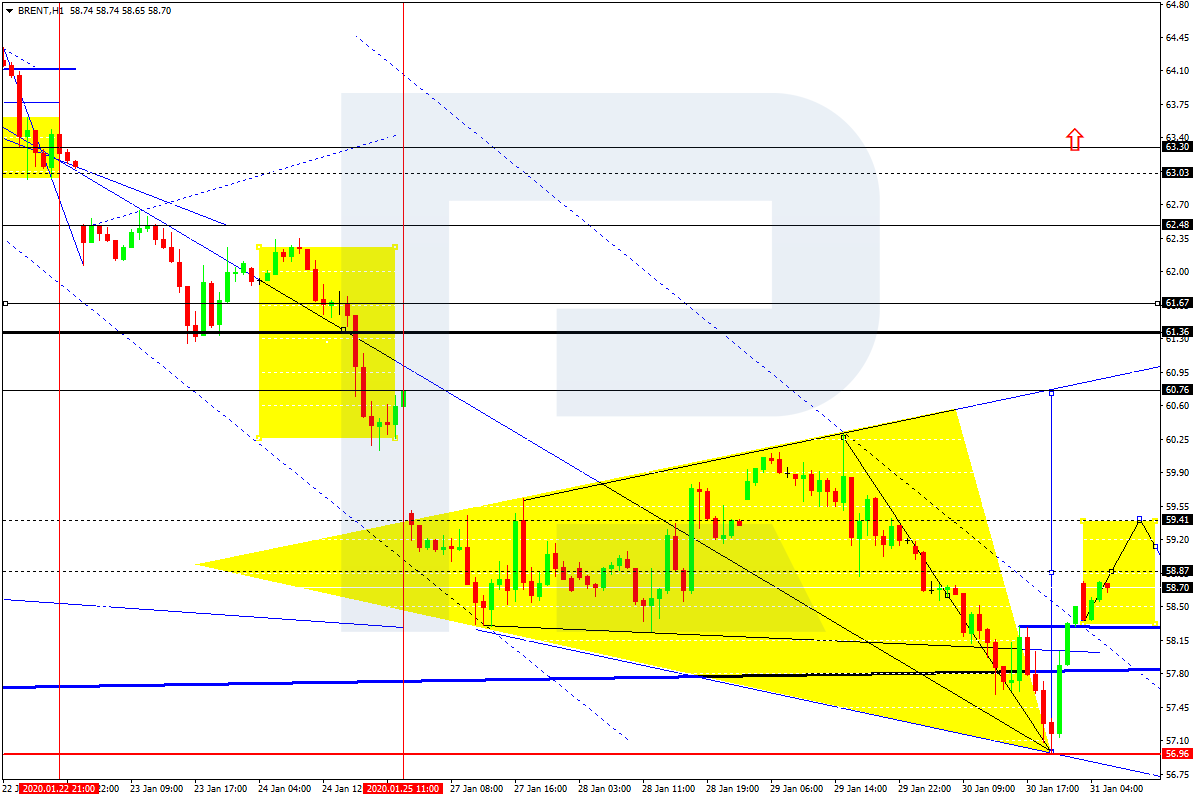
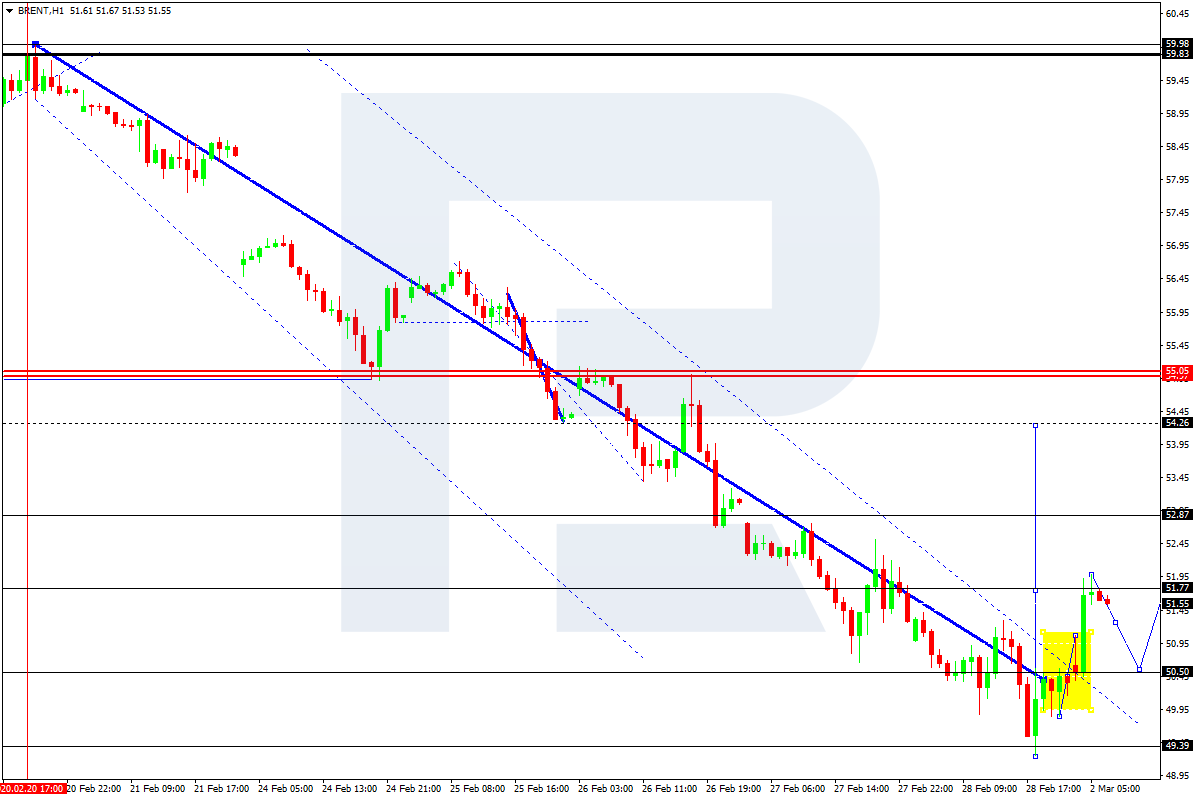
BRENT
Brent has finished the first ascending impulse at 51.77. Today, the pair may correct to reach 50.50 and then start another growth with the short-term target at 52.85.
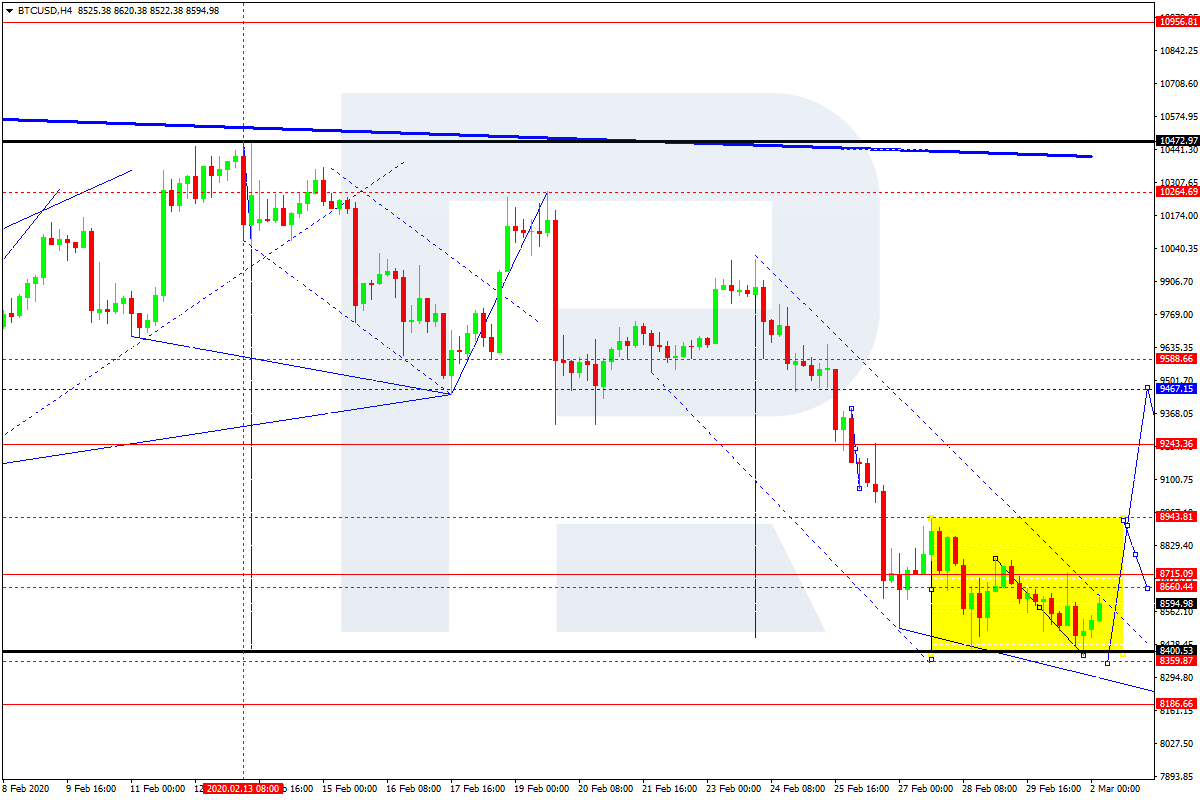
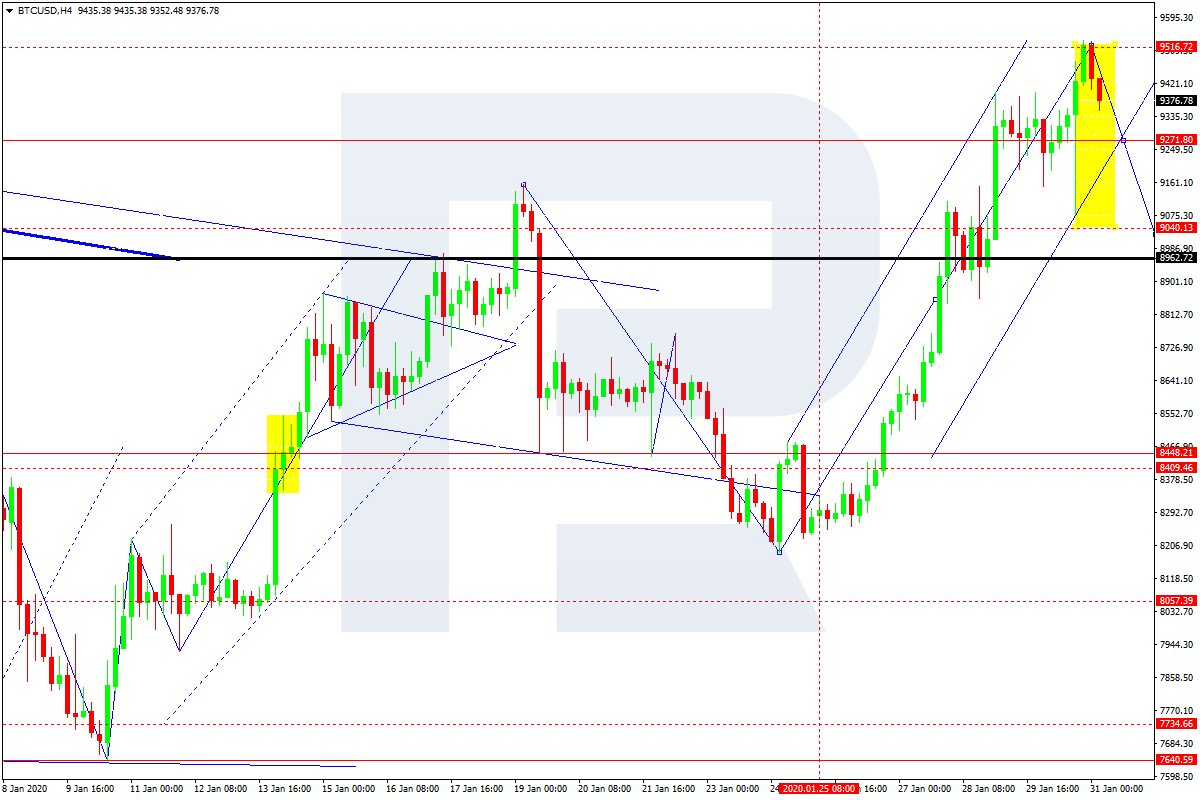
BTCUSD, “Bitcoin vs US Dollar”
BTCUSD has reached its downside target at 8400.00. Possibly, today the pair may consolidate near the lows. If later the price breaks 8800.00 to the upside, the market may form one more ascending structure with the first at 9500.00.