Murrey Math Lines 20.01.2020 (EURUSD, GBPUSD)
EURUSD, “Euro vs. US Dollar”
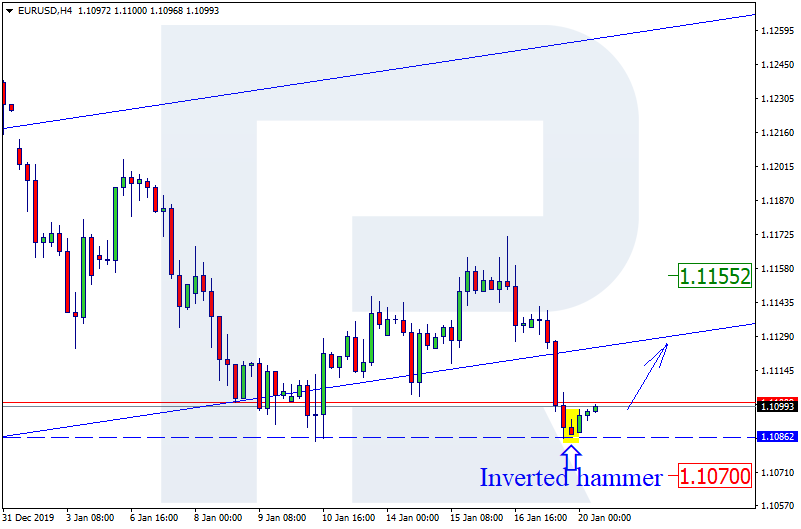
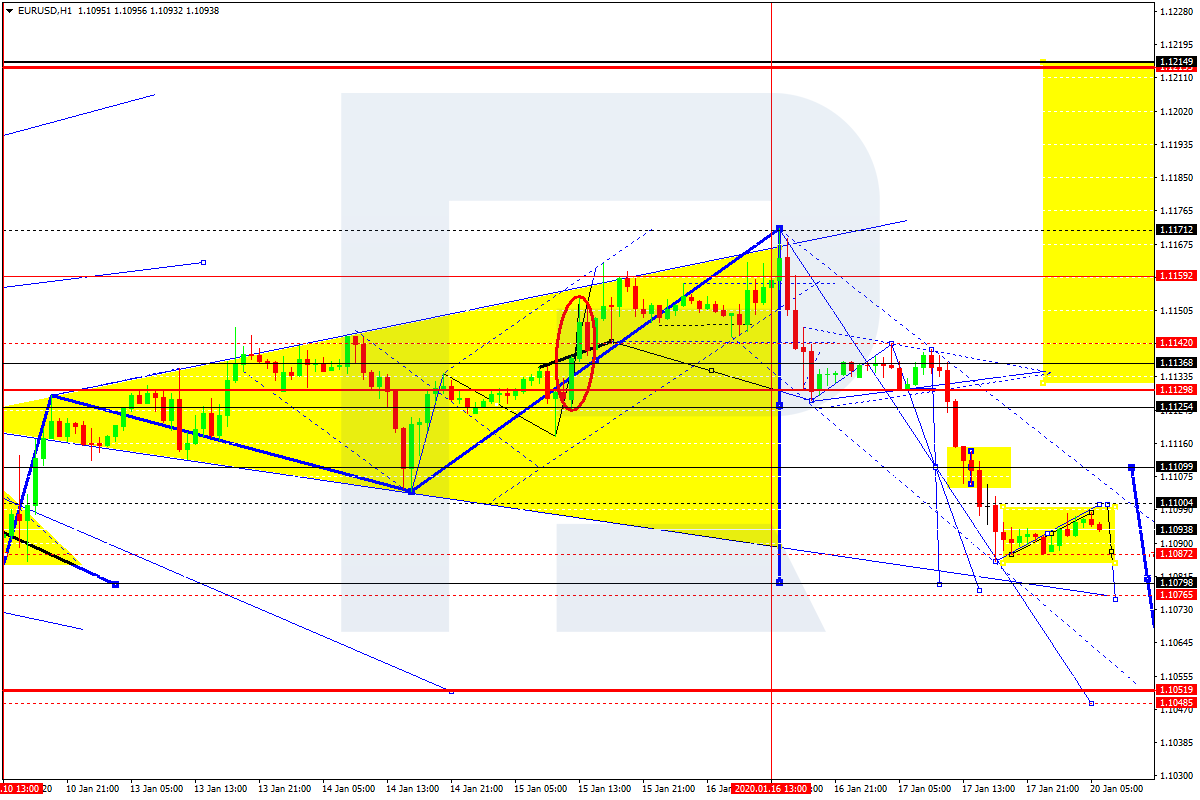
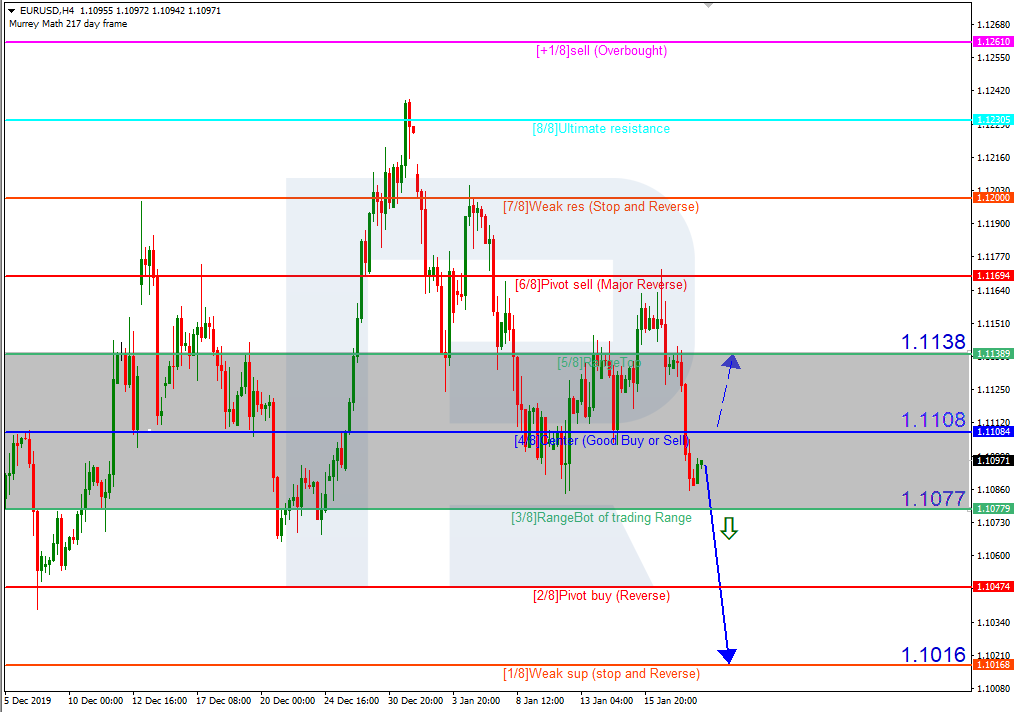
In the H4 chart, EURUSD is still consolidating. In this case, the price is expected to break 3/8 and then continue trading downwards to reach the support at 1/8. However, this scenario may no longer be valid if the price breaks 4/8 to the upside After that, the instrument may continue growing towards the resistance at 5/8.

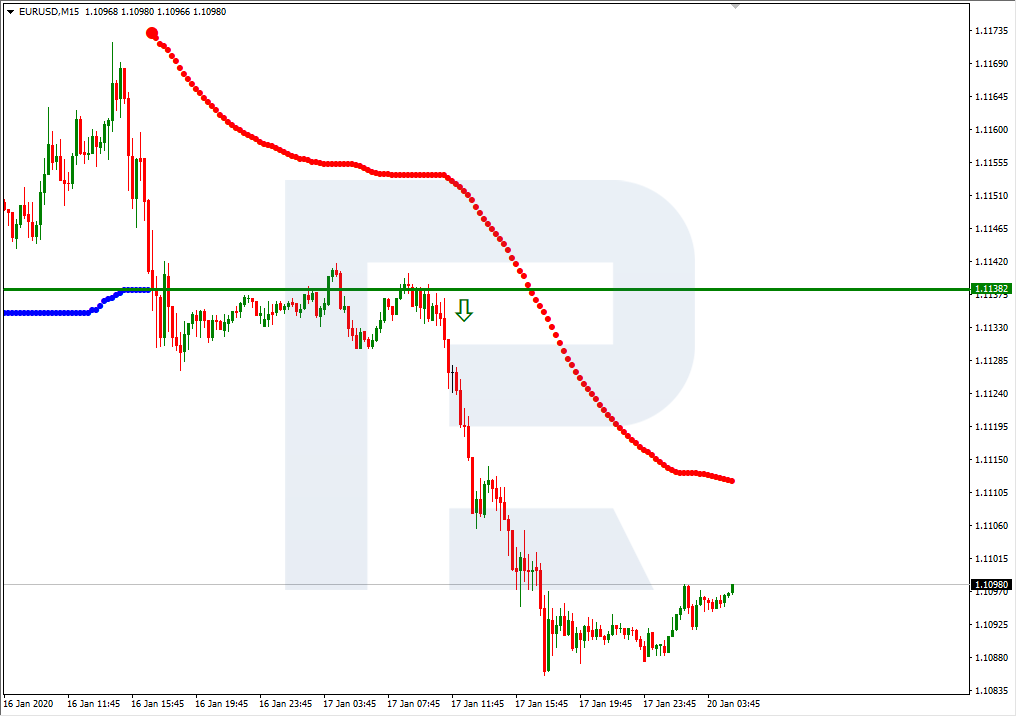
As we can see in the M15 chart, the pair has broken the downside line of the VoltyChannel indicator and, as a result, continue moving downwards to reach 1/8 from the H4 chart.
GBPUSD, “Great Britain Pound vs US Dollar”
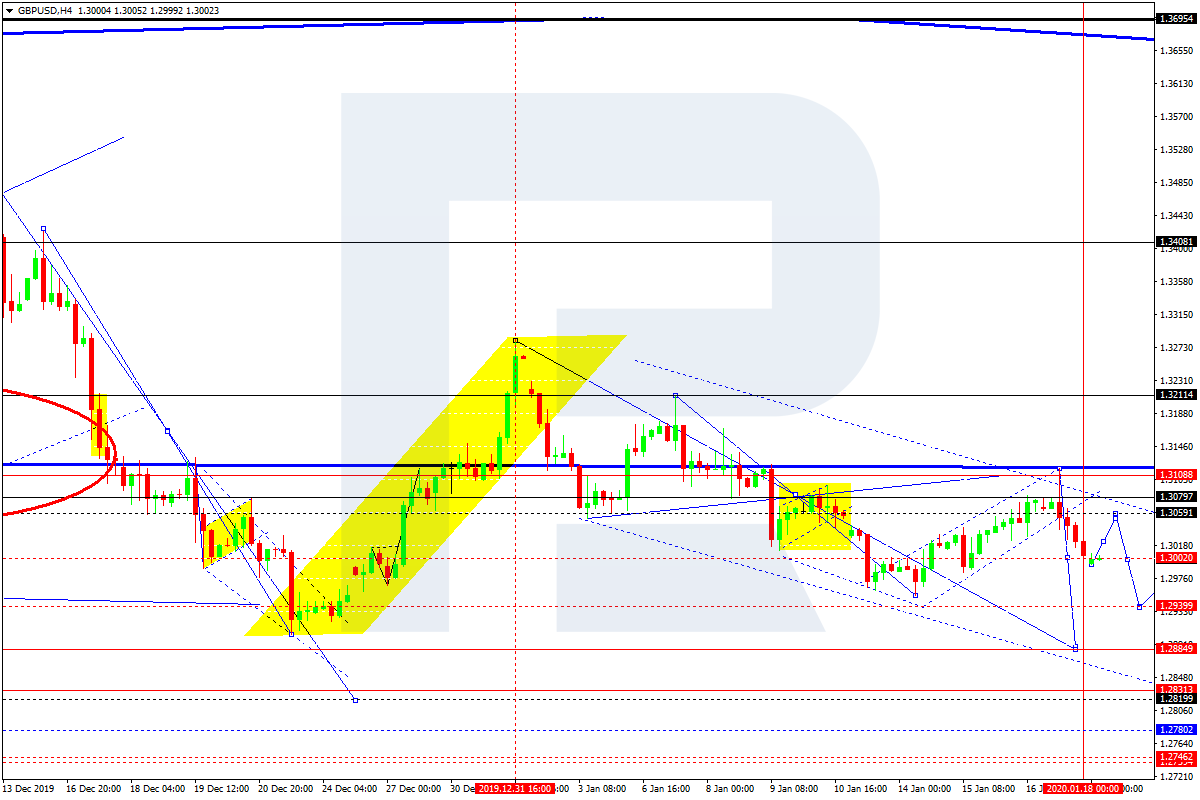
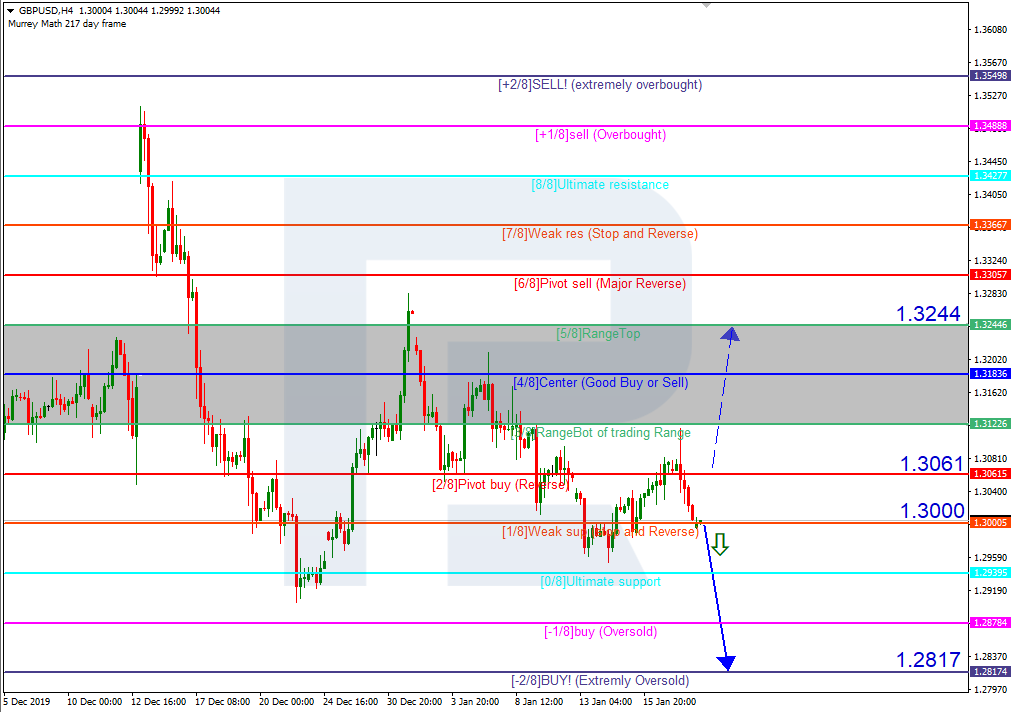
In the H4 chart, GBPUSD is moving below 3/8. In this case, the price is expected to break 1/8 and then continue falling towards the support at -2/8. However, this scenario may no longer be valid if the price breaks the resistance at 2/8 to the upside. After that, the instrument is expected to continue growing to reach the 5/8.
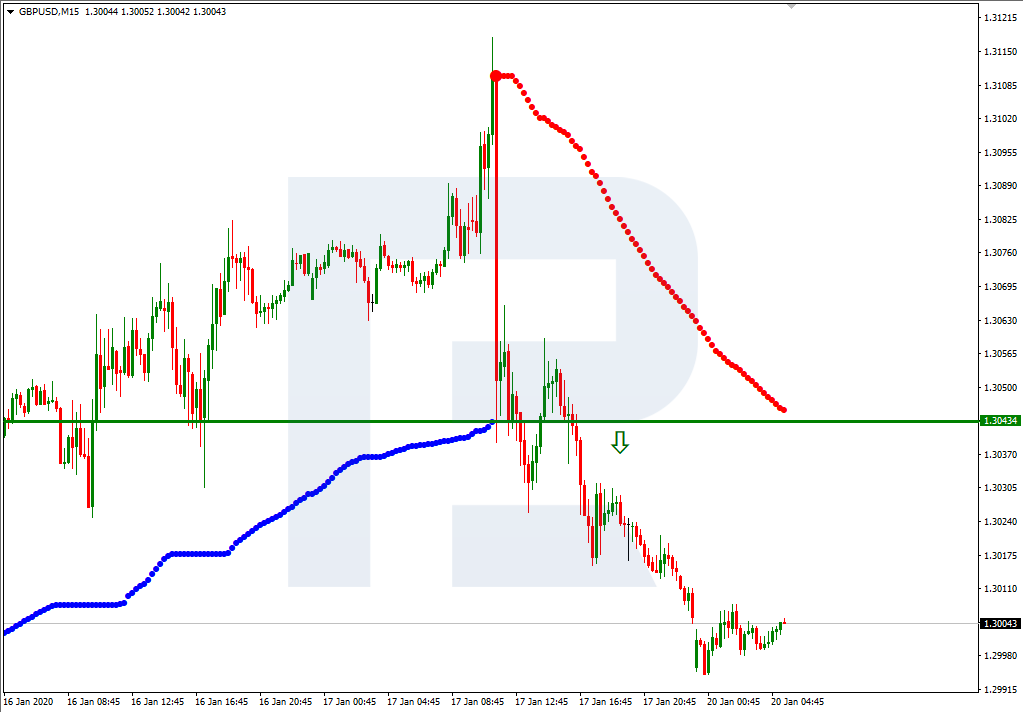
As we can see in the M15 chart, the pair has broken the downside line of the VoltyChannel indicator and, as a result, may continue trading downwards to reach -2/8 from the H4 chart.