rfxsignals February 2, 2021 No Comments

Forex Morning Trade

Forex Morning Trade

by Mark Fric
My Forex Morning Trade System has proven to be a very successful system for me, and I am confident that after you finish reading this manual and practice trading it for few days, you too will be ready to start making real money successfully in the Forex market.

Before taking you through the system step by step, I will give you a short overview of the Forex Morning Trade System.
The system is relatively simple to learn and to use; it is throughoutly tested and gives very good and stabile results. In fact, I had almost no loosing month for the last 20 months.
It is ideal for busy people, because trading the system won’t take you more than 5 or 10 minutes a day. Really, this time is enough to check for the trading signals and set up the trade.
Your trading day will look as follows:
 At 5:30am (GMT time) you look at the charting platform and decide if you’ll open the trade (more on the rules later)
 If the conditions are met, you’ll simply place a trade and walk away. That’s all. You don’t need to sit in front of the screen, monitoring your positions. The trade will either hit profit target or stop loss automatically.
The only “drawback” of the system is that you have to get up at 5:30 GMT time, but we always have to sacrifice something to be successful in life, right? 

In the next sections I will show you how to install and set up the system, how to use it to enter and exit the trades, how much capital you need for trading, how to manage your risk and so on. 

Free Download Forex Morning Trade.rar :
FxMorningTrade.ex4
fx_morning_trade.tpl
ForexMorningTrade_manual.pdf


Free Download

rfxsignals February 2, 2021 No Comments

Forex Technical Analysis & Forecast 02.02.2021

Forex Technical Analysis & Forecast 02.02.2021

02.02.2021

EURUSD, “Euro vs US Dollar”

After breaking 1.2093 to the downside, EURUSD is falling towards 1.2040. Possibly, today the pair may reach this level and then form a new consolidation range there. Later, the market may break the range to the upside and start a new growth with the target at 1.2200.

EURUSD
Risk Warning: the result of previous trading operations do not guarantee the same results in the future

GBPUSD, “Great Britain Pound vs US Dollar”

After finishing the ascending structure at 1.3750 along with the correction towards 1.3674, GBPUSD is consolidating around the latter level. Today, the pair may break this range to the downside and resume trading downwards with the target at 1.3587.

GBPUSD
Risk Warning: the result of previous trading operations do not guarantee the same results in the future

USDRUB, “US Dollar vs Russian Ruble”

After completing the ascending correction at 76.00, USDRUB is falling towards 75.03. Later, the market may break the latter level and continue trading downwards with the short-term target at 73.95.

USDRUB
Risk Warning: the result of previous trading operations do not guarantee the same results in the future

USDJPY, “US Dollar vs Japanese Yen”

USDJPY has reached the short-term upside target at 104.88; right now, it is consolidating around this level. Possibly, the pair may expand the range up to 105.05 and then start another correction towards 104.30. After that, the instrument may form one more ascending structure with the target at 105.20.

USDJPY
Risk Warning: the result of previous trading operations do not guarantee the same results in the future

USDCHF, “US Dollar vs Swiss Franc”

After completing the ascending wave at 0.8920 and then forming a new consolidation range around this level, USDCHF has broken it to the upside to reach 0.8971. Today, the pair may start a new correction to return to 0.8920 and then resume trading upwards with the target at 0.9000.

USDCHF
Risk Warning: the result of previous trading operations do not guarantee the same results in the future

AUDUSD, “Australian Dollar vs US Dollar”

AUDUSD is still consolidating around 0.7625 without any particular direction. Possibly, the pair may trade downwards to reach 0.7550 and then start another growth with the target at 0.7700.

AUDUSD
Risk Warning: the result of previous trading operations do not guarantee the same results in the future

BRENT

After completing the ascending structure at 56.30 and breaking it to the upside, Brent is still growing with the target at 57.90. Possibly, today the asset may reach 57.47 and then correct to test 56.30 from above. After that, the instrument may form one more ascending structure towards the above-mentioned target.

BRENT
Risk Warning: the result of previous trading operations do not guarantee the same results in the future

XAUUSD, “Gold vs US Dollar”

Gold is still consolidating around 1851.30 without any particular direction. Possibly, the metal may break the range to the downside and resume trading downwards with the target at 1827.00. Later, the market may form one more ascending structure to reach 1851.40.

GOLD
Risk Warning: the result of previous trading operations do not guarantee the same results in the future

BTCUSD, “Bitcoin vs US Dollar”

BTCUSD is still consolidating around 34000.00, Later, the market may break this range to the downside to reach 26600.00 and then resume growing with the target at 40400.00.

BITCOIN
Risk Warning: the result of previous trading operations do not guarantee the same results in the future

S&P 500

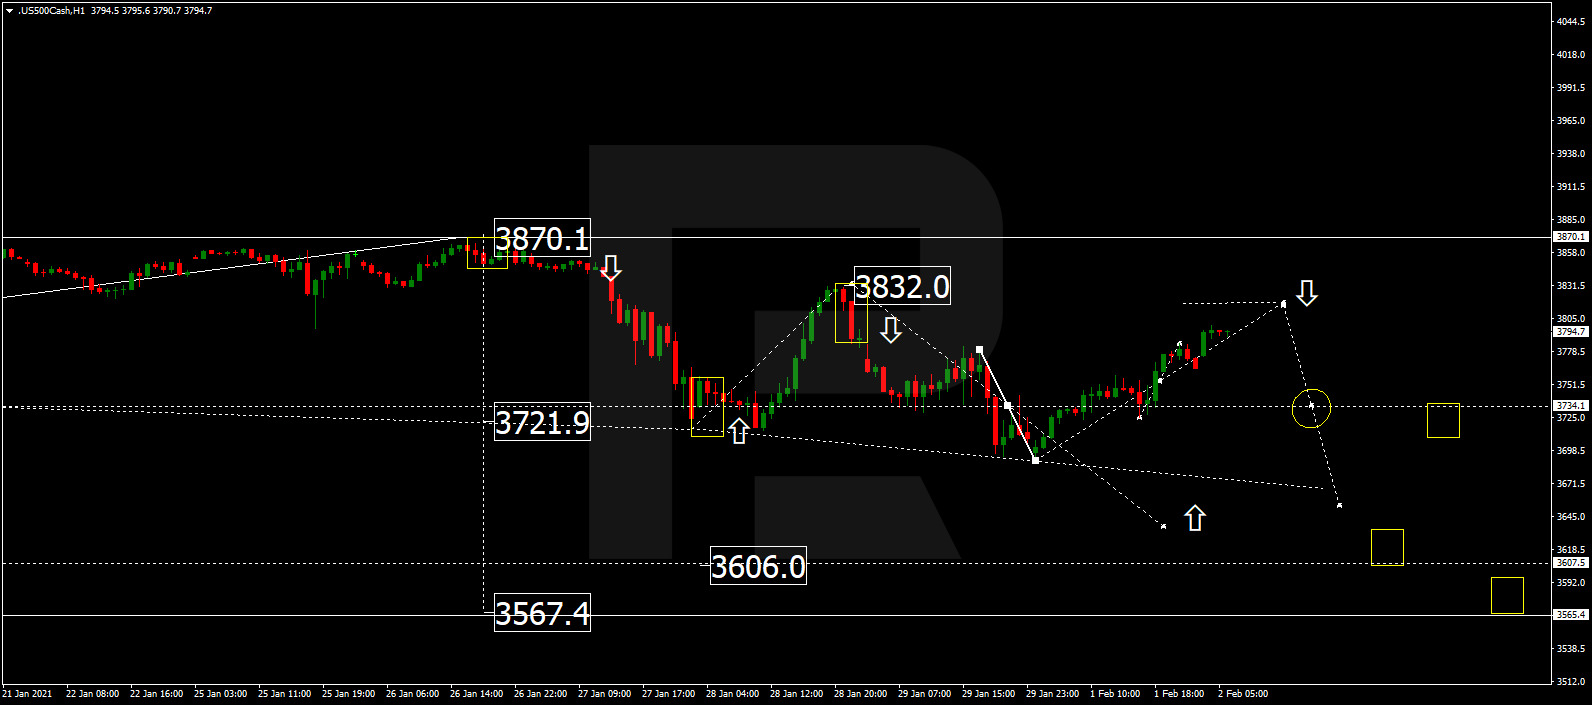
The S&P index is consolidating around 3734.1. Possibly, the asset may expand the range up to 3832.0. After that, the instrument may start a new decline to break 3700.0 and then continue falling with the target at 3567.4.

S&P 500

rfxsignals February 2, 2021 No Comments

Murrey Math Lines 02.02.2021 (AUDUSD, NZDUSD)

Murrey Math Lines 02.02.2021 (AUDUSD, NZDUSD)

02.02.2021

AUDUSD, “Australian Dollar vs US Dollar”

In the H4 chart, AUDUSD has broken the 200-day Moving Average and 5/8. In this case, the price is expected to continue falling to reach the closest support at 4/8. However, this scenario may be canceled if the price breaks 5/8 to the upside. After that, the instrument may reverse and grow towards the resistance at 6/8.

AUDUSD_H4
Risk Warning: the result of previous trading operations do not guarantee the same results in the future

As we can see in the M15 chart, the pair has broken the downside line of the VoltyChannel indicator and, as a result, may continue trading downwards.

AUDUSD_M15
Risk Warning: the result of previous trading operations do not guarantee the same results in the future

NZDUSD, “New Zealand Dollar vs US Dollar”

As we can see in the H4 chart, NZDUSD is moving above the 200-day Moving Average, thus indicating an ascending tendency. downwards. In this case, the price is expected to break 6/8 and then continue growing towards the resistance at 7/8. However, this scenario may no longer be valid if the price breaks 5/8 to the downside. In this case, the instrument may continue falling to reach the support at 4/8.

NZDUSD_H4
Risk Warning: the result of previous trading operations do not guarantee the same results in the future

In the M15 chart, the price may break the upside line of the VoltyChannel indicator and, as a result, continue growing.

NZDUSD_M15

rfxsignals February 2, 2021 No Comments

Japanese Candlesticks Analysis 02.02.2021 (USDCAD, AUDUSD, USDCHF)

Japanese Candlesticks Analysis 02.02.2021 (USDCAD, AUDUSD, USDCHF)

02.02.2021

USDCAD, “US Dollar vs Canadian Dollar”

As we can see in the H4 chart, the ascending tendency continues. Right now, after forming an Engulfing reversal pattern not far from the support level, USDCAD may reverse in the form of another rising wave towards 1.2910. Later, the asset may continue growing. However, an alternative scenario implies a further pullback towards 1.2750 before the asset resumes growing.

USDCAD
Risk Warning: the result of previous trading operations do not guarantee the same results in the future

AUDUSD, “Australian Dollar vs US Dollar”

As we can see in the H4 chart, AUDUSD is still forming the descending impulse. Right now, after forming several reversal patterns, such as Hammer, not far from the support area, the pair may reverse and resume growing to reach the resistance area at 0.7690. At the same time, an opposite scenario says that the price may fall to return to 0.7580 without testing the resistance area.

AUDUSD
Risk Warning: the result of previous trading operations do not guarantee the same results in the future

USDCHF, “US Dollar vs Swiss Franc”

As we can see in the H4 chart, the uptrend continues. At the moment, after forming several reversal patterns, such as Hanging Man, not far from the resistance area, USDCHF is correcting. Later, the asset may complete the correction and resume the ascending tendency. The correctional target may be the support area at 0.8880. Still, there might be an alternative scenario, according to which the asset may start a new growth towards 0.9000 without falling and testing the support area.

USDCHF

rfxsignals February 2, 2021 No Comments

Ichimoku Cloud Analysis 02.02.2021 (EURUSD, USDCAD, AUDUSD)

Ichimoku Cloud Analysis 02.02.2021 (EURUSD, USDCAD, AUDUSD)

02.02.2021

EURUSD, “Euro vs US Dollar”

EURUSD is trading at 1.2069; the instrument is moving below Ichimoku Cloud, thus indicating a descending tendency. The markets could indicate that the price may test Tenkan-Sen and Kijun-Sen at 1.2105 and then resume moving downwards to reach 1.1945. Another signal in favor of a further downtrend will be a rebound from the downside border of the Triangle pattern, which bears managed to break downwards. However, the bearish scenario may be canceled if the price breaks the cloud’s upside border and fixes above 1.2155. In this case, the pair may continue growing towards 1.2245.

EURUSD
Risk Warning: the result of previous trading operations do not guarantee the same results in the future

USDCAD, “US Dollar vs Canadian Dollar”

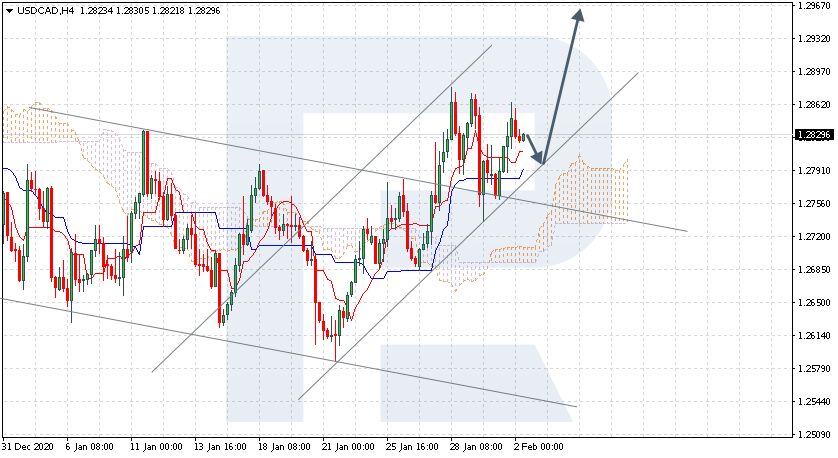
USDCAD is trading at 1.2829; the instrument is moving above Ichimoku Cloud, thus indicating an ascending tendency. The markets could indicate that the price may test Tenkan-Sen and Kijun-Sen at 1.2805 and then resume moving upwards to reach 1.2965. Another signal in favor of a further uptrend will be a rebound from the rising channel’s downside border. However, the bullish scenario may no longer be valid if the price breaks the cloud’s downside border and fixes below 1.2675. In this case, the pair may continue falling towards 1.2565.

USDCAD
Risk Warning: the result of previous trading operations do not guarantee the same results in the future

AUDUSD, “Australian Dollar vs US Dollar”

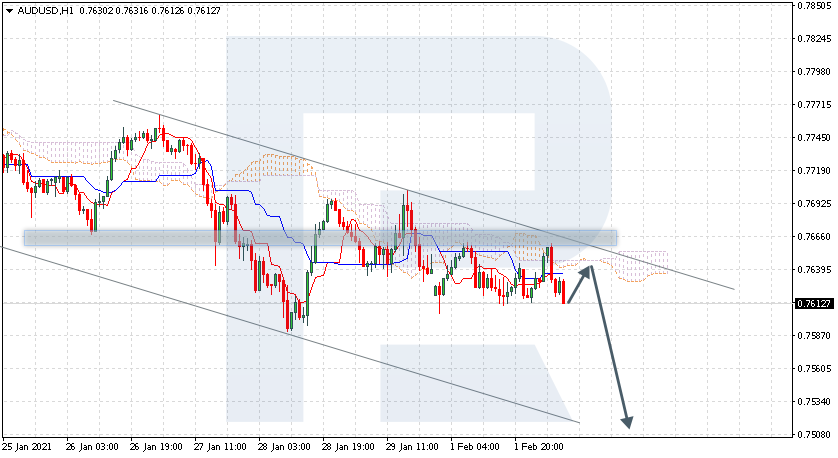
AUDUSD is trading at 0.7612; the instrument is moving below Ichimoku Cloud, thus indicating a descending tendency. The markets could indicate that the price may test the cloud’s downside border at 0.7640 and then resume moving downwards to reach 0.7510. Another signal in favor of a further downtrend will be a rebound from the descending channel’s upside border. However, the bearish scenario may no longer be valid if the price breaks the cloud’s upside border and fixes above 0.7775. In this case, the pair may continue growing towards 0.7865.

AUDUSD

rfxsignals February 2, 2021 No Comments

The Aussie remains under pressure. Overview for 02.02.2021

The Aussie remains under pressure. Overview for 02.02.2021

02.02.2021

AUDUSD continues falling after the RBA’s February meeting.

The Australian Dollar remains under pressure against the USD on Tuesday. The current quote for the instrument is 0.7627.

Earlier this morning, the Reserve Bank of Australia had its first meeting this year and kept the benchmark rate unchanged at 0.10%, just as expected. Other parameters of the regulator’s monetary policy also weren’t expected to change but the RBA decided the other way. This time, the central bank made a decision to expand the bond-buying program by another A$100 billion (~$76.3 billion).

This is a pretty significant expansion to the existing program, which is also worth A$100 billion will expire in March 2021. It appears that the stimulus program will continue in order to, according to the RBA, prevent the country’s interest rates from growing. On average, the regulator will buy bonds for A$5 billion a week, thus providing significant support to the Australian economy

In the comments, the RBA said that the labor market was more or less stable, the number of jobs went up while the unemployment decreased to 6.6%. At the same time, the retail sales report showed some revival, which is also a good sign. These were exactly the comments investors were waiting for but they didn’t help the Aussie. The program expansion puts pressure on the national currency although its effect is nothing but positive.

The RBA Governor will speak before the end of this week – he is expected to talk about the economic outlook and other aspects, that’s why the volatility period of the Aussie is “far from done”.

rfxsignals February 2, 2021 No Comments

The Euro slowed down its decline. Overview for 02.02.2021

The Euro slowed down its decline. Overview for 02.02.2021

02.02.2021

EURUSD plunged yesterday but market players are in no hurry to sell today.

The major currency pair stopped falling on Tuesday morning the way it did yesterday; investors are waiting and watching. The current quote for the instrument is 1.2070.

Yesterday, there were a lot of talks “on the sidelines” that the USA got an advantage in helping its economy to recover faster due to the fast-paced vaccination. It supported the USD and put additional pressure on the Yen and the Euro.

Like it was said earlier, all statistics from Germany will hit the stage soon and the data published yesterday was no exception: the Retail Sales showed -9.6% m/m in December after being 1.1% m/m in November and against the expected reading of -2.0% m/m. The key reason for this decline is quarantine restrictions and lockdown, which were introduced to control the pandemic. Consumer interest and, as a consequence, retail sales plummeted. Most likely, the January data will be pretty much the same.

For the Euro, any negative news from Germany is now a clear reason for plunging.

Later today, investors should pay attention to the Euro Area GDP report for the fourth quarter of 2020, which is expected to show -0.9% q/q after being 12.5% q/q the quarter before. The stronger the reading, the more chances the Euro has to recover.

rfxsignals February 2, 2021 No Comments

Fibonacci Retracements Analysis 02.02.2021 (EURUSD, USDJPY)

Fibonacci Retracements Analysis 02.02.2021 (EURUSD, USDJPY)
02.02.2021
EURUSD, “Euro vs US Dollar”

As we can see in the H4 chart, the situation hasn’t changed much. After completing the correctional uptrend and attempting to break 38.2% fibo, EURUSD has rebounded from it. At the moment, the pair is forming another rising wave to break the above-mentioned level and continue growing towards 50.0% and 61.8% fibo at 1.1976 and 1.1888 respectively. After the correction is over, the asset may start a new mid-term rising wave to break the high at 1.2350 and then continue growing towards the long-term fractal high at 1.2555.

EURUSD_H4
Risk Warning: the result of previous trading operations do not guarantee the same results in the future
The H1 chart shows that after reaching 38.2% fibo, the correctional uptrend has failed to reach 50.0% fibo at 1.2202. A local divergence on MACD hinted at a further decline towards the low at 1.2054. If EURUSD breaks the low, the asset may continue trading downwards to reach the mid-term 50.0% fibo at 1.1976.

EURUSD_H1
Risk Warning: the result of previous trading operations do not guarantee the same results in the future
USDJPY, “US Dollar vs. Japanese Yen”

As we can see in the H4 chart, the pair has broken the mid-term 23.6% fibo at 104.74; right now, it is still moving upwards. This movement is looking quite confident and stable but the asset may start a new pullback at any moment. After the pullback, the price may continue growing towards 38.2% and 50.0% fibo at 106.07 107.15 respectively. On the other hand, if the asset breaks the low at 102.59, the instrument may continue falling to reach the fractal low at 101.18.

USDJPY_H4
Risk Warning: the result of previous trading operations do not guarantee the same results in the future
In the H1 chart, there is a divergence on MACD, which may hint at a new short-term pullback to reach 23.6%, 38.2%, and 50.0% fibo at 104.64, 104.39, and 104.18 respectively. However, a breakout of the local high at 105.04 will complete the correction.

USDJPY_H1

rfxsignals February 1, 2021 No Comments

Daily Free Forex Signals For 01/02/2021

Here your going to see Daily Free Forex Signals For 01/02/2021 to free forex signal alert from our kitkat trading system and other trading logic’s .we provide like this free forex signals from 2012 on wards with more than 50,000 traders around the world .The free forex signals have 70 to 85% quality always .we give for you a note as maximum focus take profit 1 as your target and must use stop loss values .if you have any other query’s please visit our live chat or email option


GBPUSD BUY-1.373125
SL-1.369328
TP1-1.374678
TP2-1.376329

USDJPY SELL-104.680204
SL-105.030297
TP1-104.523803
TP2-104.362393

AUDUSD BUY-0.764439
SL-0.761091
TP1-0.765953
TP2-0.767485

USDCAD SELL-1.278109
SL-1.281498
TP1-1.276539
TP2-1.275053

GBPJPY BUY-143.704638
SL-143.362096
TP1-143.859314
TP2-144.0082

AUDJPY BUY-80.047384
SL-79.727792
TP1-80.200
TP2-80.34961

NZDCAD SELL-0.918141
SL-0.921272
TP1-0.916611
TP2-0.914956

CADJPY SELL-81.906735
SL-82.246327
TP1-81.750204
TP2-81.586327

GBPUSD SELL-1.368515
SL-1.371682
TP1-1.366949
TP2-1.365383

EURGBP BUY-0.883022
SL-0.879316
TP1-0.884562
TP2-0.886122

rfxsignals February 1, 2021 No Comments

Fibonacci Retracements Analysis 01.02.2021 (GOLD, USDCHF)

Fibonacci Retracements Analysis 01.02.2021 (GOLD, USDCHF)

01.02.2021

XAUUSD, “Gold vs US Dollar”

In the H4 chart, a local convergence on MACD made the pair corrected and then started consolidating. This consolidation may warn about a new impulse movement. If the price breaks this consolidation channel to the upside, the asset may form a proper rising wave towards 76.0% fibo at 2000.00. Another scenario implies that the asset may break the channel downwards to reach the low at 1764.36, a breakout of which will lead to a further long-term downtrend towards 38.2% at 1725.37.

GOLD_H4
Risk Warning: the result of previous trading operations do not guarantee the same results in the future

The H1 chart shows a more detailed structure of the consolidation range. At the moment, the price is moving between 23.6% and 38.2% fibo. In the short-term, the asset may continue growing towards 50.0% and 61.8% fibo at 1880.55 and 1899.10 respectively. the local support is the low at 1801.79.

GOLD_H1
Risk Warning: the result of previous trading operations do not guarantee the same results in the future

USDCHF, “US Dollar vs Swiss Franc”

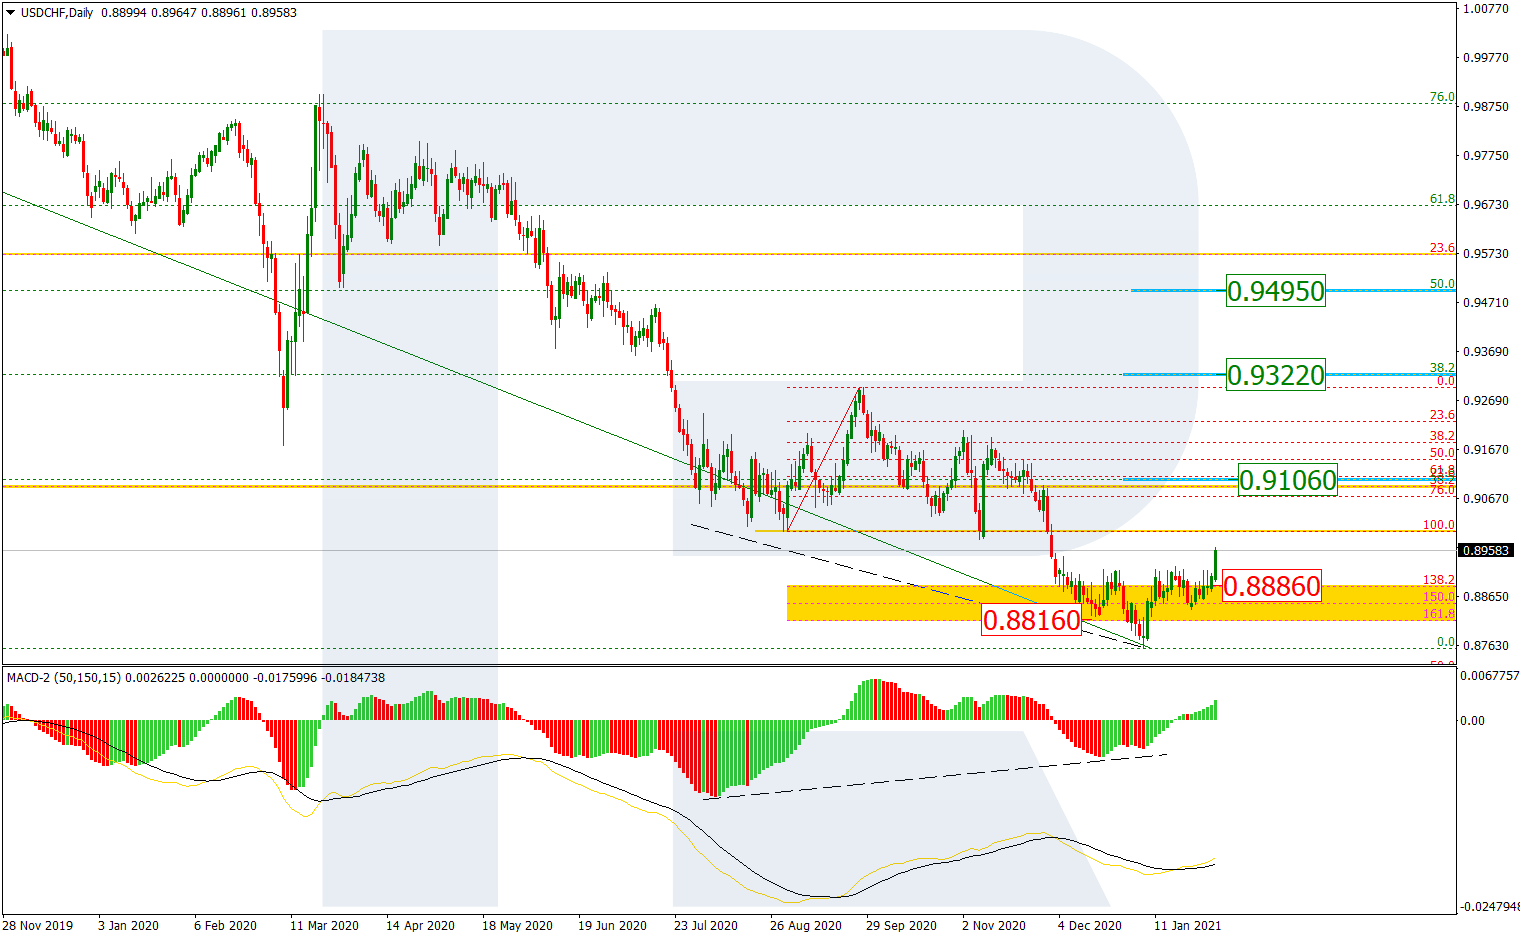
As we can see in the daily chart, after testing the post-correctional extension area between 138.2% and 161.8% fibo at 0.8886 and 0.8816 respectively, USDCHF is forming a new rising wave that may transform into a proper uptrend. In the mid-term, this growth may be heading towards 23.6%, 38.2%, and 50.0% fibo at 0.9106, 0.9322, and 0.9495 respectively.

USDCHF_D1
Risk Warning: the result of previous trading operations do not guarantee the same results in the future

The H1 chart shows a more detailed structure of the correctional trend. The asset is approaching 50.0% fibo at 0.8975 and may later continue growing 61.8% and 76.0% fibo at 0.9026 and 0.9087 respectively. The support is the low at 0.8757.

USDCHF_H1
Risk Warning: the result of previous trading operations do not guarantee the same results in the future