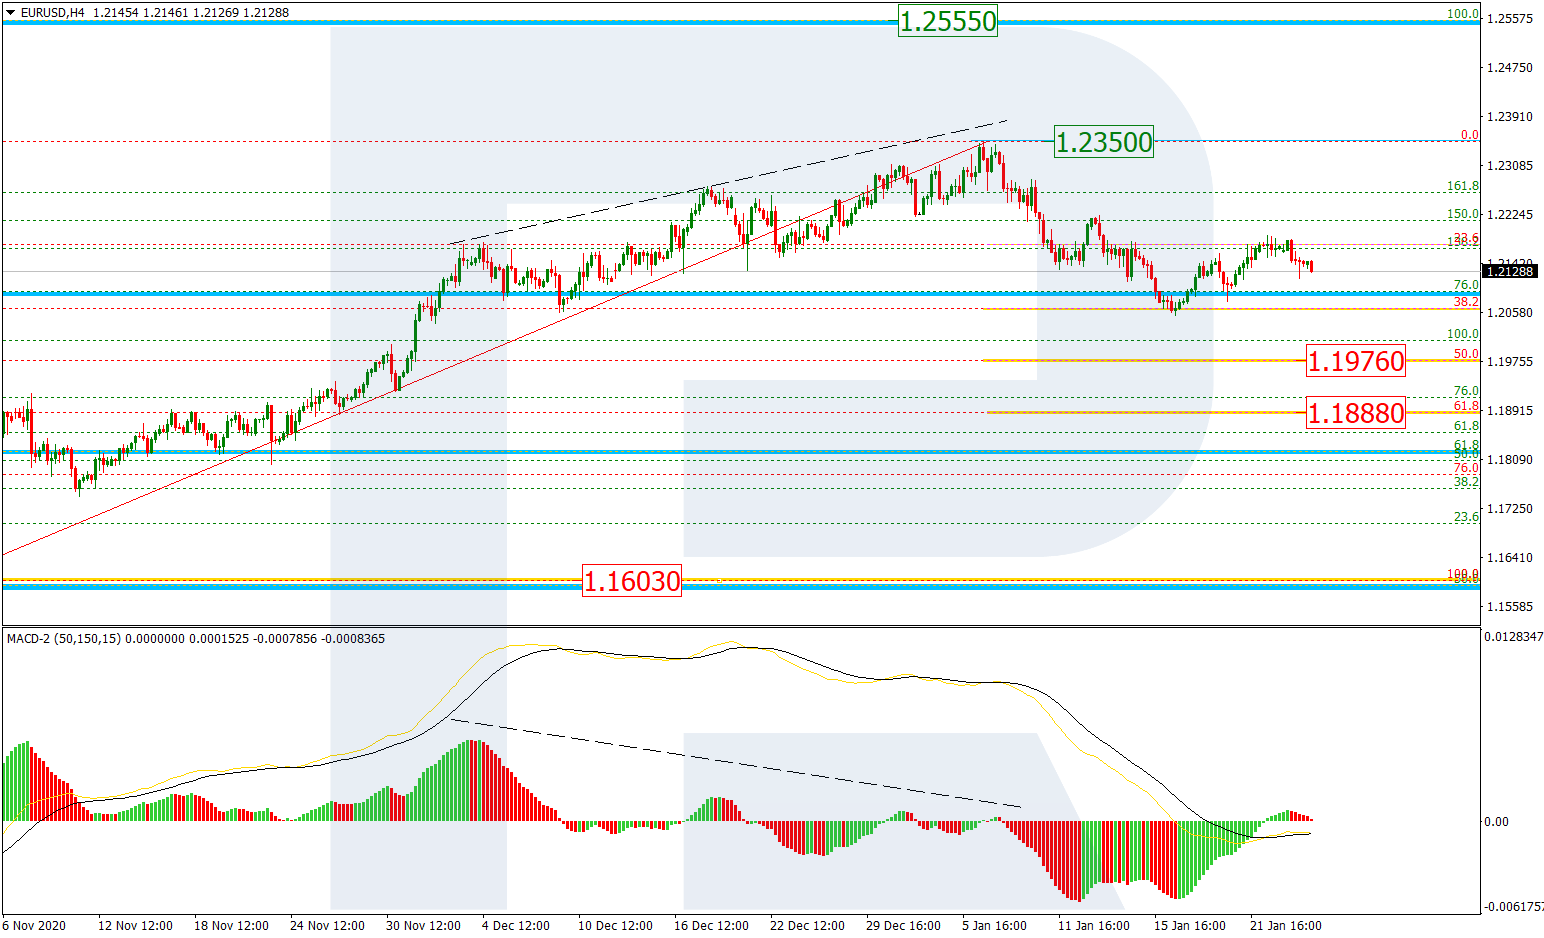
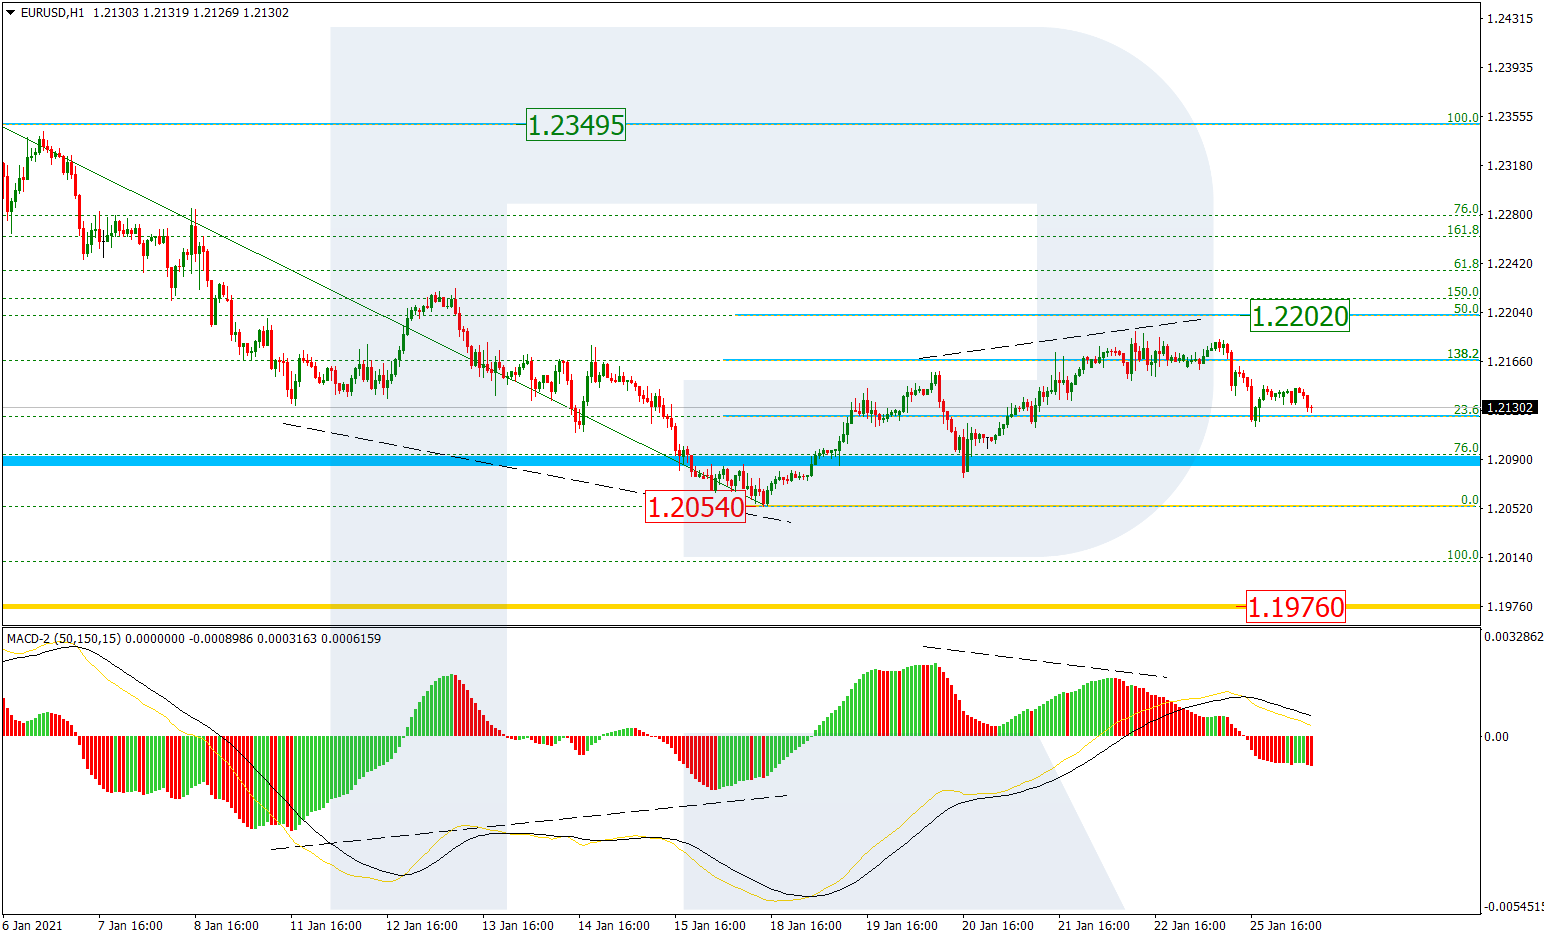
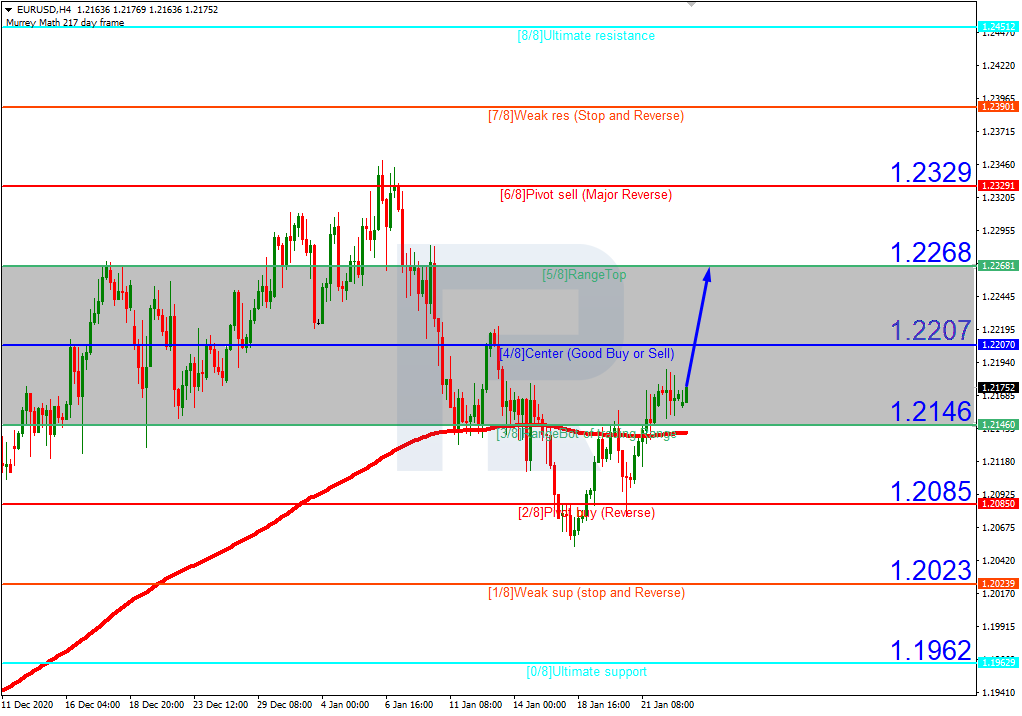
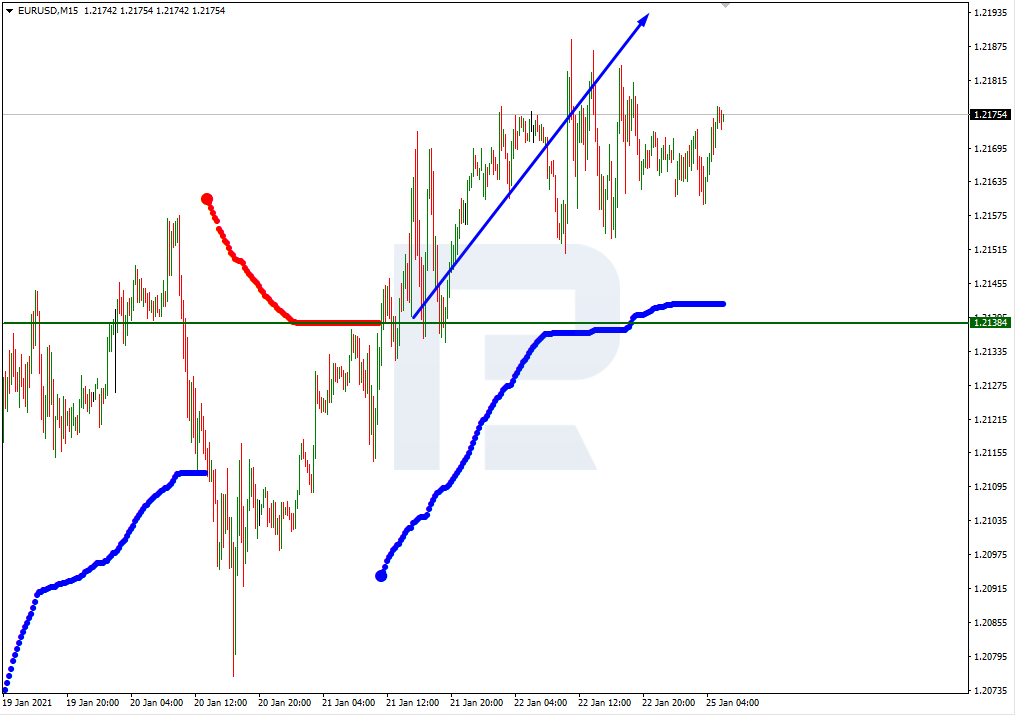
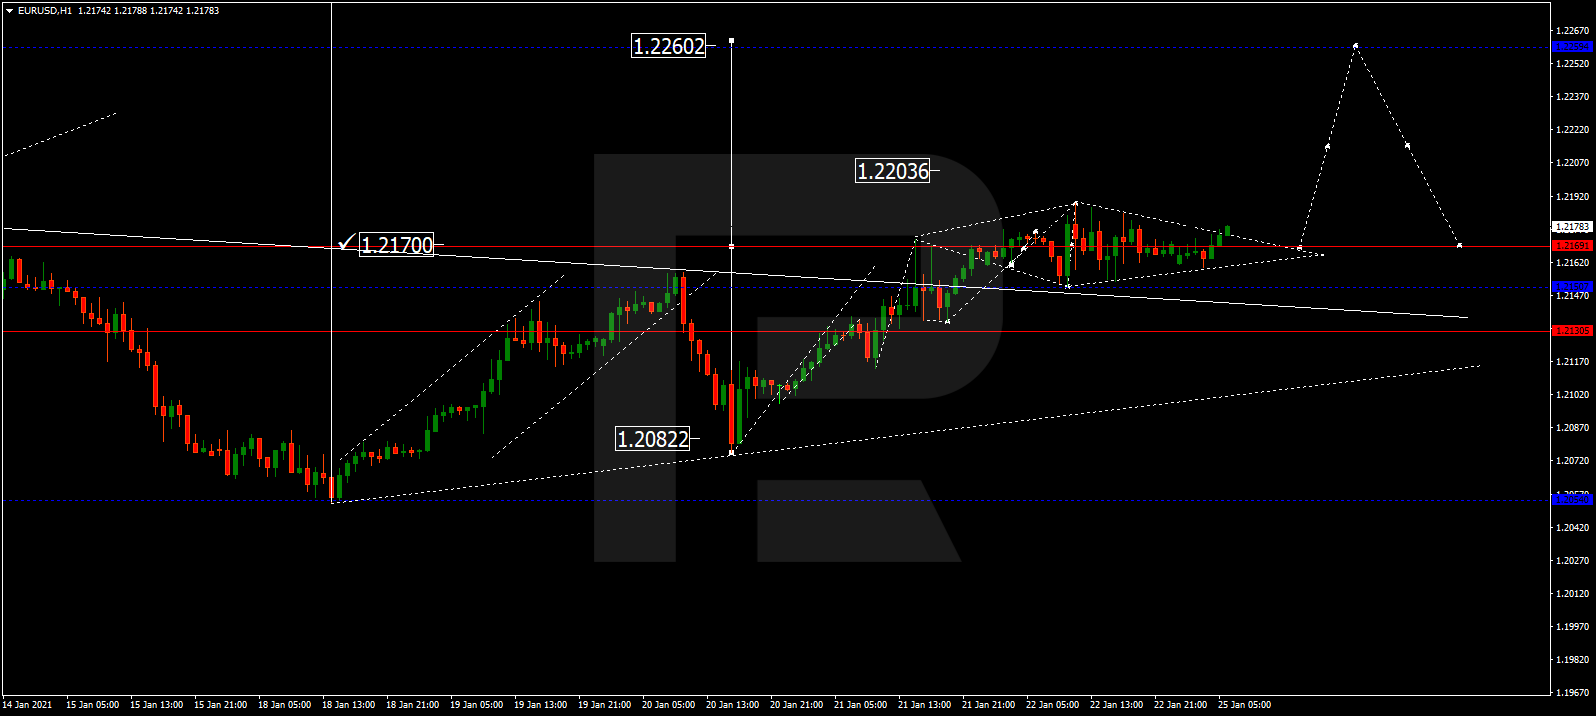
EURUSD, “Euro vs US Dollar”
EURUSD has formed another consolidation range around 1.2170; right now, it is moving to break it to the upside to reach the target at 1.2260. Later, the market may return to 1.2170 and then resume trading within the uptrend with the target at 1.2282.

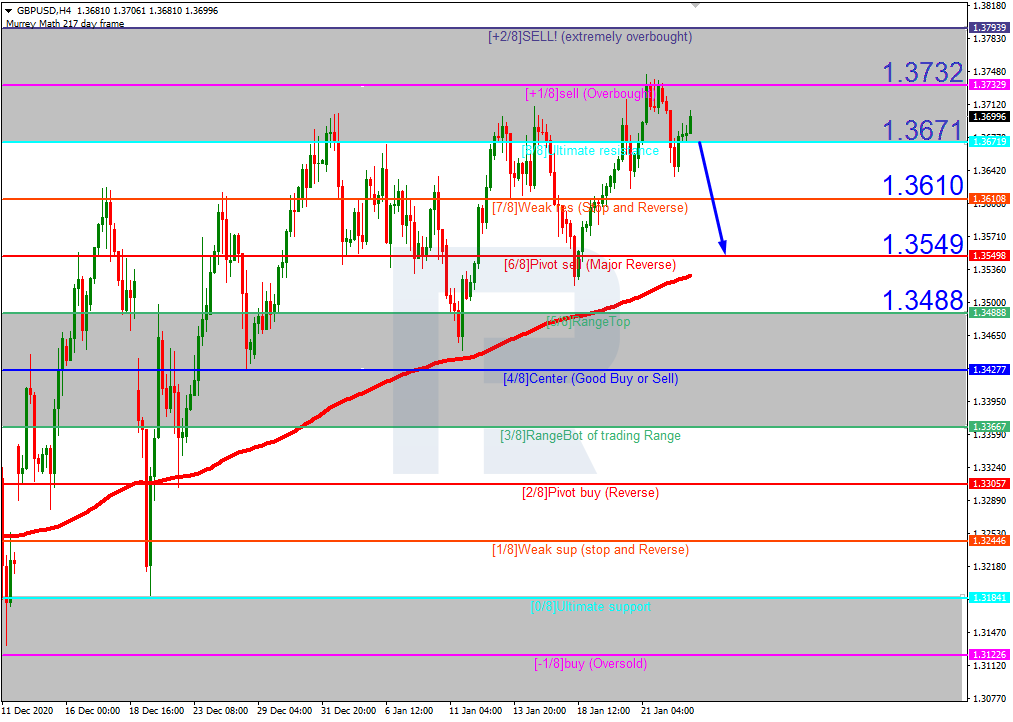
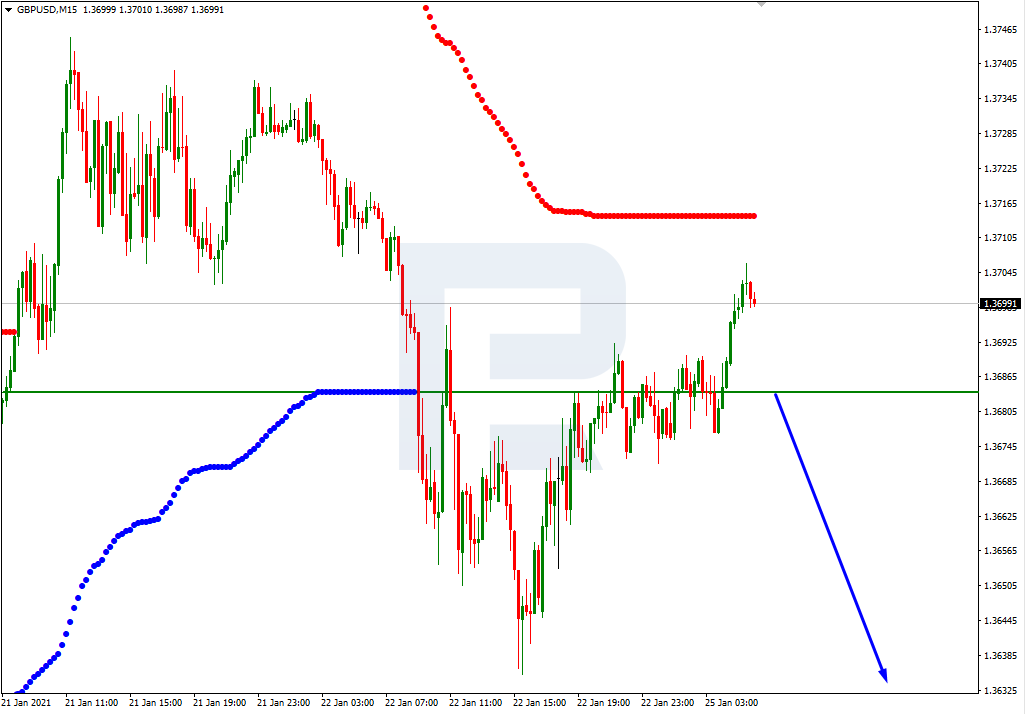
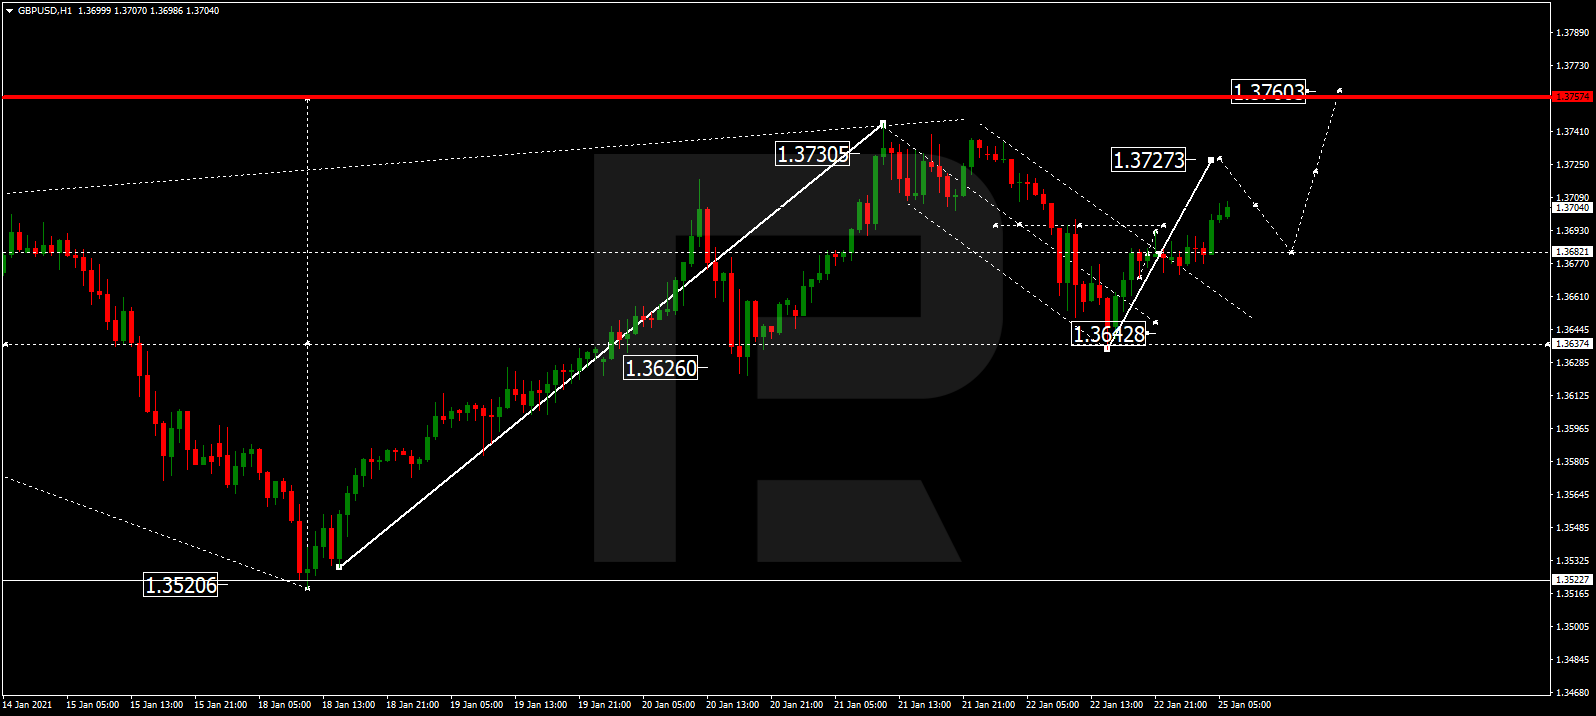
GBPUSD, “Great Britain Pound vs US Dollar”
After finishing the correctional wave at 1.3642, GBPUSD is forming one more ascending structure towards 1.3727. After that, the instrument may correct to reach 1.3682 and then start another growth with the target at 1.3760.
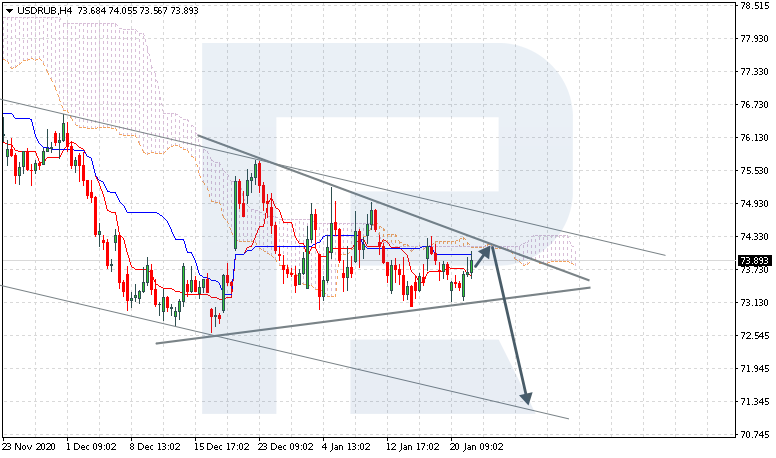
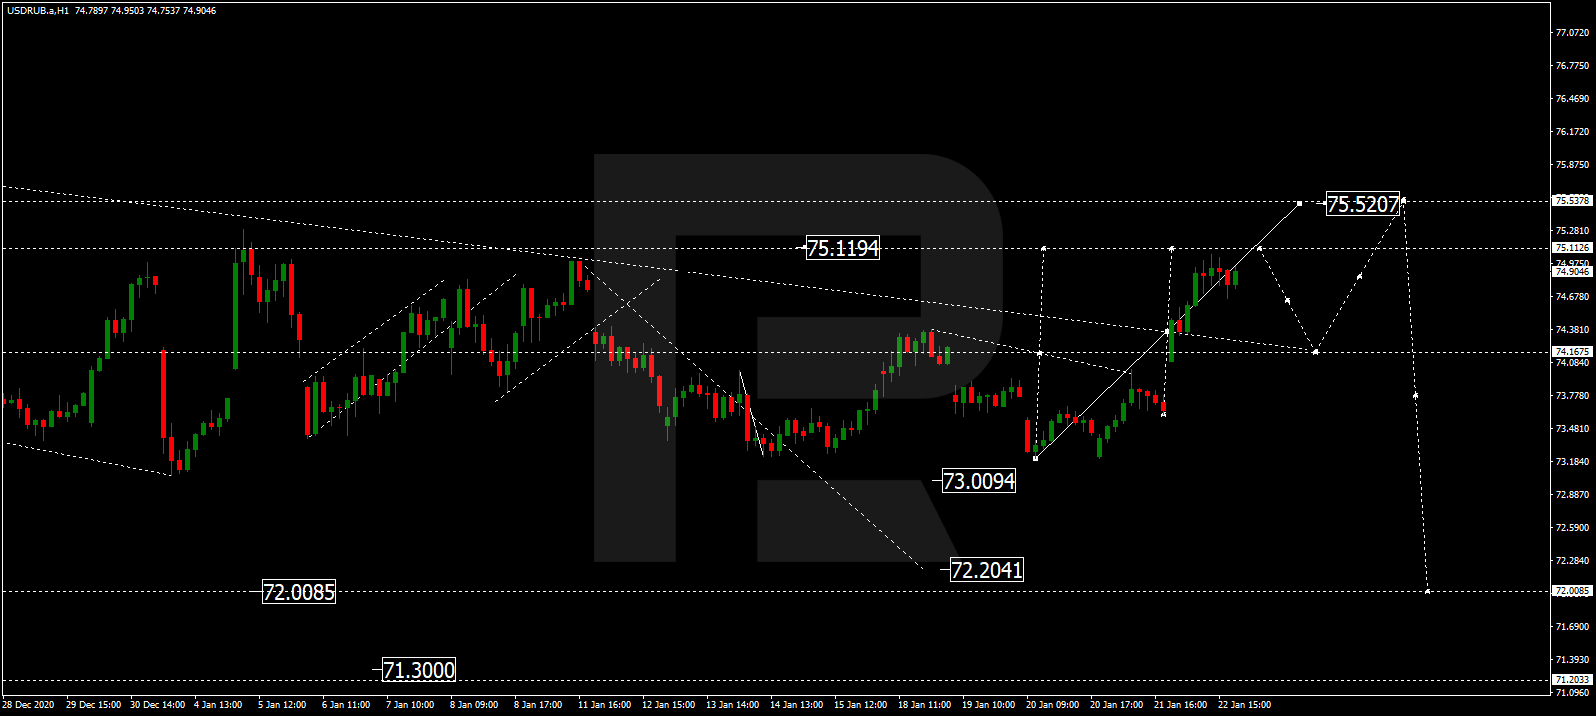
USDRUB, “US Dollar vs Russian Ruble”
After breaking 74.30 to the upside, USDRUB is expected to continue the correction and reach 75.52. Later, the market may fall to reach 74.20 and then form one more ascending structure with the target at 75.65.
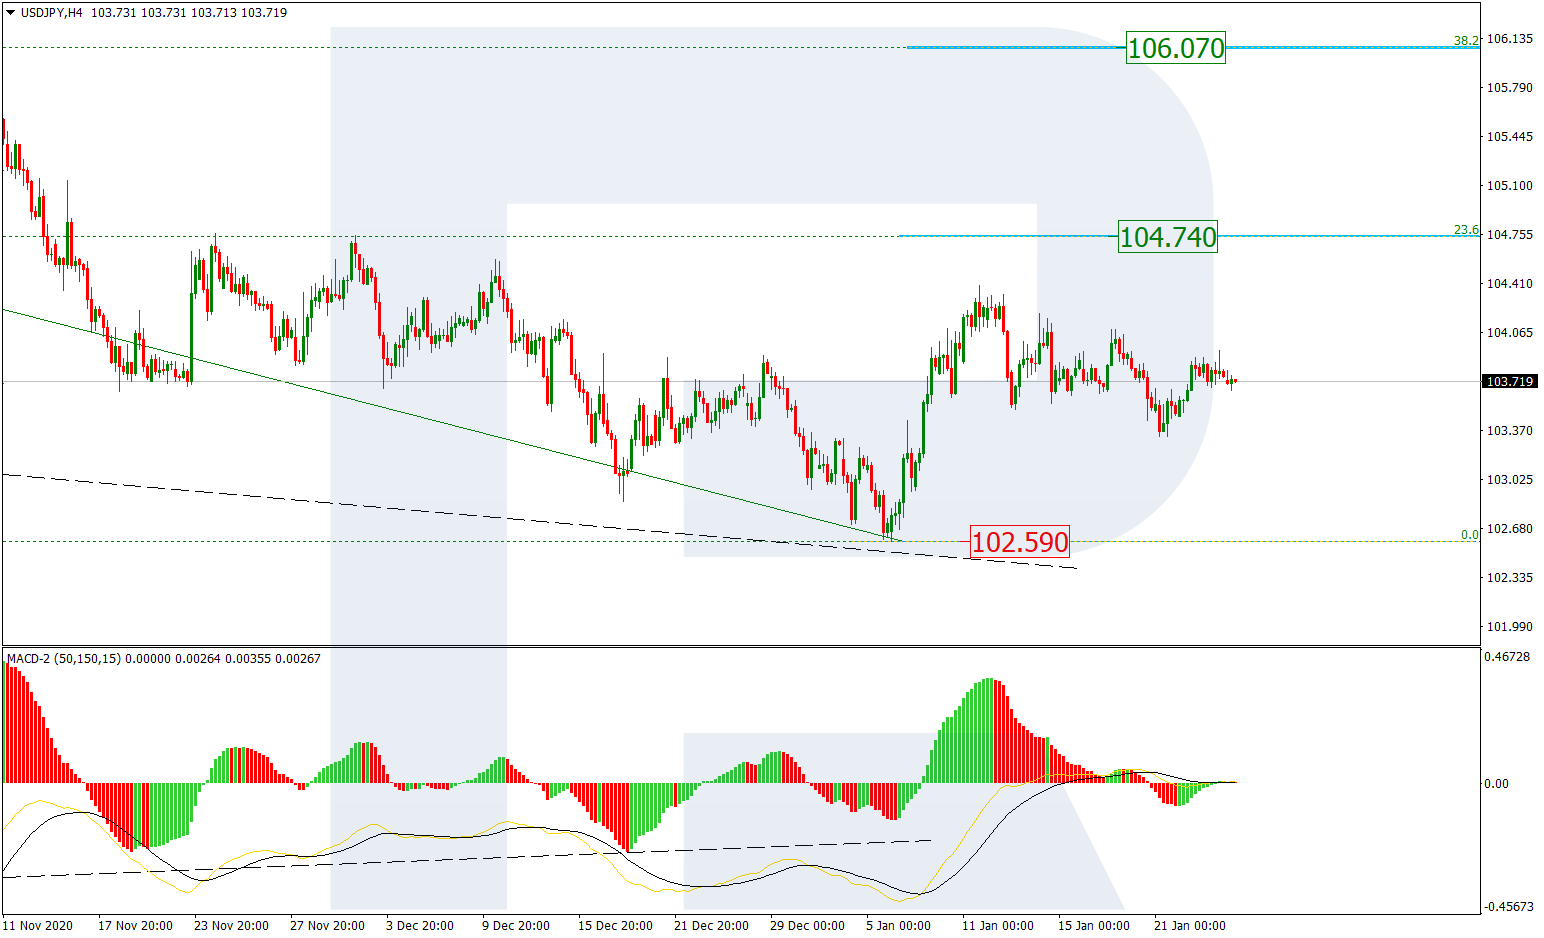
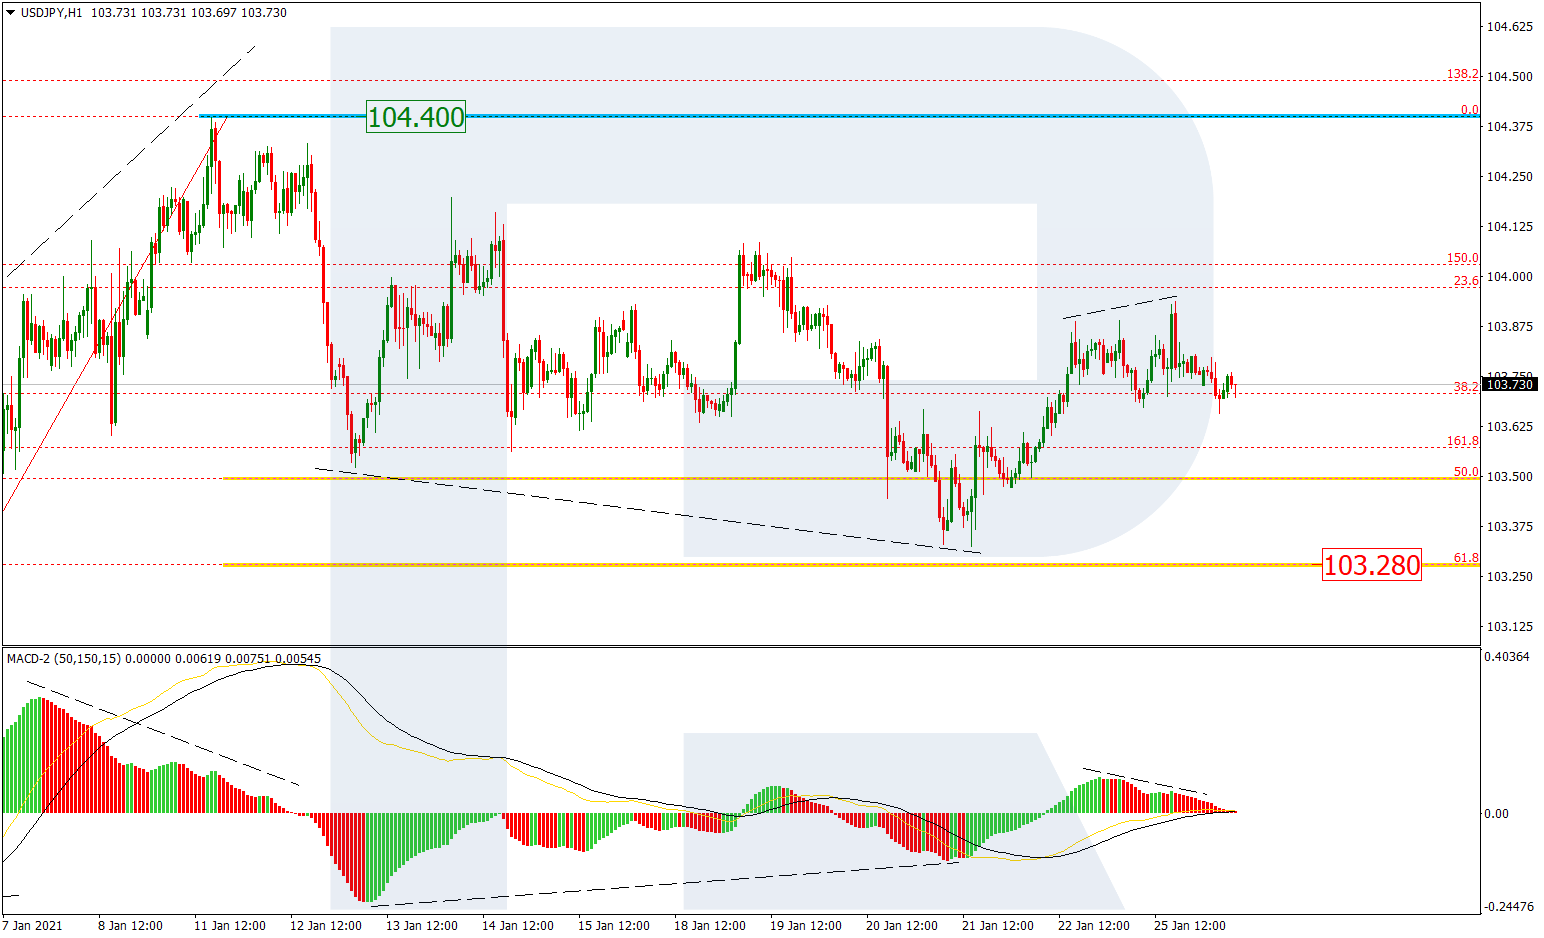
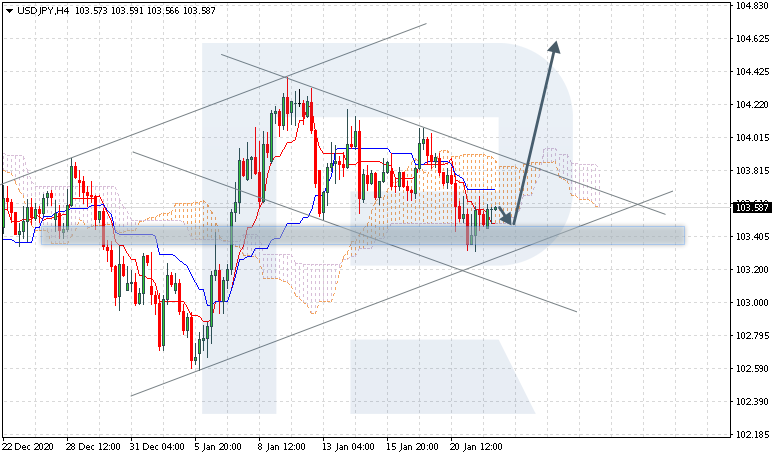
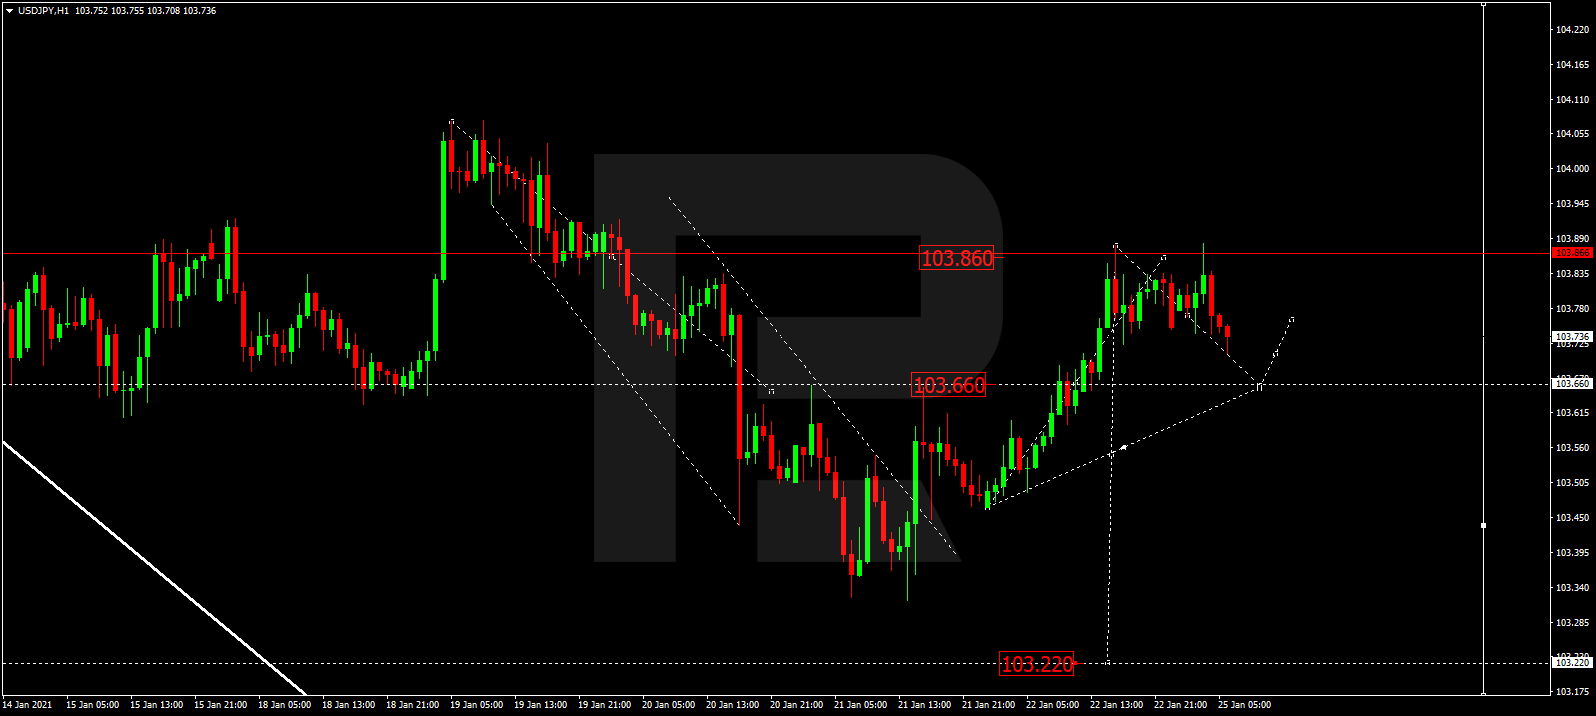
USDJPY, “US Dollar vs Japanese Yen”
After finishing the ascending wave at 103.86, USDJPY is falling to reach 103.66 and may form a new consolidation range around this level. Possibly, the pair may break the downside border and start a new decline with the target at 103.22.
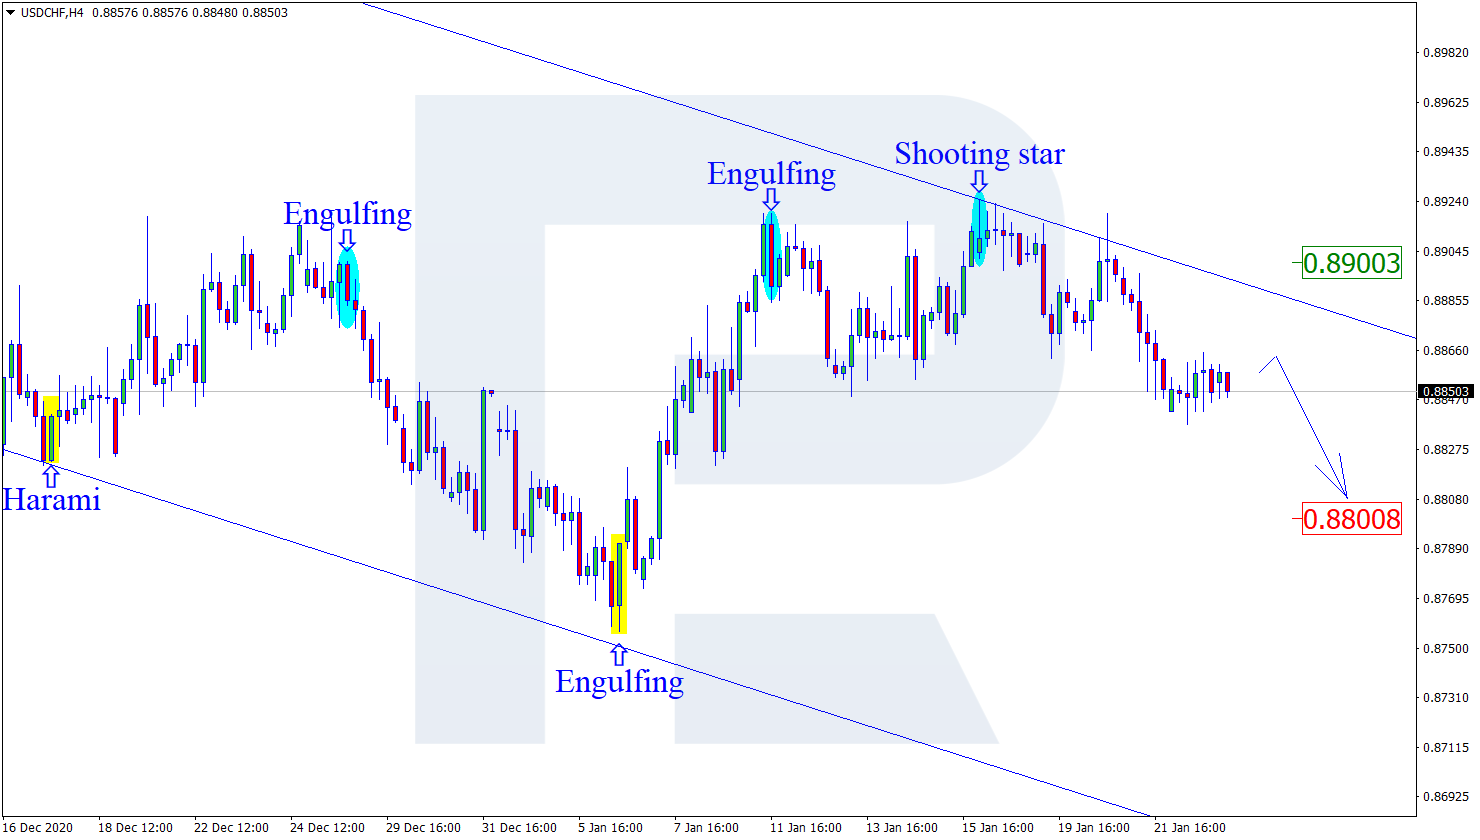
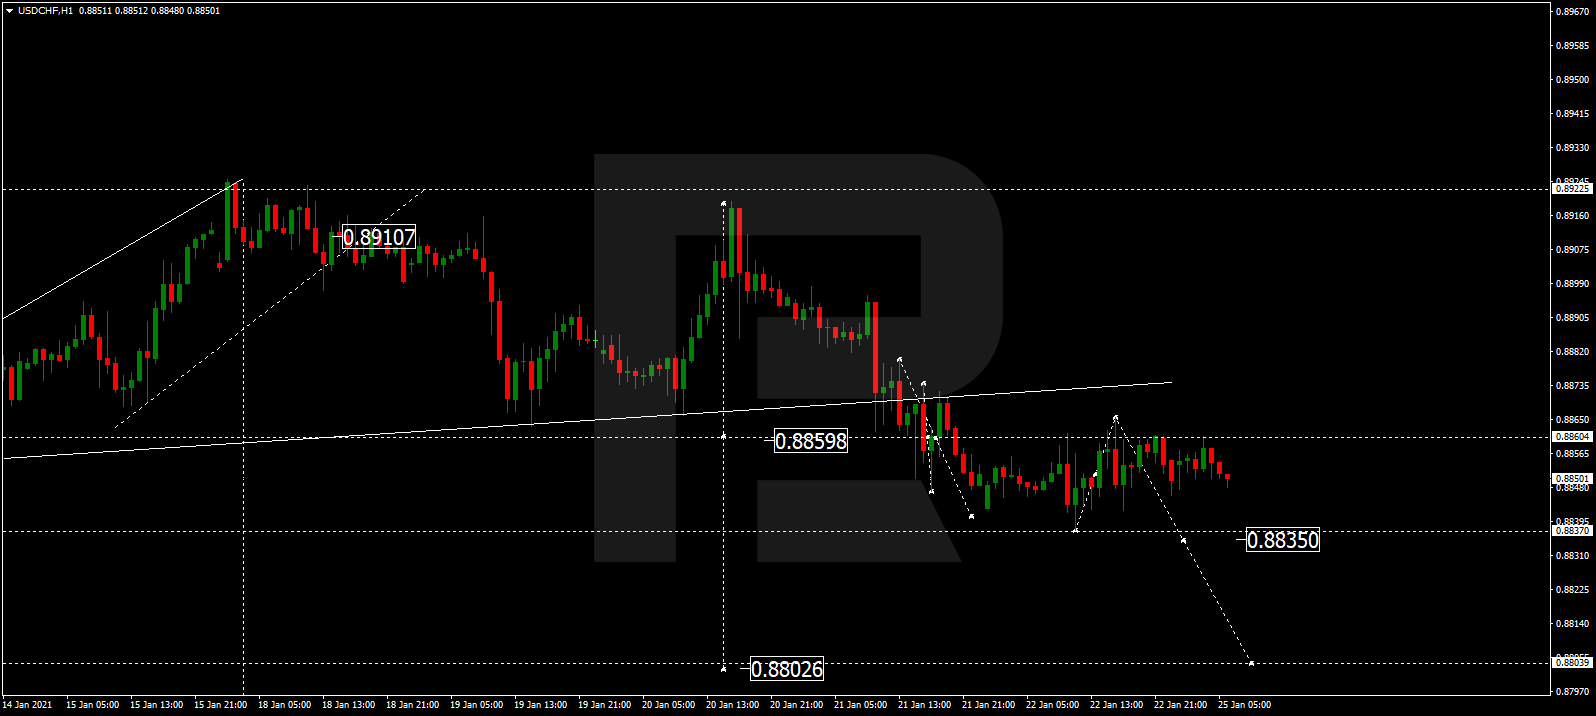
USDCHF, “US Dollar vs Swiss Franc”
After finishing the descending wave at 0.8835 and then returning to 0.8860, USDCHF is still consolidating and this range may be considered as a downside continuation pattern. If later the price breaks 0.8835 to the downside, the market may resume trading downwards with the short-term target at 0.8802.
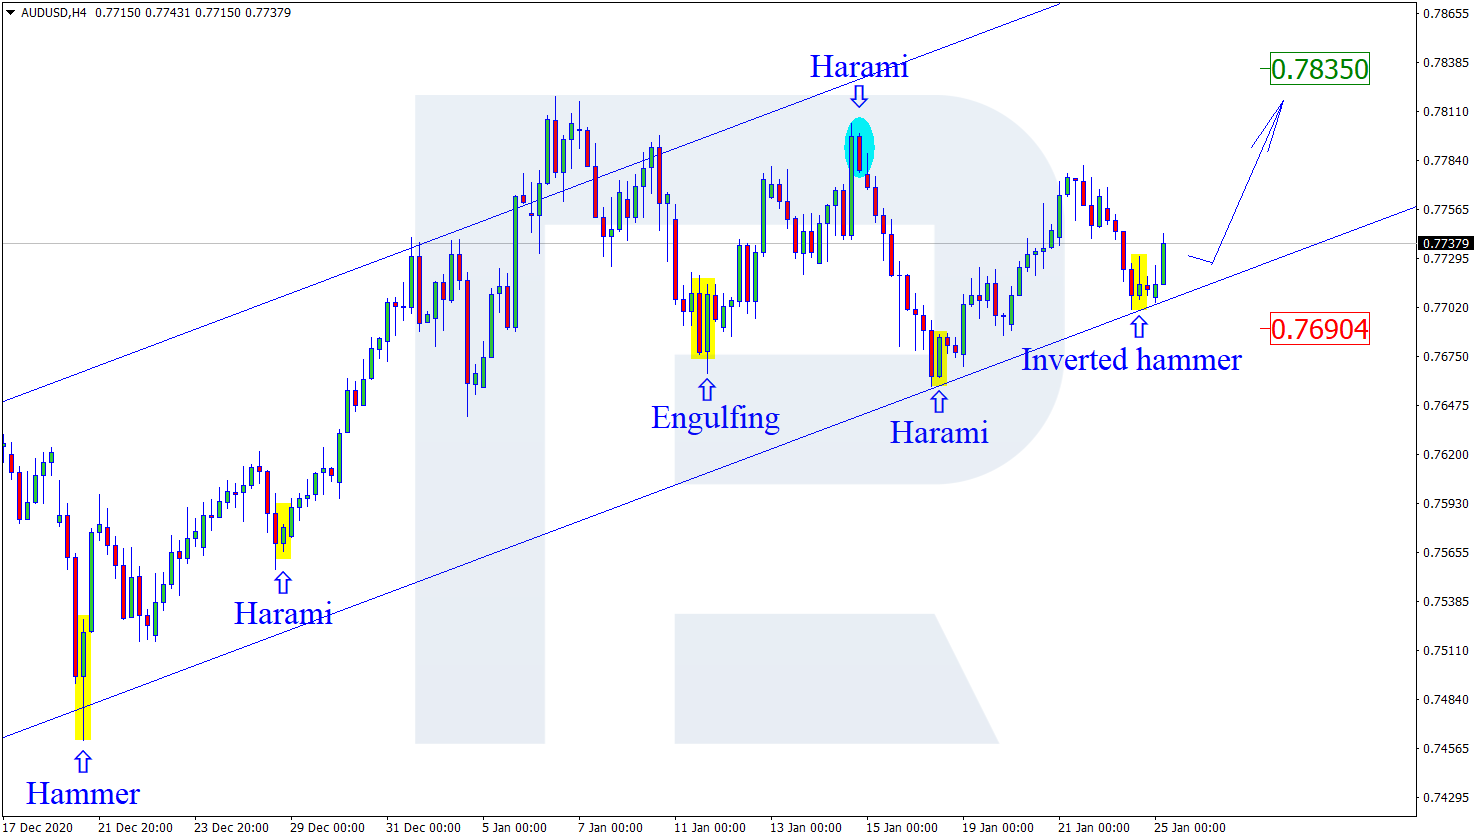
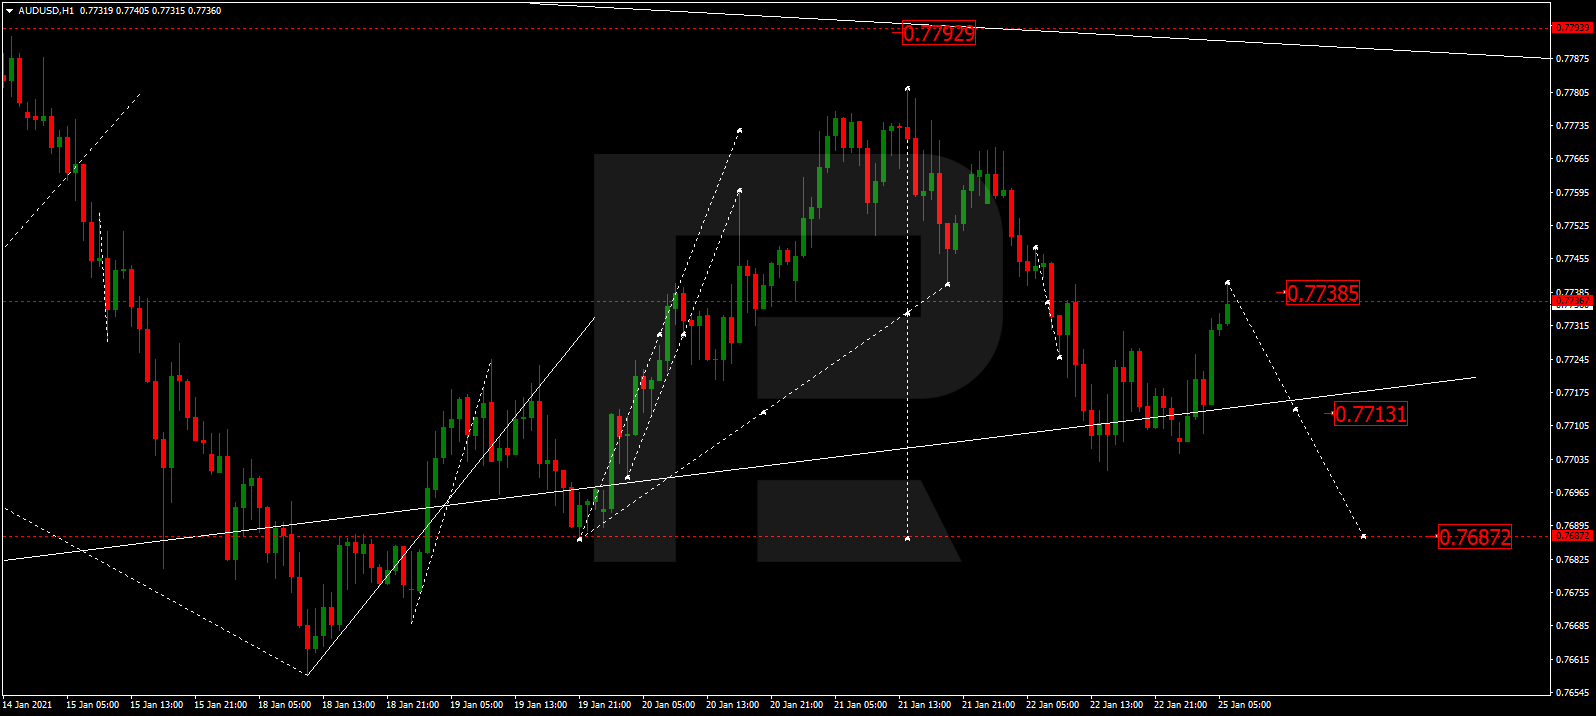
AUDUSD, “Australian Dollar vs US Dollar”
After completing the descending wave at 0.7700 and then returning to 0.7737, AUDUSD is expected to fall and reach 0.7686. After that, the instrument may start another growth to break 0.7737 and then continue trading within the uptrend with the target at 0.7792.
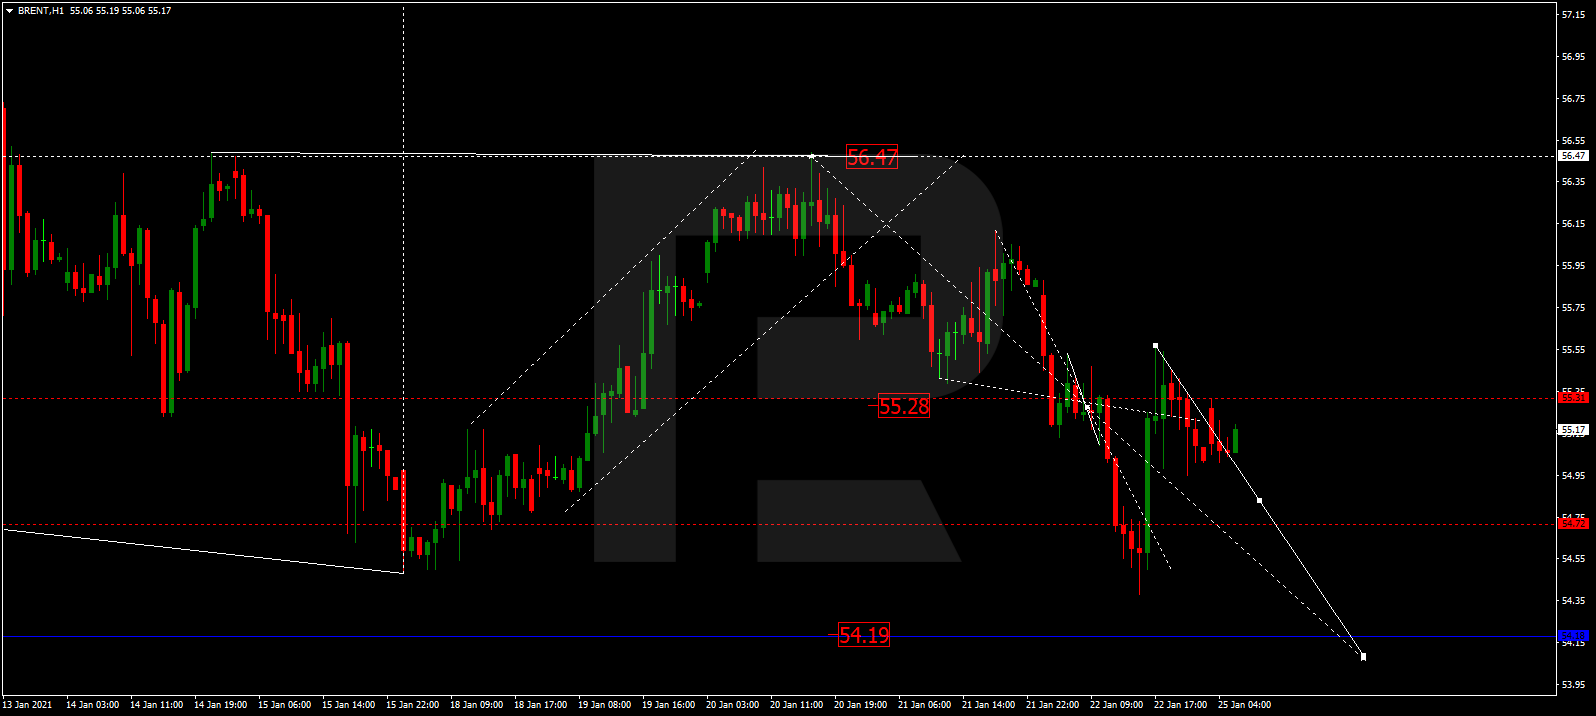
BRENT
After finishing the correction at 54.30, Brent has completed the ascending structure towards 55.35 to test it from below. Possibly, today the asset may resume trading downwards with the short-term target at 54.10.
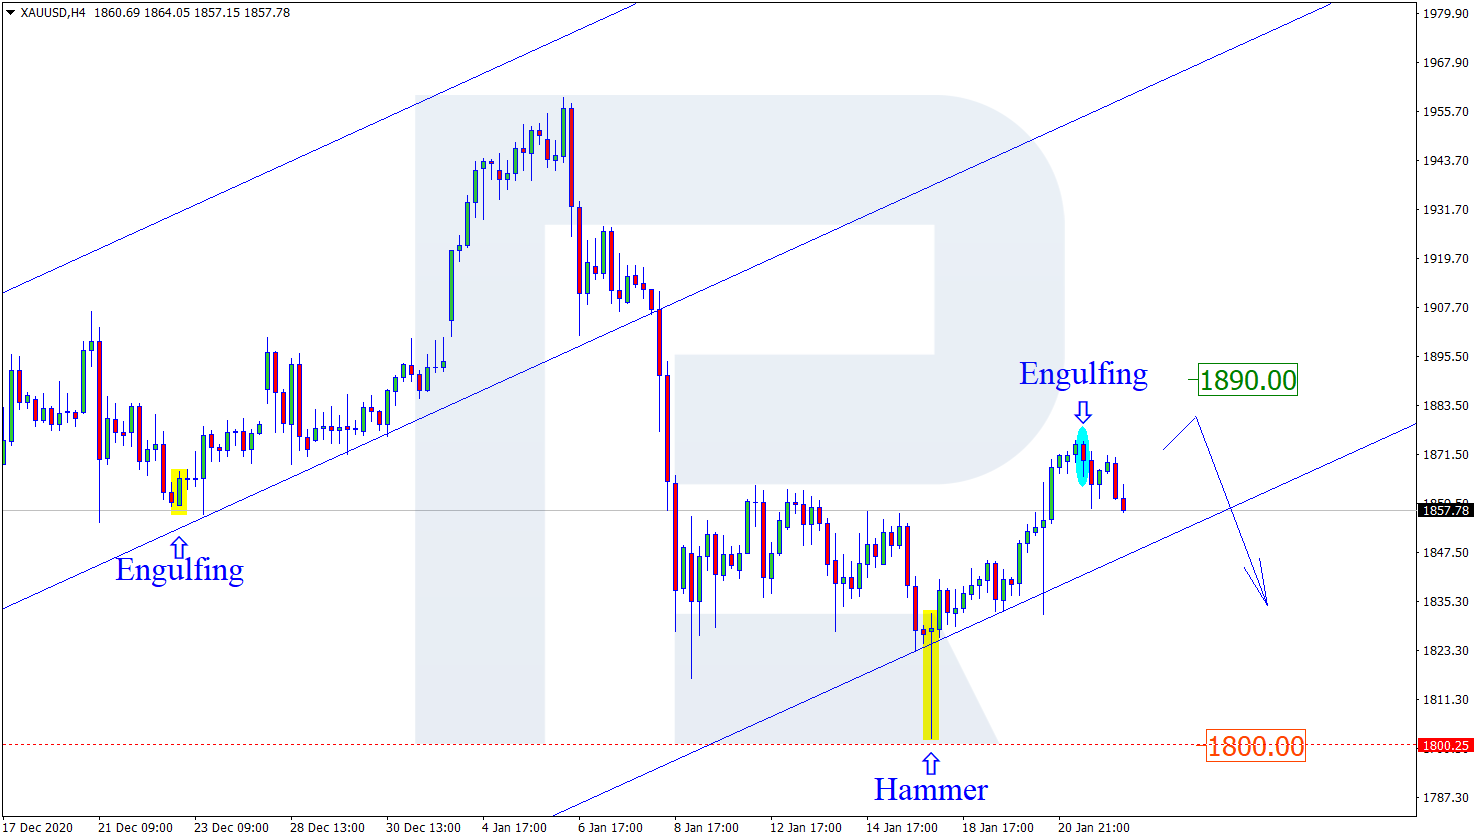
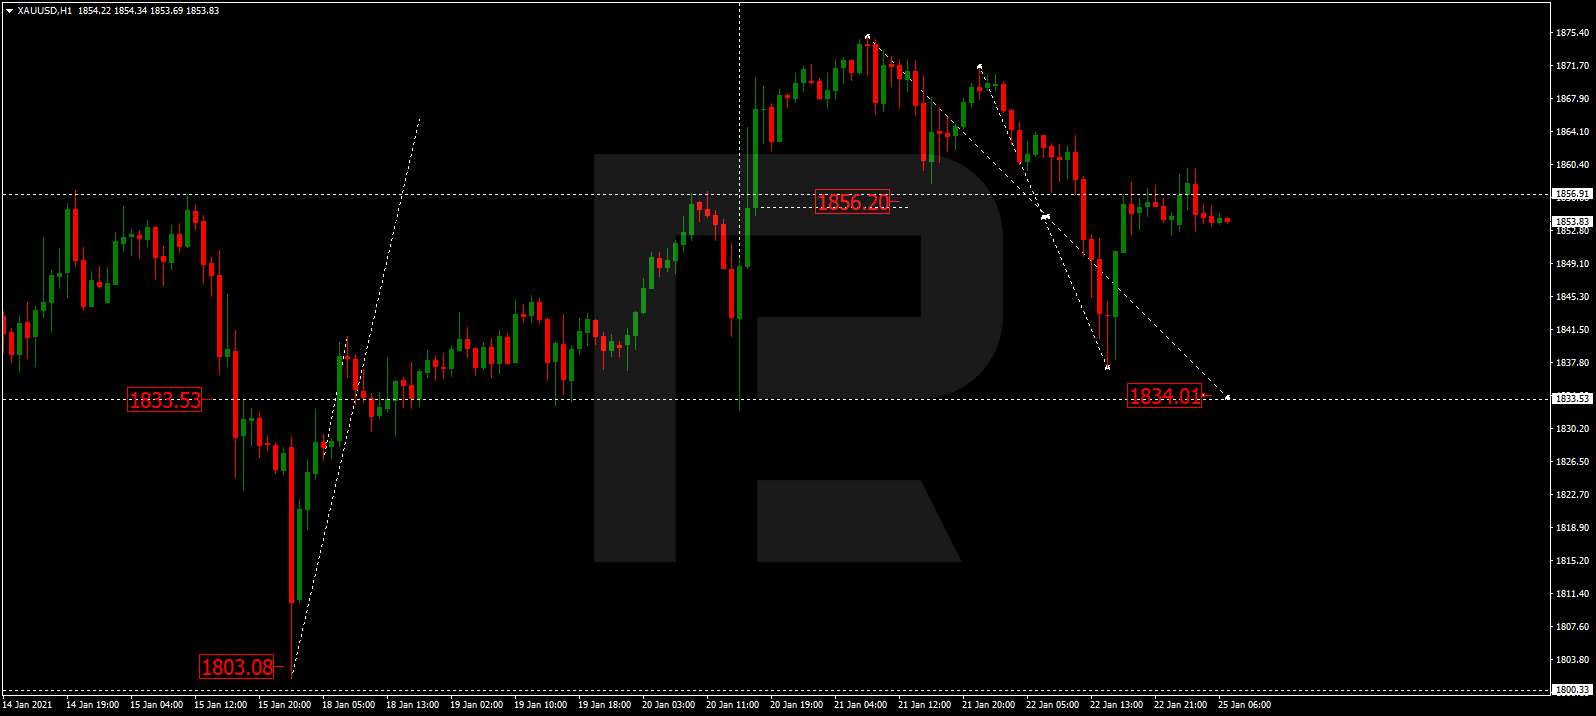
XAUUSD, “Gold vs US Dollar”
After completing the descending wave at 1837.37 along with the correction towards 1855.00, Gold is expected to start another decline to reach 1834.00. Later, the market may form one more ascending structure with the target at 1850.00.
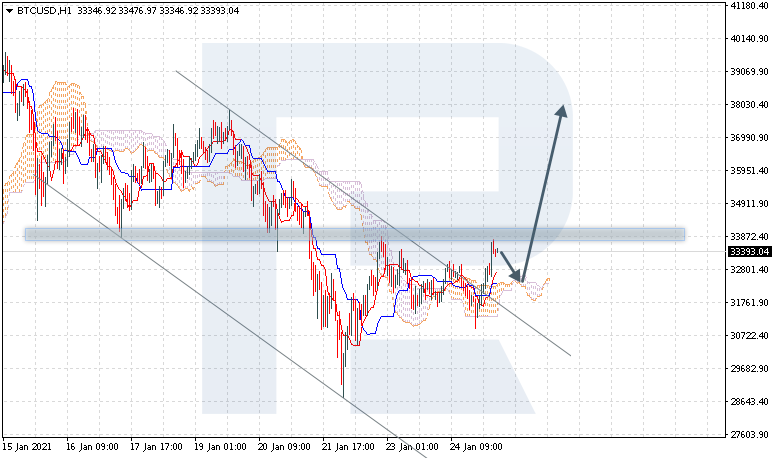
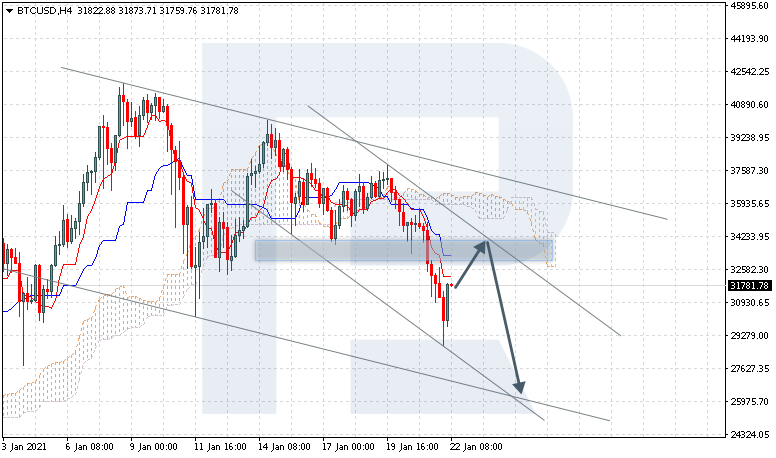
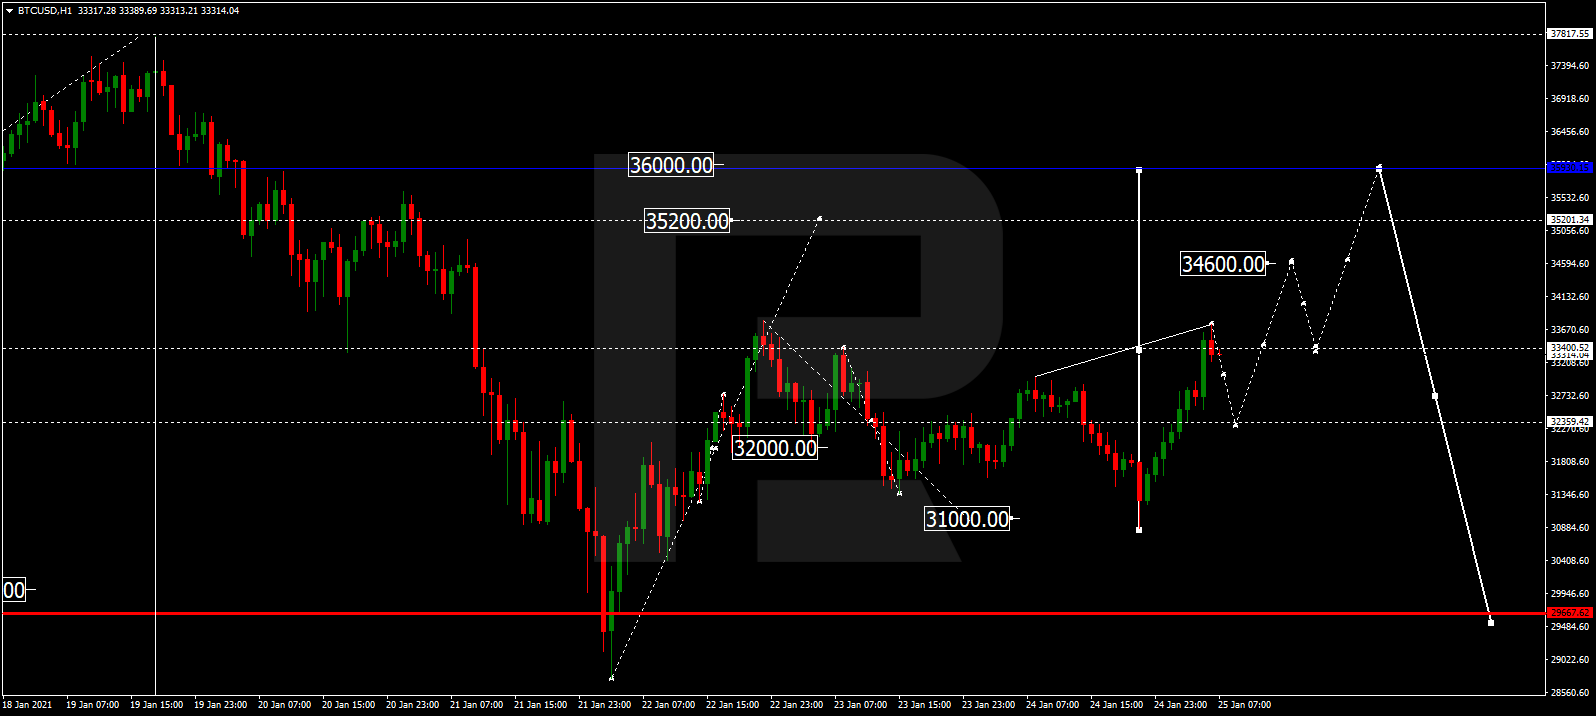
BTCUSD, “Bitcoin vs US Dollar”
After finishing the descending wave at 31000.00, BTCUSD is growing towards 33400.00. After that, the instrument may fall to reach 32300.00 and then form one more ascending structure with the target at 34600.00.
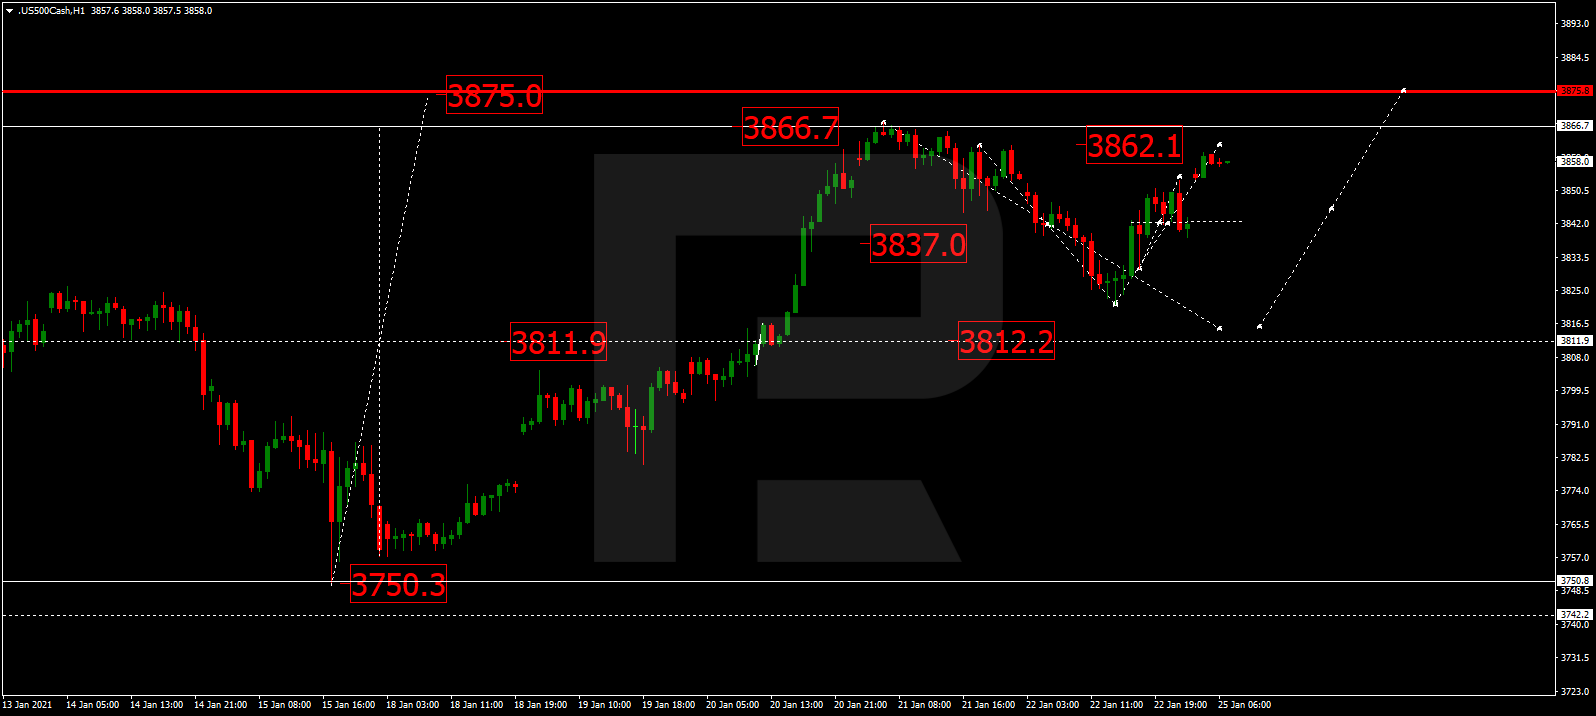
S&P 500
The S&P index is growing towards 3862.1. Later, the market may start another decline to reach 3812.2 and then resume trading upwards with the target at 3875.0.