Fibonacci Retracements Analysis 09.10.2019 (GBPUSD, EURJPY)

09.10.2019

GBPUSD, “Great Britain Pound vs US Dollar”

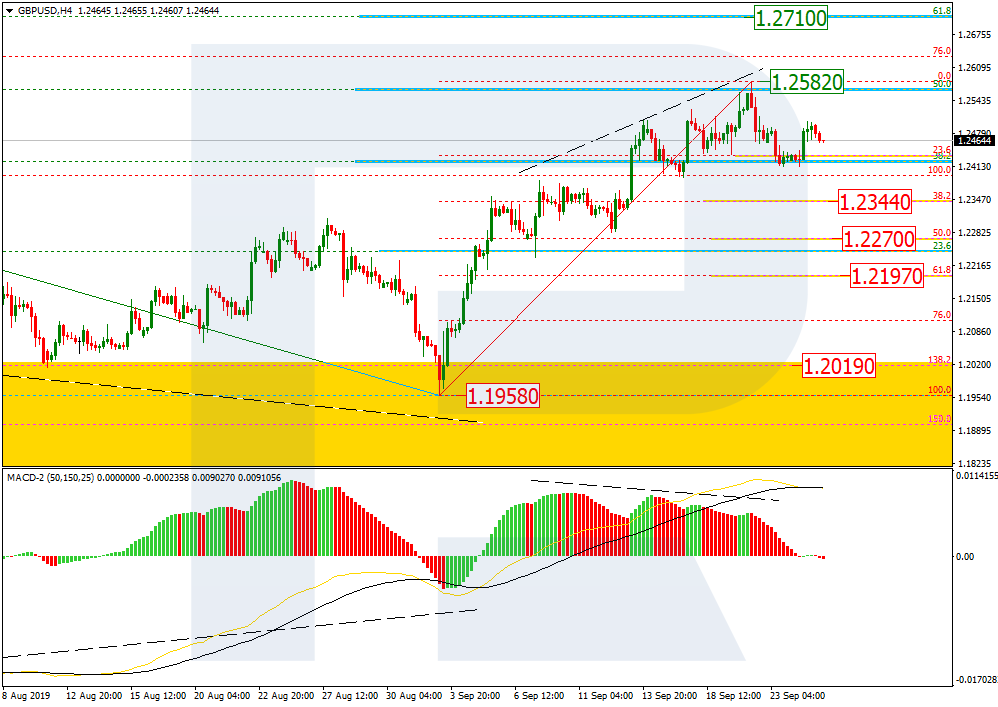
As we can see in the H4 chart, after finishing the short-term correction and updating the local low, GBPUSD has reached 61.8% fibo. The next downside target is 76.0% fibo at 1.2108. If the pair is able to break this level, it may try to test the low at 1.1958 and once again enter the post-correctional extension area between 138.2% and 161.8% fibo at 1.2019 and 1.1788 respectively.

GBPUSD_H4

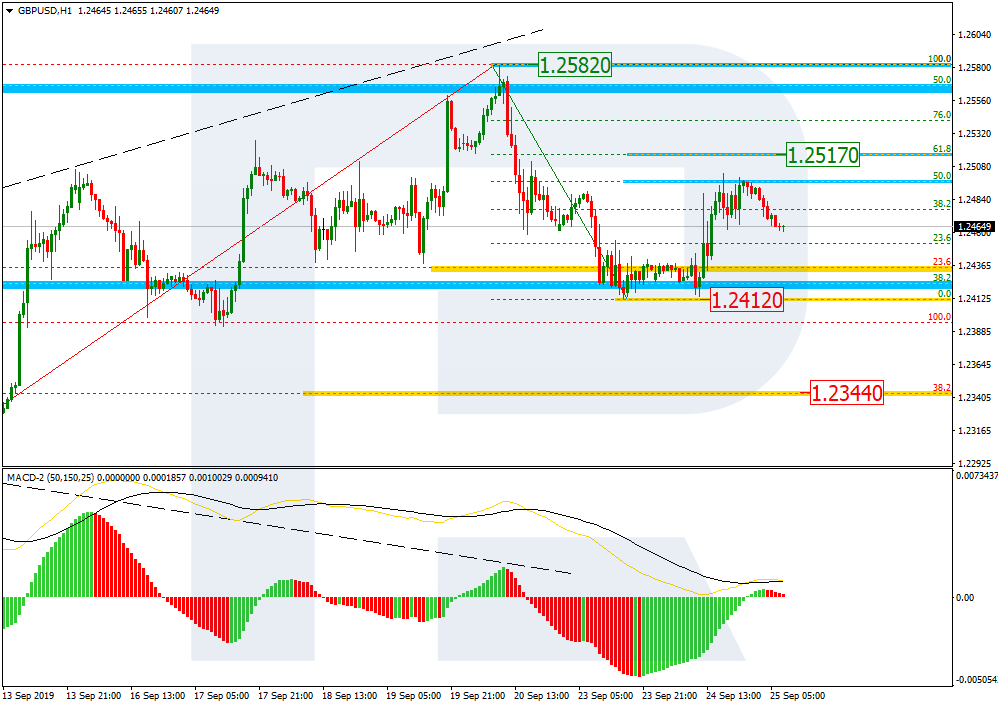
In the H1 chart, the pair is testing 61.8% fibo. Later, the price is expected to fall towards 76.0% fibo at 1.2108.

GBPUSD_H1
Risk Warning: the result of previous trading operations do not guarantee the same results in the future

EURJPY, “Euro vs. Japanese Yen”

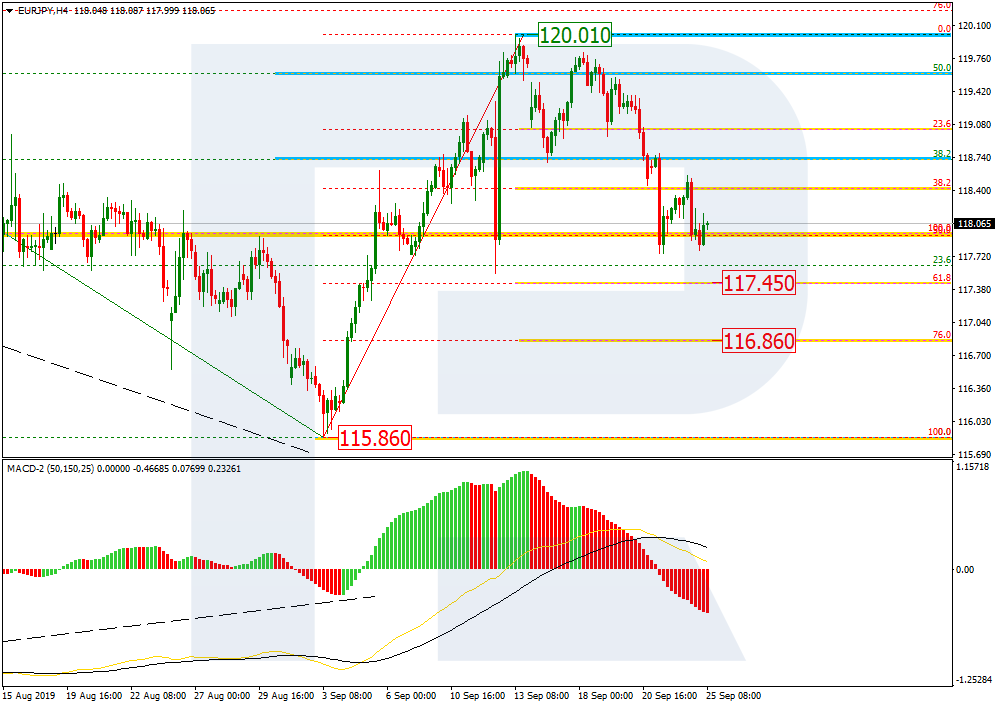
As we can see in the H4 chart, the convergence made EURJPY complete the descending wave at 61.8% fibo. The current situation may be considered as the start of another mid-term rising wave. However, one shouldn’t exclude a possibility of further decline towards 76.0% fibo at 116.86 in the short-term, but the main scenario implies that the price is expected to move upwards. The first rising impulse has already reached 23.6% fibo. After a slight pullback, the impulse may continue towards 38.2%, 50.0%, 61.8%, and 76.0% fibo at 118.19, 118.54, 118.89, and 119.30 respectively. The key target is the high at 120.01.

EURJPY_H4
Risk Warning: the result of previous trading operations do not guarantee the same results in the future

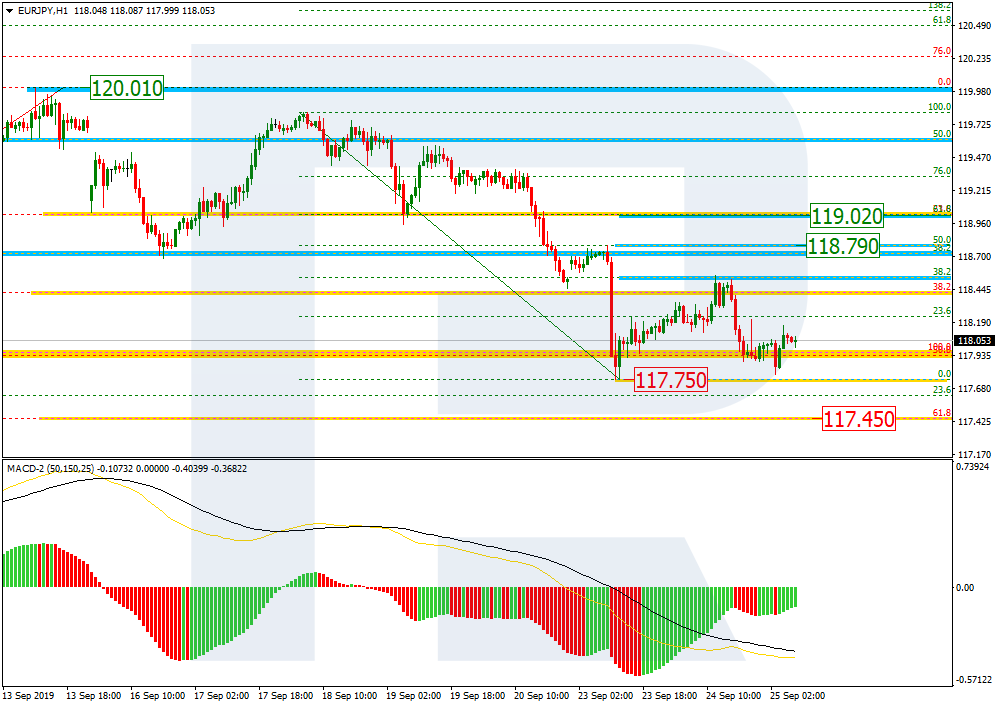
In the H1 chart, the price is falling to reach 23.6% fibo. After breaking the local low at 117.07, the mid-term descending tendency may continue towards 76.0% fibo at 116.86.

EURJPY_H1
Risk Warning: the result of previous trading operations do not guarantee the same results in the future

Fibonacci Retracements Analysis 23.09.2019 (GOLD, USDCHF)

Fibonacci Retracements Analysis 23.09.2019 (GOLD, USDCHF)

23.09.2019

XAUUSD, “Gold vs US Dollar”

As we can see in the H4 chart, after updating the local low, XAUUSD is back to trading inside the previous correctional range. During the correction, the pair has got very close to 50.0% fibo, but may yet continue moving to reach 61.8% and 76.0% fibo at 1528.90 and 1539.25 respectively. However, if the price breaks the low at 1483.49, the instrument may continue the mid-term descending tendency towards 50.0% and 61.8% fibo at 1478.85 and 1460.25 respectively.

GOLD_H4
Risk Warning: the result of previous trading operations do not guarantee the same results in the future

In the H1 chart, after testing 50.0% fibo at 1520.20, the pair may start a new short-term pullback. The targets may be 23.6% and 38.2% fibo at 1511.00 and 1505.75 respectively.

GOLD_H1
Risk Warning: the result of previous trading operations do not guarantee the same results in the future

USDCHF, “US Dollar vs Swiss Franc”

As we can see in the H4 chart, the divergence made the pair reverse after it tested the post-correctional extension area between 138.2% and 161.8% fibo at 0.9980 and 1.0010 respectively. By now, USDCHF has already reached 23.6% fibo and may continue falling towards 38.2%, 50.0%, and 61.8% fibo at 0.9860, 0.9821, and 0.9783 respectively.

USDCHF_H4
Risk Warning: the result of previous trading operations do not guarantee the same results in the future

In the H1 chart, after reaching mid-term 23.6% fibo, USDCHF is correcting and has already reached 50.0% fibo. If the price breaks the local low at 0.9889, the instrument may continue falling.

USDCHF_H1
Risk Warning: the result of previous trading operations do not guarantee the same results in the future

Fibonacci Retracements Analysis 30.09.2019 (GOLD, USDCHF)

30.09.2019

XAUUSD, “Gold vs US Dollar”

As we can see in the H4 chart, after finishing the correctional uptrend at 61.8% fibo, XAUUSD is forming another descending wave. If the price breaks the low at 1483.49, the mid-term descending tendency may continue to reach 50.0%, 61.8%, and 76.0% fibo at 1478.85, 1460.25, and 1438.10 respectively. The key resistance is at 1557.00.

GOLD_H4
Risk Warning: the result of previous trading operations do not guarantee the same results in the future

In the H1 chart, there was a convergence on MACD when the price reached the low, which may indicate a local pullback. After the pair breaks the local low, the short-term target will be the post-correctional extension area between 138.2% and 161.8% fibo at 1463.60 and 1451.50 respectively.

GOLD_H1
Risk Warning: the result of previous trading operations do not guarantee the same results in the future

USDCHF, “US Dollar vs Swiss Franc”

As we can see in the H4 chart, the pair is about to complete the correctional uptrend and may start a new descending wave towards 50.0%, 61.8%б and 76.0% fibo at 0.9821, 0.9783, and 0.9737 respectively. However, if the instrument breaks the high at 0.9983, it may continue growing to reach the post-correctional extension area between 138.2% and 161.8% fibo at 0.9980 and 1.0010 respectively.

USDCHF_H4
Risk Warning: the result of previous trading operations do not guarantee the same results in the future

In the H1 chart, the divergence made the pair complete the ascending wave and start a new decline, which has already reached 50.0% fibo at 0.9897. In the future, the price may continue falling towards 61.8% and 76.0% fibo at 0.9884 and 0.9869 respectively, and the low at 0.9844. The resistance is at 0.9949.

USDCHF_H1
Risk Warning: the result of previous trading operations do not guarantee the same results in the future

Fibonacci Retracements Analysis 26.09.2019 (AUDUSD, USDCAD)

26.09.2019

AUDUSD, “Australian Dollar vs US Dollar”

As we can see in the H4 chart, the current descending wave after the divergence has almost reached 76.0% fibo at 0.6737. The stable descending movement along with MACD lines indicate at further decline to reach and break the key low at 0.6677. At the same time, a local convergence on the Oscillator may hint at another pullback or even a new rising impulse towards 61.8% fibo at 0.6927.

AUDUSD_H4
Risk Warning: the result of previous trading operations do not guarantee the same results in the future

Taking into account the convergence on MACD in the H1 chart, we may assume that AUDUSD may correct towards 23.6%, 38.2%, 50.0%, and 61.8% fibo at 0.6776, 0.6799, 0.6817, and 0.6835 respectively. The support is the low at 0.6737.

AUDUSD_H1
Risk Warning: the result of previous trading operations do not guarantee the same results in the future

USDCAD, “US Dollar vs Canadian Dollar”

As we can see in the H4 chart, after finishing the ascending impulse, USDCAD has started a new correction, which may later transform into a new descending wave towards mid-term 76.0% fibo at 1.3103. However, if the correction breaks the local high at 1.3310, the instrument may continue growing to reach 1.3382.

USDCAD_H4
Risk Warning: the result of previous trading operations do not guarantee the same results in the future

In the H1 chart, the divergence on MACD made the pair start a new decline, which has already reached 38.2% fibo. In the future, the price may continue falling towards 50.0%, 61.8%, and 76.0% fibo at 1.3222, 1.3201, and 1.3177 respectively. The resistance is the high at 1.3310.

USDCAD_H1
Risk Warning: the result of previous trading operations do not guarantee the same results in the future

Fibonacci Retracements Analysis 25.09.2019 (GBPUSD, EURJPY)

25.09.2019

GBPUSD, “Great Britain Pound vs US Dollar”

As we can see in the H4 chart, there was a divergence on MACD, which made the pair start a new descending tendency after reaching 50.0% fibo. GBPUSD is slowly falling to reach 23.6% fibo, but a local ascending impulse hints at a new growth towards the high at 1.2518 and then mid-term 61.8% fibo at 1.2710. However, the key scenario implies further decline towards 38.2%, 50.0%, and 61.8% fibo at 1.2344, 1.2270, and 1.2197 respectively.

GBPUSD_H4
Risk Warning: the result of previous trading operations do not guarantee the same results in the future

In the H1 chart, the pair is forming a new short-term correction after finishing another descending impulse. By now, the pullback has already reached 50.0% fibo and may yet continue towards 61.8% fibo at 1.2517. If the price breaks the local low at 1.2412, the mid-term decline may continue.

GBPUSD_H1
Risk Warning: the result of previous trading operations do not guarantee the same results in the future

EURJPY, “Euro vs. Japanese Yen”

As we can see in the H4 chart, after completing the correctional uptrend at 50.0% fibo, EURJPY is quickly trading downwards. By now, it has already reached 50.0% fibo. After finishing a short-term correction, the price may continue falling towards 61.8% and 76.0% fibo at 117.45 and 116.86 respectively. The key support is the low at 115.86.

EURJPY_H4
Risk Warning: the result of previous trading operations do not guarantee the same results in the future

In the H1 chart, the price is correcting upwards and has already reached 38.2% fibo. The next correctional wave may be heading towards 50.0% and 61.8% fibo at 118.79 and 119.02 respectively. The support is the low at 117.75.

EURJPY_H1
Risk Warning: the result of previous trading operations do not guarantee the same results in the future

Back to listAttention!

Forecasts presented in this section only reflect the author’s private opinion and should not be considered as guidance for trading. RoboForex bears no responsibility for trading results based on trading recommendations described in these analytical reviews.

Fibonacci Retracements Analysis 17.09.2019 (EURUSD, USDJPY)

17.09.2019

EURUSD, “Euro vs US Dollar”

As we can see in the H4 chart, after reaching the post-correctional extension area between 138.2% and 161.8% fibo at 1.0942 and 1.0889 respectively again, EURUSD tried to grow and reach 61.8% fibo at 1.1126, but unsuccessfully. The current decline may be considered as a descending correction. The structure of this correction indicates uncertainty among investors, “turbulence” on the market, and a possibility of further expansion of the range, but the descending tendency is not over yet. Hence, the correction may yet continue to reach 61.8% and 76.0% fibo at 1.1126 and 1.1172 respectively in the short-term, but the key long-term targets are below the lows.

EURUSD_H4
Risk Warning: the result of previous trading operations do not guarantee the same results in the future

In the H1 chart, the local correction has reached 61.8% fibo, but the decline may yet continue towards 76.0% fibo at 1.0971. Later, the instrument may start a new rising impulse to reach the high at 1.1109.

EURUSD_H1
Risk Warning: the result of previous trading operations do not guarantee the same results in the future

USDJPY, “US Dollar vs. Japanese Yen”

As we can see in the H4 chart, the correctional uptrend continues; it has almost reached 50.0% fibo at 108.42. At the same time, there is a divergence on MACD, which indicates a possible short-term pullback towards 38.2% fibo at 107.48. After the correction, USDJPY may resume moving upwards to reach 61.8% fibo at 109.37.

USDJPY_H4
Risk Warning: the result of previous trading operations do not guarantee the same results in the future

In the H1 chart, there is a divergence on MACD within the uptrend, so we may try to define possible targets of the oncoming pullback. In case of the correctional downtrend, they may be 23.6%, 38.2%, and 50.0% fibo at 107.75, 107.36, and 107.06 respectively.

USDJPY_H1
Risk Warning: the result of previous trading operations do not guarantee the same results in the future

Back to listAttention!

Forecasts presented in this section only reflect the author’s private opinion and should not be considered as guidance for trading. RoboForex bears no responsibility for trading results based on trading recommendations described in these analytical reviews.

Fibonacci Retracements Analysis 16.09.2019 (GOLD, USDCHF)

16.09.2019

XAUUSD, “Gold vs US Dollar”

As we can see in the H4 chart, after reaching 38.2% fibo, XAUUSD has returned to 23.6% fibo. The current movement may be considered as a short-term correction before a new descending wave. The next downside targets may be 50.0%, 61.8%, and 76.0% fibo at 1478.60, 1460.25, and 1438.20 respectively. The key resistance is the high at 1557.00.

GOLD_H4
Risk Warning: the result of previous trading operations do not guarantee the same results in the future

In the H1 chart, the convergence made the pair start a new pullback to the upside, which has already reached 50.0% fibo. The next upside targets may be 61.8% and 76.0% fibo at 1529.35 and 1539.60 respectively. The key support is the low at 1484.38.

GOLD_H1
Risk Warning: the result of previous trading operations do not guarantee the same results in the future

USDCHF, “US Dollar vs Swiss Franc”

As we can see in the H4 chart, the correctional uptrend has already reached 50.0% fibo. At the same time, there is a divergence on MACD, which may indicates a new descending wave. However, as long as the price doesn’t break the support at 0.9797, USDCHF is expected to continue growing towards the post-correctional extension area between 138.2% and 161.8% fibo at 0.9980 and 1.0010 respectively, as well as 61.8% fibo at 1.0016.

USDCHF_H4
Risk Warning: the result of previous trading operations do not guarantee the same results in the future

In the H1 chart, after reaching 61.8% fibo, USDCHF is correcting upwards. As long as the indicator lines are directed to the downside, one shouldn’t exclude a possibility that the price may fall to reach 76.0% fibo at 09833, while the rising impulse will be heading towards 0.9947.

USDCHF_H1
Risk Warning: the result of previous trading operations do not guarantee the same results in the future

Back to listAttention!

Forecasts presented in this section only reflect the author’s private opinion and should not be considered as guidance for trading. RoboForex bears no responsibility for trading results based on trading recommendations described in these analytical reviews.

Fibonacci Retracements Analysis 30.08.2019 (BITCOIN, ETHEREUM)

30.08.2019

BTCUSD, “Bitcoin vs US Dollar”

As we can see in the daily chart, after testing 38.2% fibo, BTCUSD has formed a new descending impulse and broken its local lows. In the future, the instrument may continue falling towards 50.0% and 61.8% fibo at 8600.00 and 7350.00 respectively. The resistance is 23.6% fibo at 11350.00.

BITCOIN
Risk Warning: the result of previous trading operations do not guarantee the same results in the future

In the H4 chart, the pair is trading towards 50.0% fibo. At the same time, there is a local convergence on MACD Oscillator, which may indicate a possible pullback.

BTCUSD
Risk Warning: the result of previous trading operations do not guarantee the same results in the future

ETHUSD, “Ethereum vs. US Dollar”

As we can see in the daily chart, ETHUSD has completed another descending impulse and reached 76.0% fibo. After breaking this level and fixing below it, the pair may continue falling towards 100.03. At the same time, there is a convergence on MACD, which may indicate a new pullback. The resistance is 50.0% fibo at 231.50, which may be the target of the correction.

ETHEREUM
Risk Warning: the result of previous trading operations do not guarantee the same results in the future

In the H4 chart, the instrument is heading towards 76.0% fibo to test it. At the same time, there is a convergence, which may indicate a short-term correction towards the local resistance at 61.8% fibo at 200.55.

ETHUSD
Risk Warning: the result of previous trading operations do not guarantee the same results in the future

Back to listAttention!

Forecasts presented in this section only reflect the author’s private opinion and should not be considered as guidance for trading. RoboForex bears no responsibility for trading results based on trading recommendations described in these analytical reviews.

Fibonacci Retracements Analysis 02.09.2019 (GOLD, USDCHF)

02.09.2019

XAUUSD, “Gold vs US Dollar”

As we can see in the H4 chart, after completing the rising impulse, XAUUSD has started the correction to the downside, but the uptrend yet continues. After breaking the current high, the pair may continue trading upwards to reach 61.8% fibo at 1616.00. At the same time, there is a divergence within the uptrend on MACD, which may indicate a possible mid-term descending correction with the targets at 23.6%, 38.2%, and 50.0% fibo at 1487.00, 1444.60, and 1410.80 respectively.

GOLD_H4
Risk Warning: the result of previous trading operations do not guarantee the same results in the future

As we can see in the H1 chart, the correctional downtrend has reached 61.8% fibo. The next downside target may be 76.0% fibo at 1508.20. However, there is a local convergence, which may indicate a new growth towards the high at 1554.99

GOLD_H1
Risk Warning: the result of previous trading operations do not guarantee the same results in the future

USDCHF, “US Dollar vs Swiss Franc”

It would be better to analyze USDCHF on the daily chart. As we can see, the convergence made the pair reverse and start a new uptrend, which has already reached 38.2% fibo and may yet continue towards 50.0% and 61.8% fibo at 0.9984 and 1.0016 respectively. The support is the low at 0.9660.

USDCHF_D1
Risk Warning: the result of previous trading operations do not guarantee the same results in the future

The H4 chart shows more detailed structure of the current rising correction. USDCHF is correcting to reach 50.0% fibo at 0.9948. At the same time, there is a divergence, which may indicate a possible pullback.

USDCHF_H4
Risk Warning: the result of previous trading operations do not guarantee the same results in the future

Back to listAttention!

Forecasts presented in this section only reflect the author’s private opinion and should not be considered as guidance for trading. RoboForex bears no responsibility for trading results based on trading recommendations described in these analytical reviews.

Fibonacci Retracements Analysis 03.09.2019 (EURUSD, USDJPY)

03.09.2019

EURUSD, “Euro vs US Dollar”

As we can see in the H4 chart, after finishing the short-term pullback, EURUSD is forming a new descending impulse. It seems as if the previous low at 1.1027 couldn’t provide enough resistance to bears and now acts as the resistance for bulls. After breaking the previous low, the instrument continue falling towards the post-correctional extension area between 138.2% and 161.8% fibo at 1.0942 and 1.0889 respectively.

EURUSD_H4
Risk Warning: the result of previous trading operations do not guarantee the same results in the future

In the H1 chart, there is a convergence within the downtrend on MACD, which may indicate a possible pullback. The upside correctional targets may be 23.6%, 38.2%, and 50.0% fibo at 1.0955, 1.0994, and 1.1027 respectively.

EURUSD_H1
Risk Warning: the result of previous trading operations do not guarantee the same results in the future

USDJPY, “US Dollar vs. Japanese Yen”

As we can see in the H4 chart, USDJPY is testing 23.6% fibo. In the future, the correctional uptrend may continue towards 38.2%, 50.0%, and 61.8% fibo at 107.48, 108.42, and 109.37 respectively. The support is at 104.45.

USDJPY_H4
Risk Warning: the result of previous trading operations do not guarantee the same results in the future

In the H1 chart, USDJPY is correcting downwards and has already reached 23.6% fibo. In the future, the correction may continue towards 38.2% and 50.0% fibo at 105.83 and 105.56 respectively. If the price breaks the high at 106.68, the instrument may resume trading upwards.

USDJPY_H1
Risk Warning: the result of previous trading operations do not guarantee the same results in the future

Back to listAttention!

Forecasts presented in this section only reflect the author’s private opinion and should not be considered as guidance for trading. RoboForex bears no responsibility for trading results based on trading recommendations described in these analytical reviews.