Fibonacci Retracements Analysis 10.01.2020 (BITCOIN, ETHEREUM)
BTCUSD, “Bitcoin vs US Dollar”
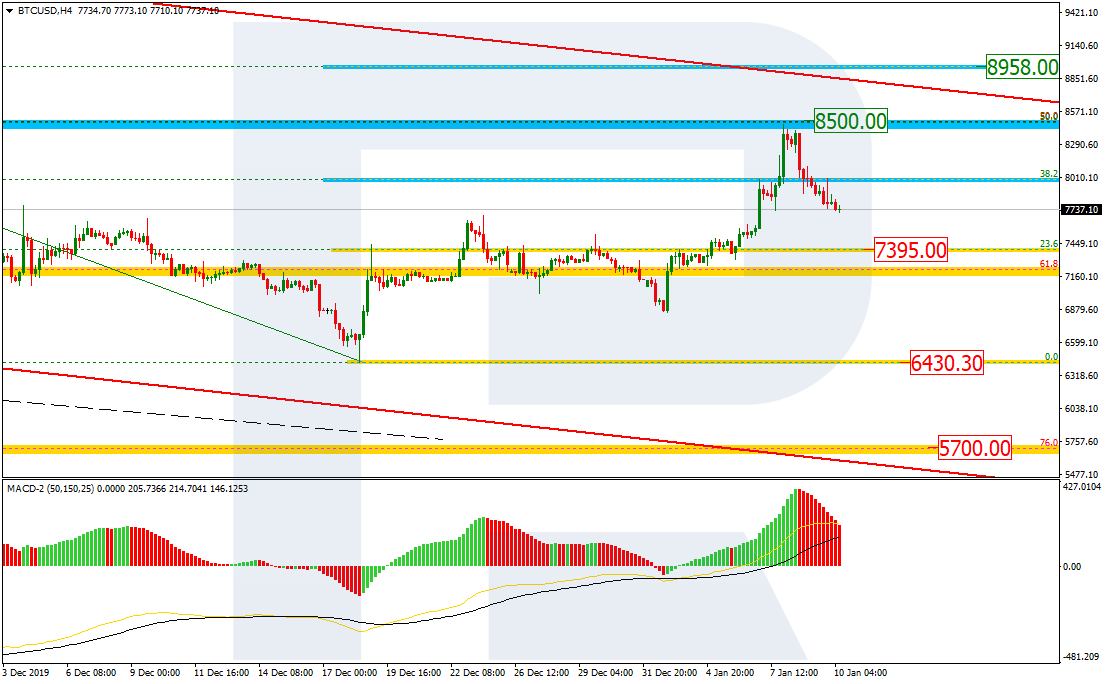
As we can see in the daily chart, BTCUSD has finished the correctional uptrend at the long-term resistance, which is 50.0% fibo at 8500.00. However, we shouldn’t exclude further growth towards 61.8% at 8958.00, but only after a short-term decline, because “Golden Cross” on MACD has been formed very recently. Still, the main scenario implies that the instrument is expected to start a new descending wave to reach the low at 6430.30 and then mid-term 76.0% fibo at 5700.00.


In the H4 chart, the pair is correcting towards the local support, which is 23.6% fibo at 7395.00. If the price rebounds, it may start a new impulse to reach 61.8% fibo at 8958.00. Later, BTCUSD may break this level and fix below it. In this case, the instrument may continue falling to attack the low.
ETHUSD, “Ethereum vs. US Dollar”
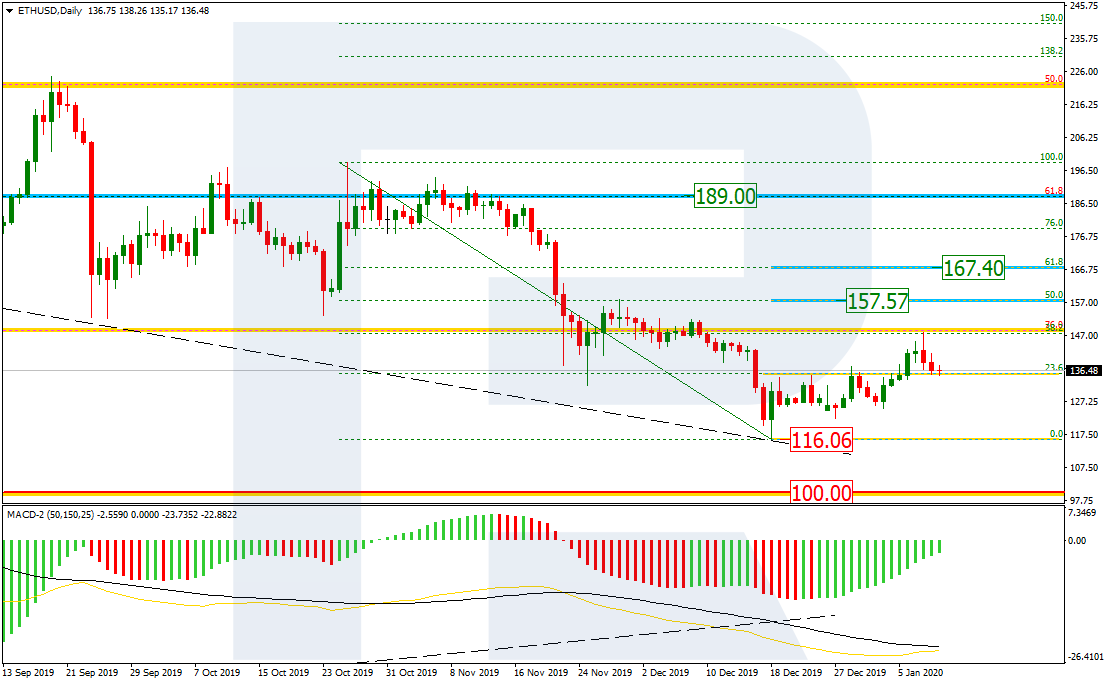
As we can see in the daily chart, the correctional uptrend has stopped at 38.2% fibo. According to the main scenario, the price is expected to fall and reach the low at 116.06, but the next rising wave may head towards 50.0% and 61.8% fibo at 157.57 and 167.40 respectively.
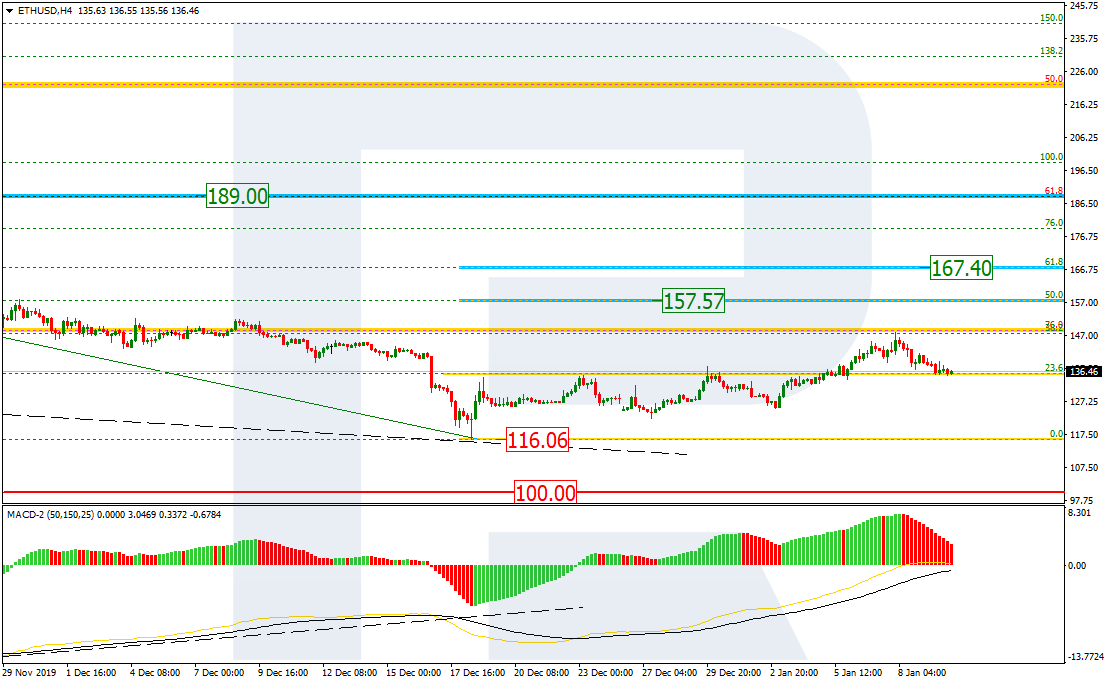
The H4 chart shows that after reaching 38.2% fibo, the price has started a new decline. MACD indicates further growth after a short-term decline.