Fibonacci Retracements Analysis 10.04.2020 (BITCOIN, ETHEREUM)
BTCUSD, “Bitcoin vs US Dollar”
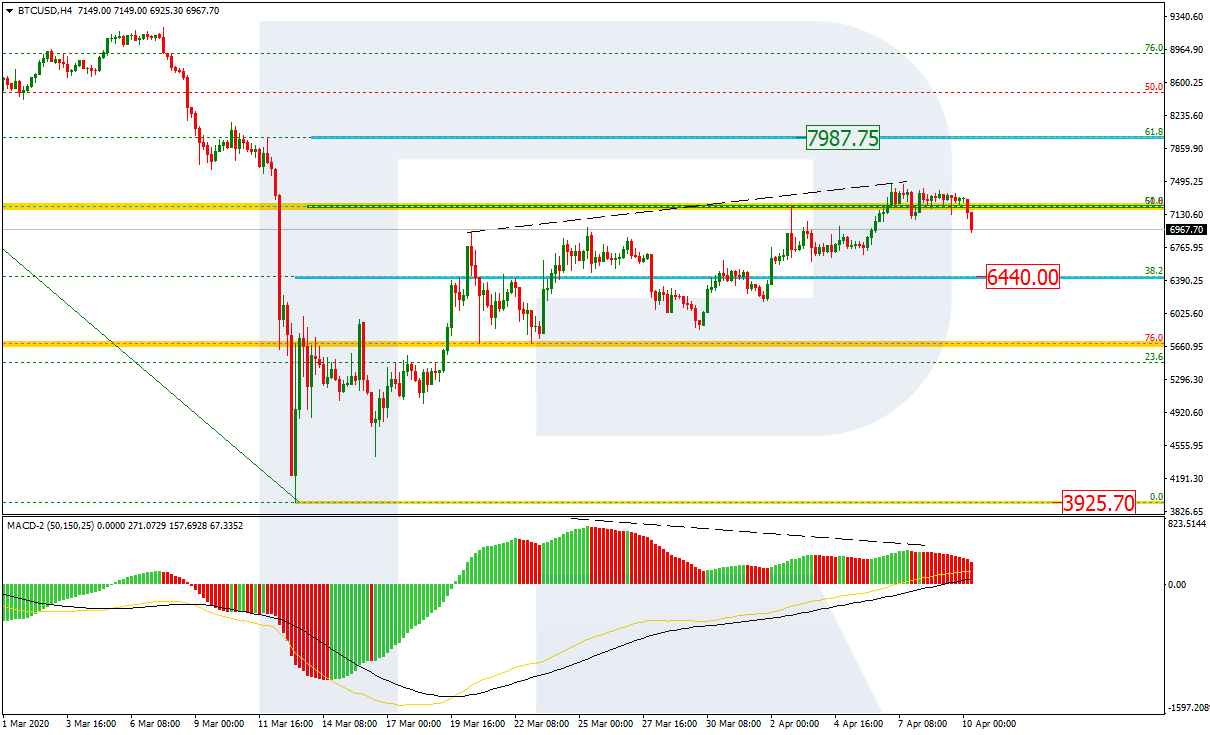
As we can see in the H4 chart, BTCUSD has completed the correction at 50.0% fibo. Another signal to confirm a reversal is a divergence on MACD. However, as long as there is no “Black Cross” and the pair doesn’t break the support at 6440.00, there might be a possibility of further growth towards 61.8% fibo at 7987.50. Still, after breaking the current support, the instrument may continue trading downwards to reach the low at 3929.70.

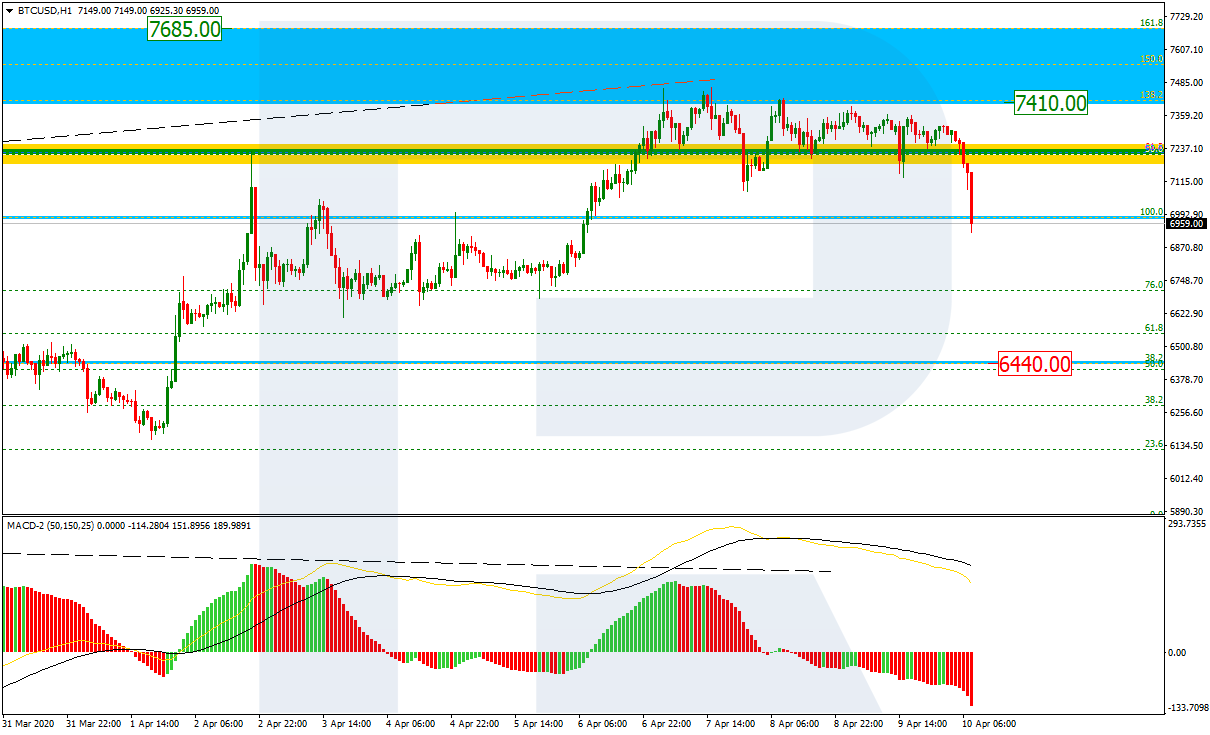
In the H1 chart, the previous rising only “touched” the post-correctional extension area between 138.2% and 161.8% fibo at 7410.00 and 7685.00 respectively, but couldn’t go any further. After the divergence, the instrument started a new decline towards the support at 38.2% fibo (6440.00).
ETHUSD, “Ethereum vs. US Dollar”
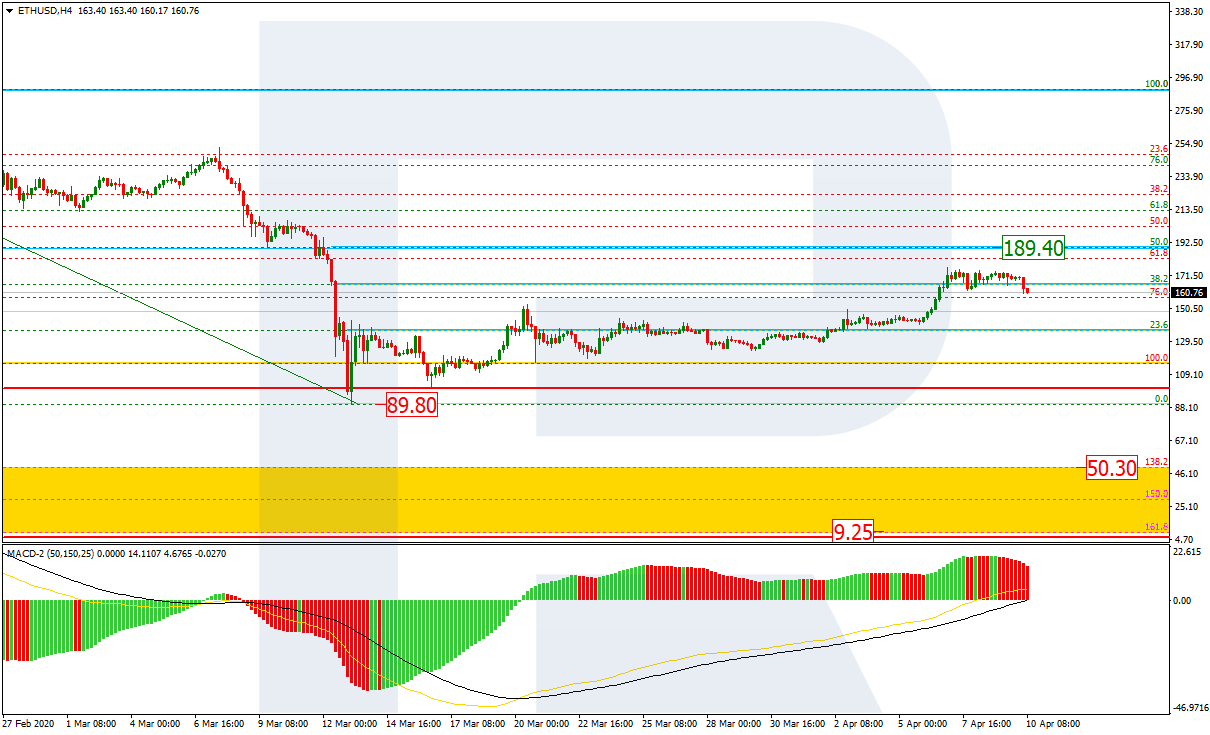
As we can see in the H4 chart, after reaching 38.2% fibo, ETHUSD is starting a new decline. However, it’s too early to call this decline a reversal, because the price may yet grow towards 50.0% fibo at 189.40. If the pair does reverse, the first downside target will be the low at 89.90. After breaking the low, the pair may fall to reach the post-correctional extension area between 138.2% and 161.8% fibo at 50.30 and 9.25 respectively.
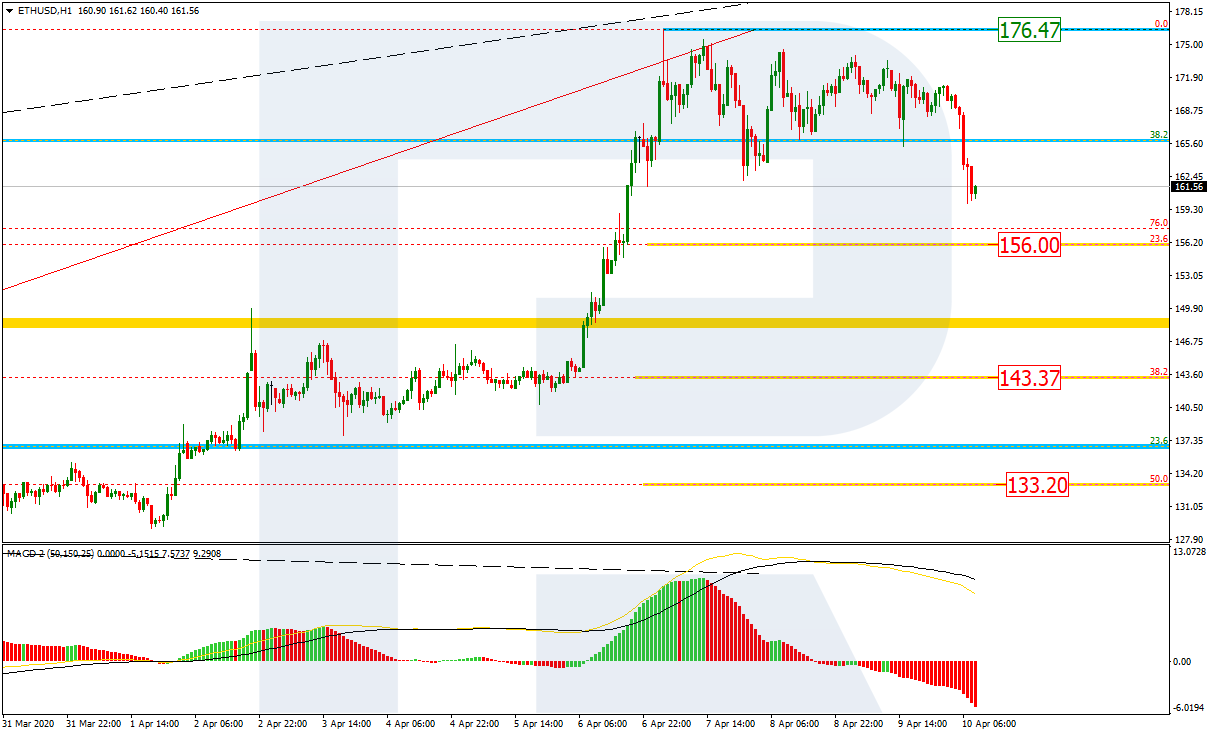
The H1 chart shows a new decline after the divergence. The downside targets may be 23.6%, 38.2%, and 50.0% fibo at 156.00, 143.37, and 133.20 respectively.