Fibonacci Retracements Analysis 12.02.2021 (BITCOIN, ETHEREUM)
BTCUSD, “Bitcoin vs US Dollar”
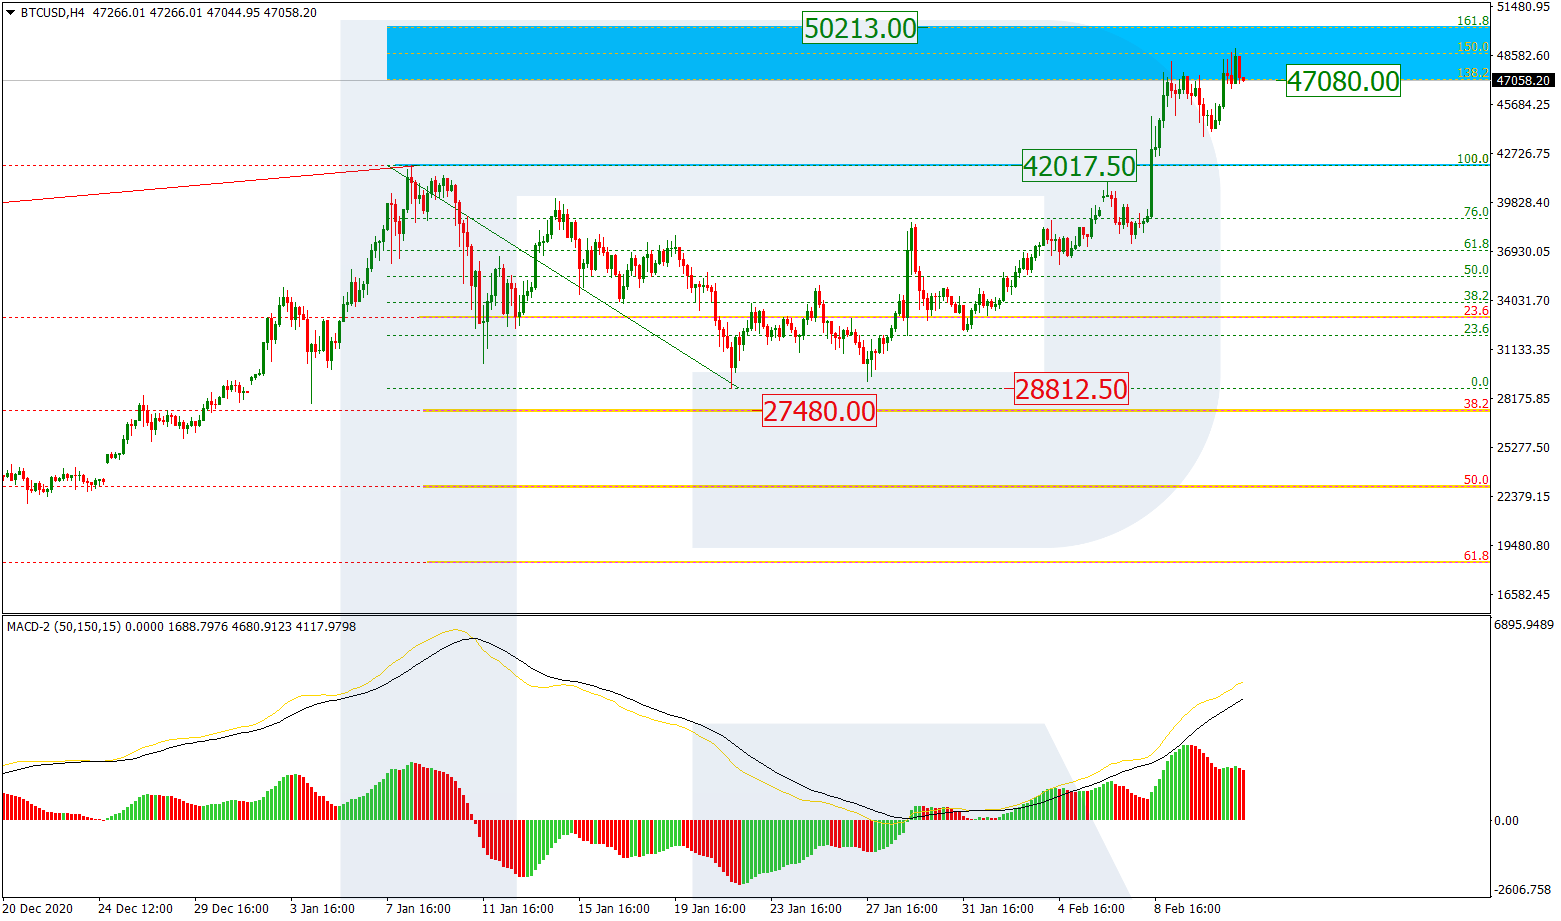
As we can see in the H4 chart, after failing to reach 38.2%, the descending correction transformed into a new rising wave, which, after breaking the previous high, has already entered the post-correctional extension area between 138.2% and 161.8% fibo at 47080.00 and 50213.00 respectively. At the same time, there is a divergence on MACD, which may hint at a new pullback to the downside.

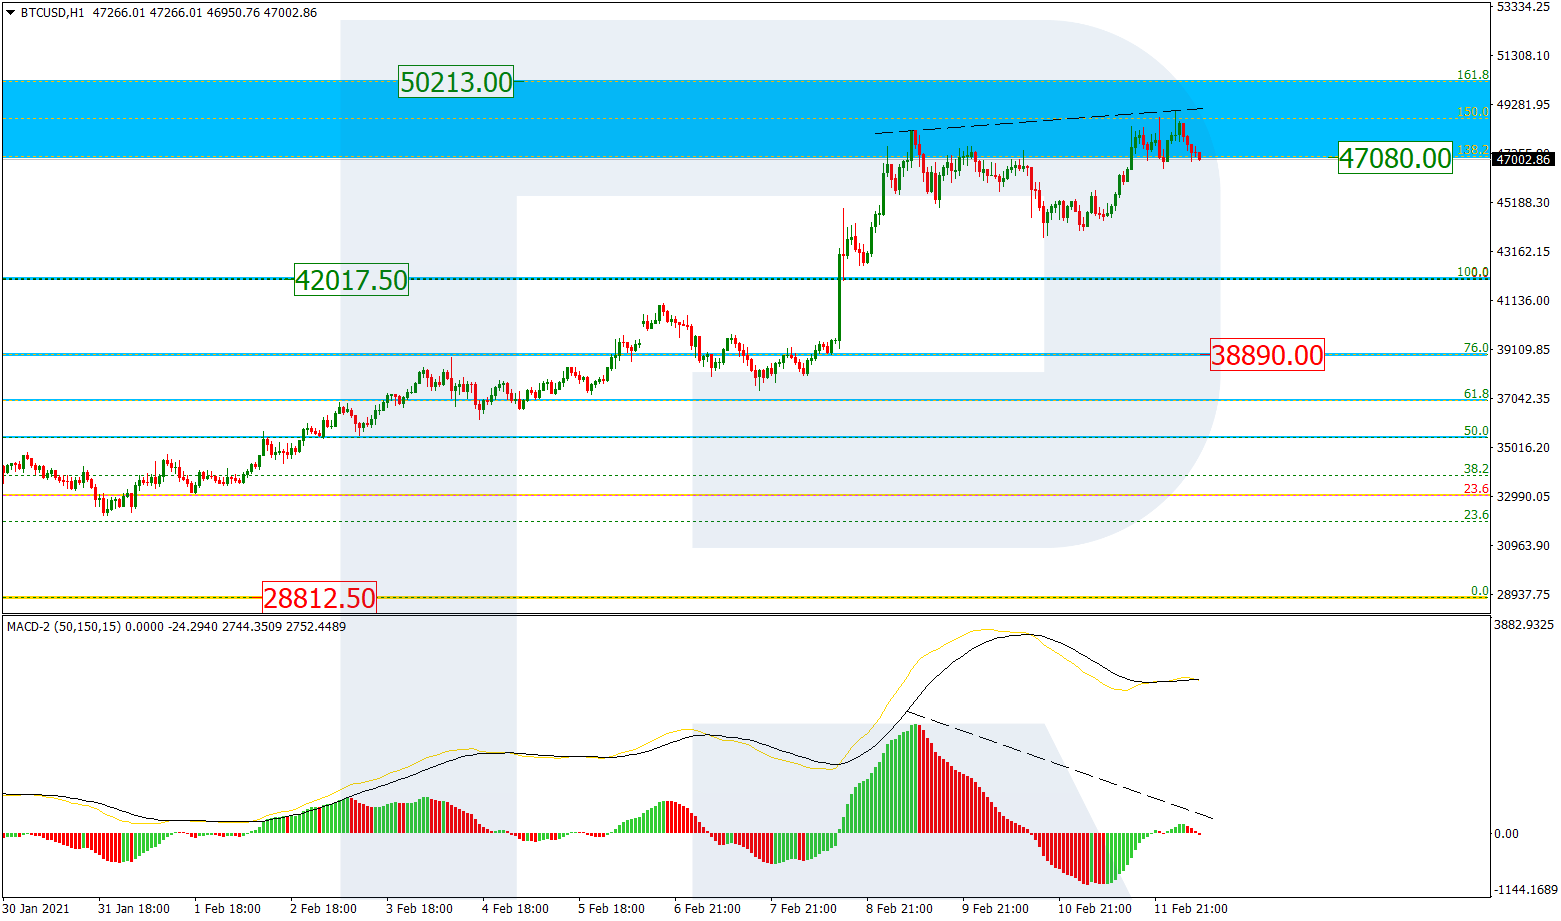
The H1 chart shows a local divergence within the post-correctional extension area between 138.2% and 161.8% fibo at 47080.00 and 50213.00 respectively. The correctional downtrend may reach the previous high at 42017.50 or even 76.0% fibo at 38890.00.
ETHUSD, “Ethereum vs. US Dollar”
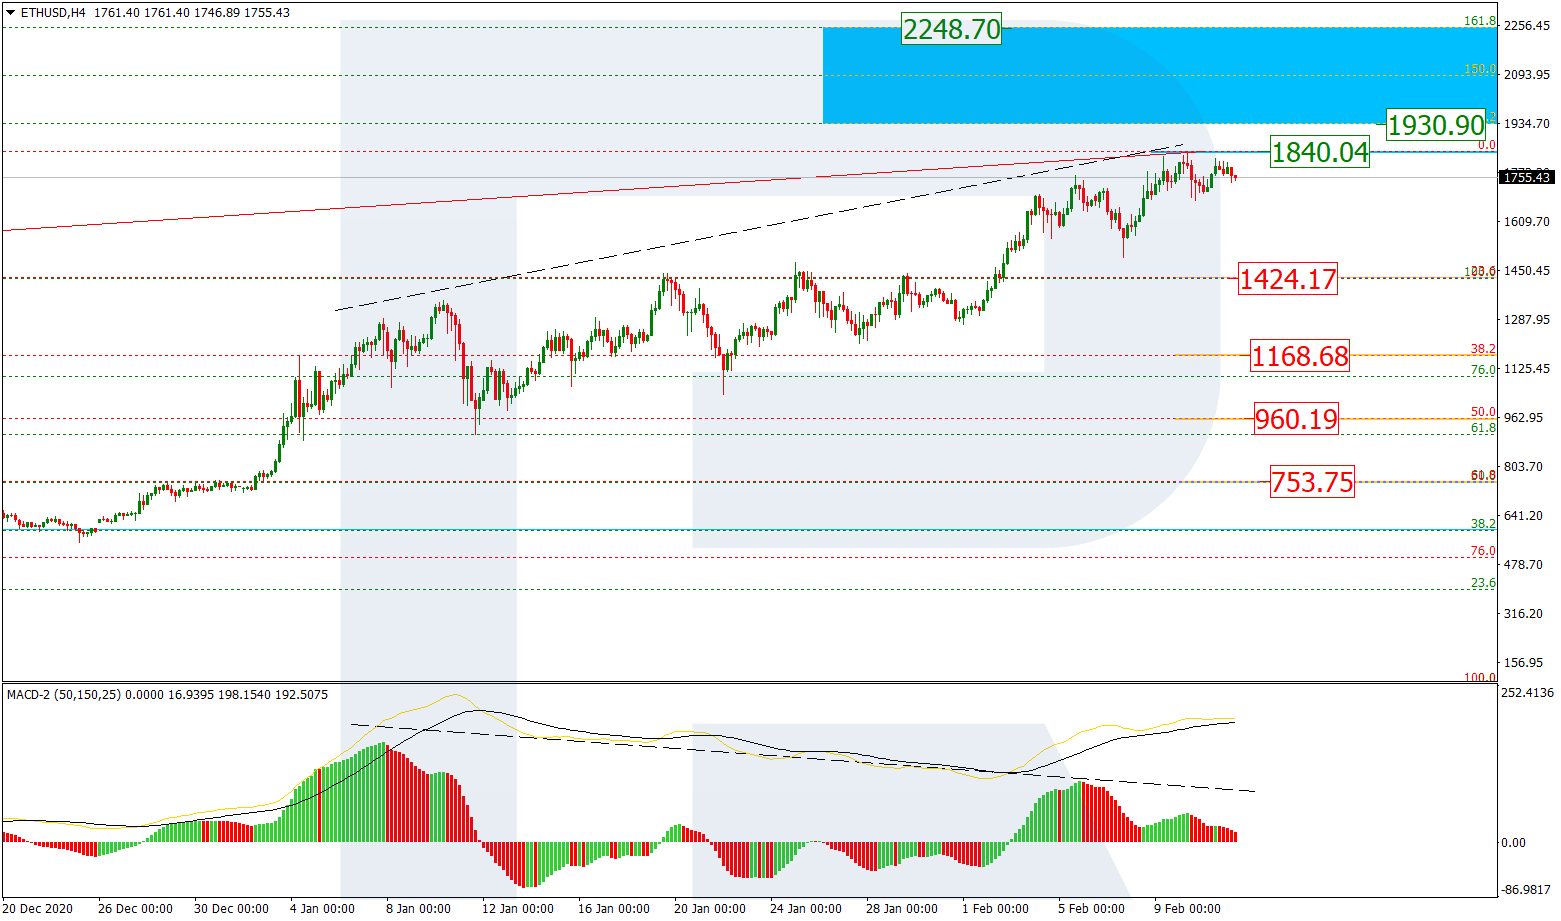
The H4 chart shows a stable uptrend, which may break the high at 1840.04 and then reach the post-correctional extension area between 138.2% and 161.8% fibo at 1930.90 and 2248.70 respectively. However, there is a divergence on MACD, which may hint at a new short-term correction to reach 23.6%, 38.2%, 50.0%, and 61.8% fibo at 1424.17, 1168.68, 960.19, and 753.75 respectively.
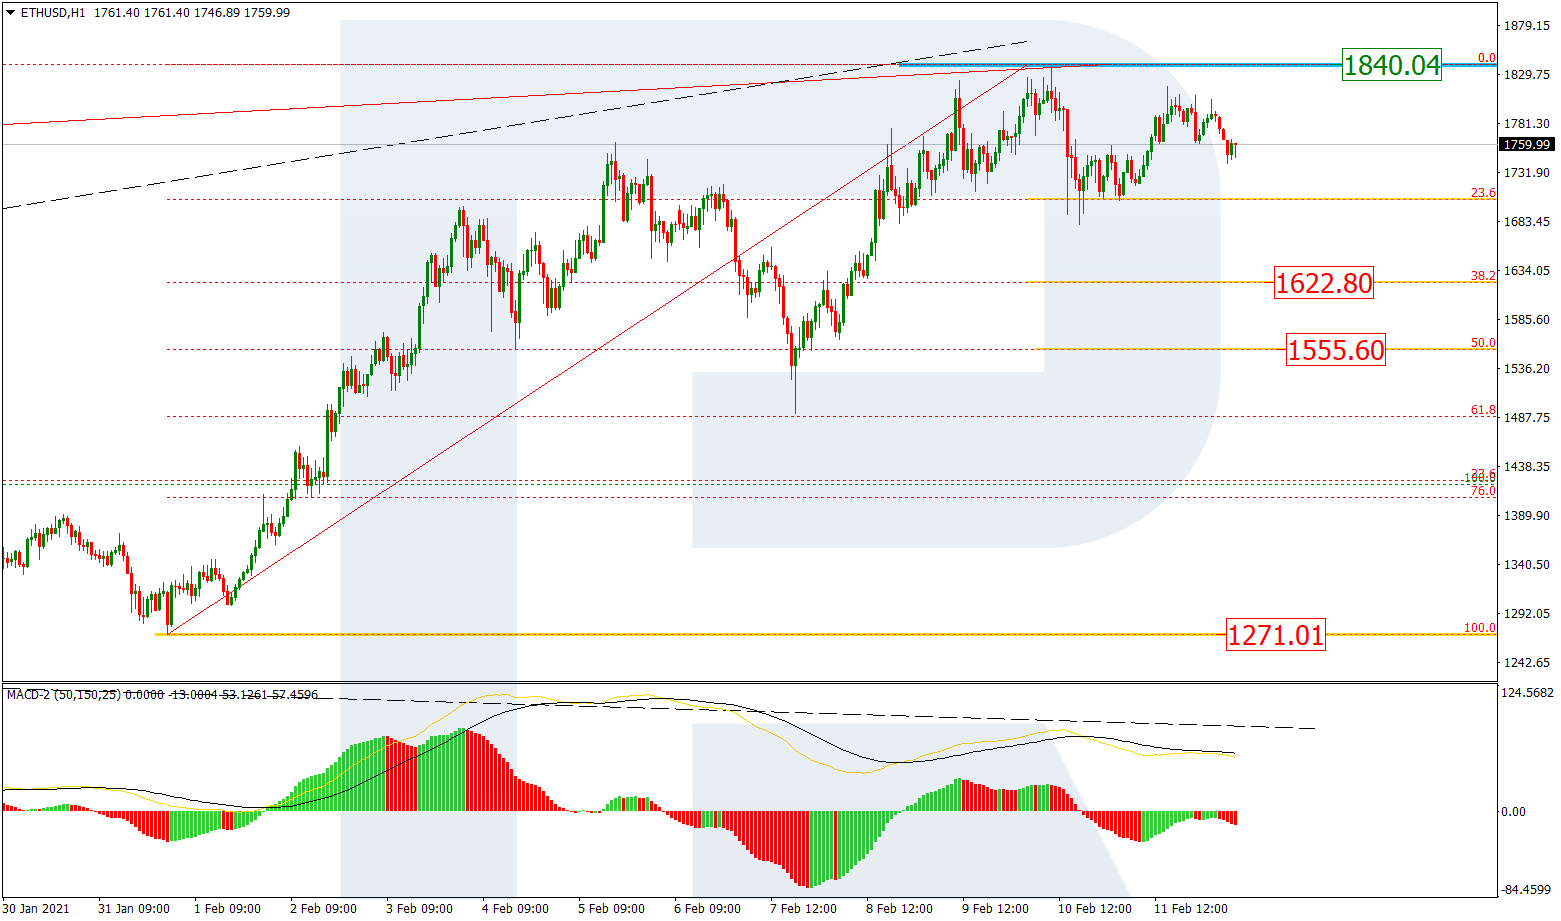
As we can see in the H1 chart, the pair is correcting after completing the ascending wave and has already reached 23.6% fibo. Later, the price may continue falling towards 38.2% and 50.0% fibo at 1622.80 and 1555.60 respectively. At the same time, a breakout of the local low at 1207.60 may hint at a further mid-term downtrend.