Fibonacci Retracements Analysis 17.03.2020 (EURUSD, USDJPY)
EURUSD, “Euro vs US Dollar”
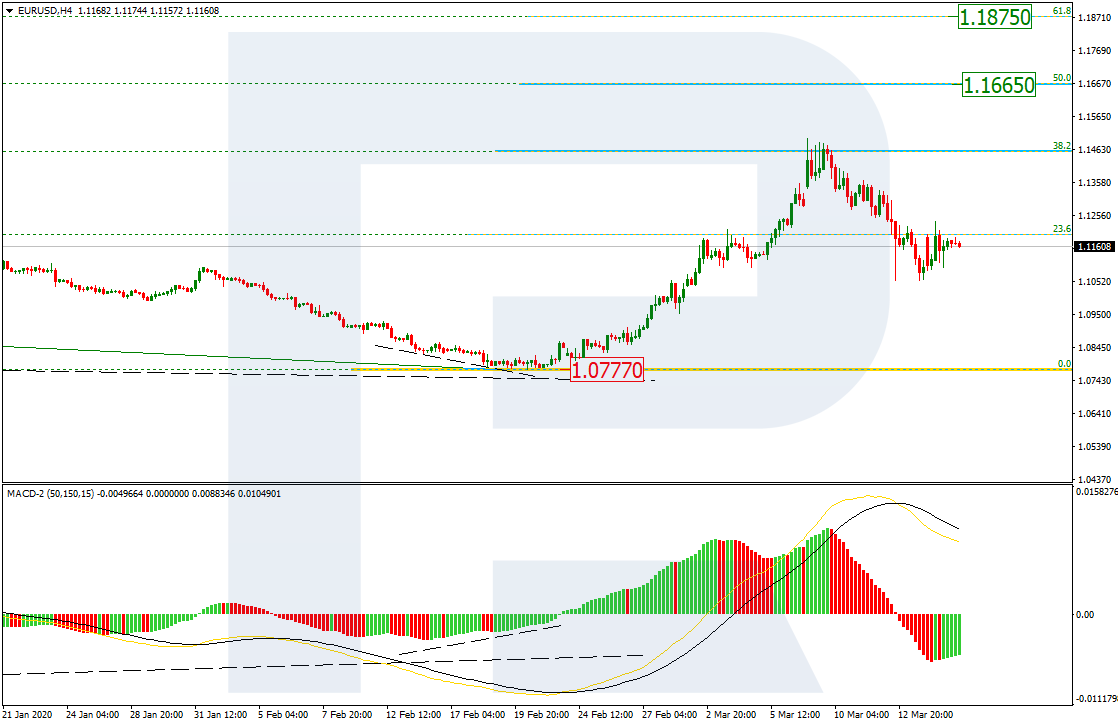
As we can see in the H4 chart, after reaching 38.2% fibo, EURUSD has started a new correction to the downside. If the pair fails to break the low at 1.0777, the next rising wave may reach 50.0% and 61.8% fibo at 1.1665 and 1.1875 respectively. The key support is the low at 1.0777.

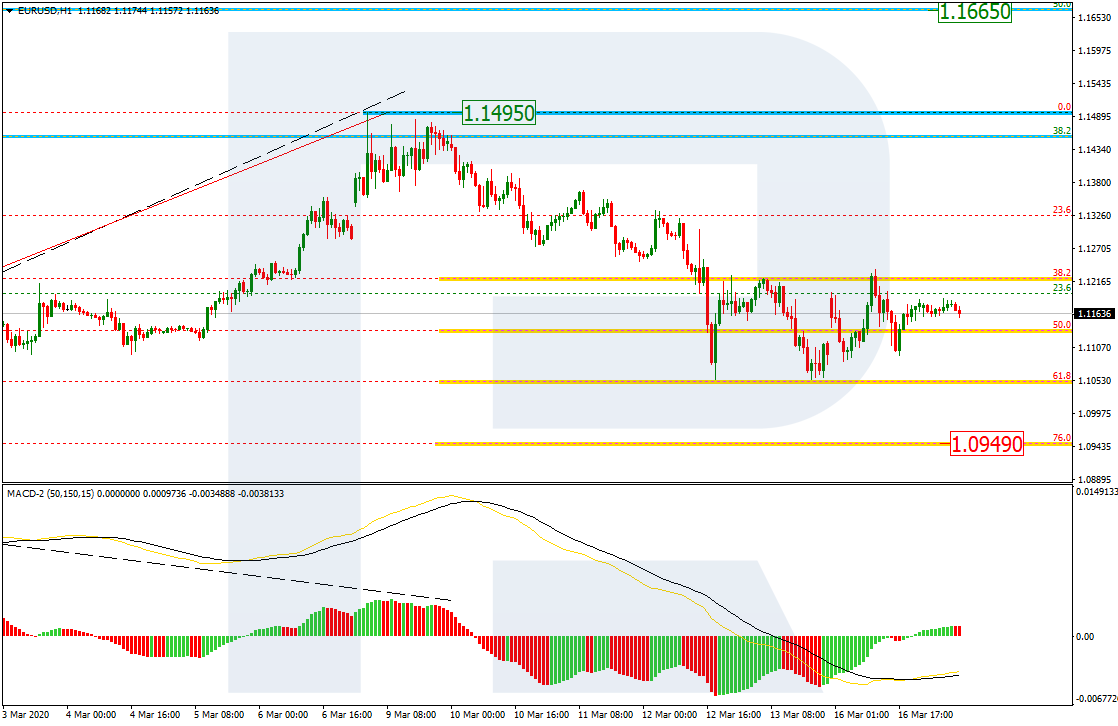
The H1 chart shows more detailed structure of the current correction. After reaching 61.8%, the pair is trading sideways. The next downside wave may reach 76.0% fibo at 1.0949. The resistance is the high at 1.1495.
USDJPY, “US Dollar vs. Japanese Yen”
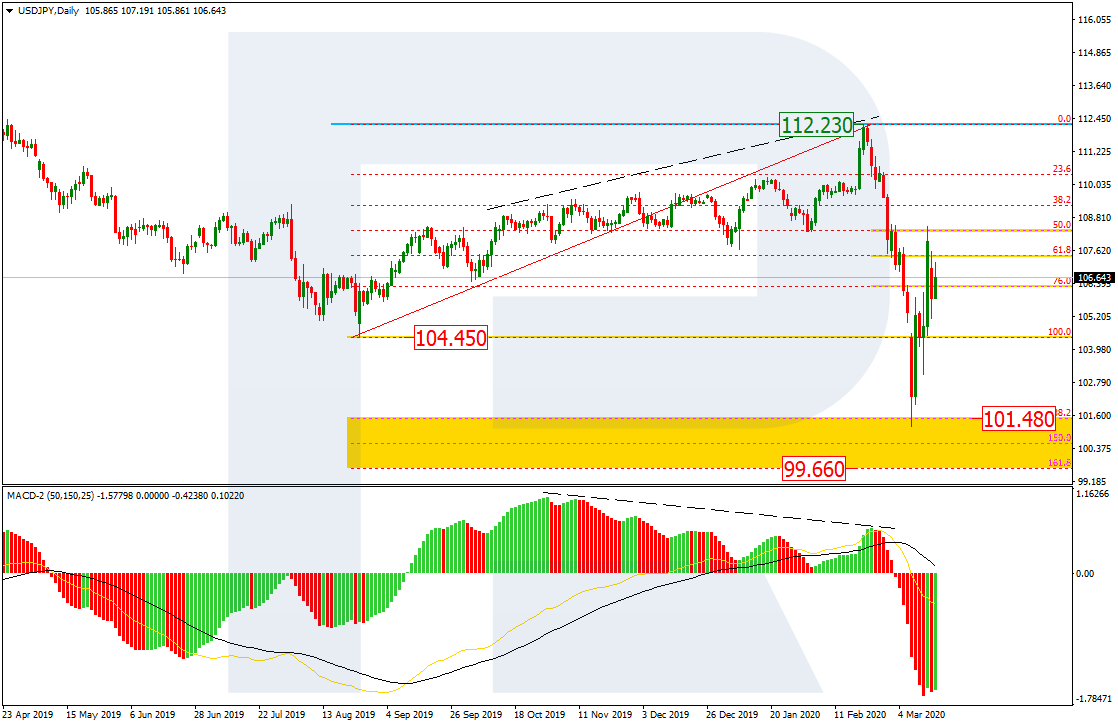
As we can see in the daily chart, after testing the post-correctional extension area between 138.2% and 161.8% between 101.48 and 99.66 respectively, USDJPY has quickly rebounded for a new correction or a trend reversal. To confirm the trend reversal, the price must break the key resistance at 112.23.
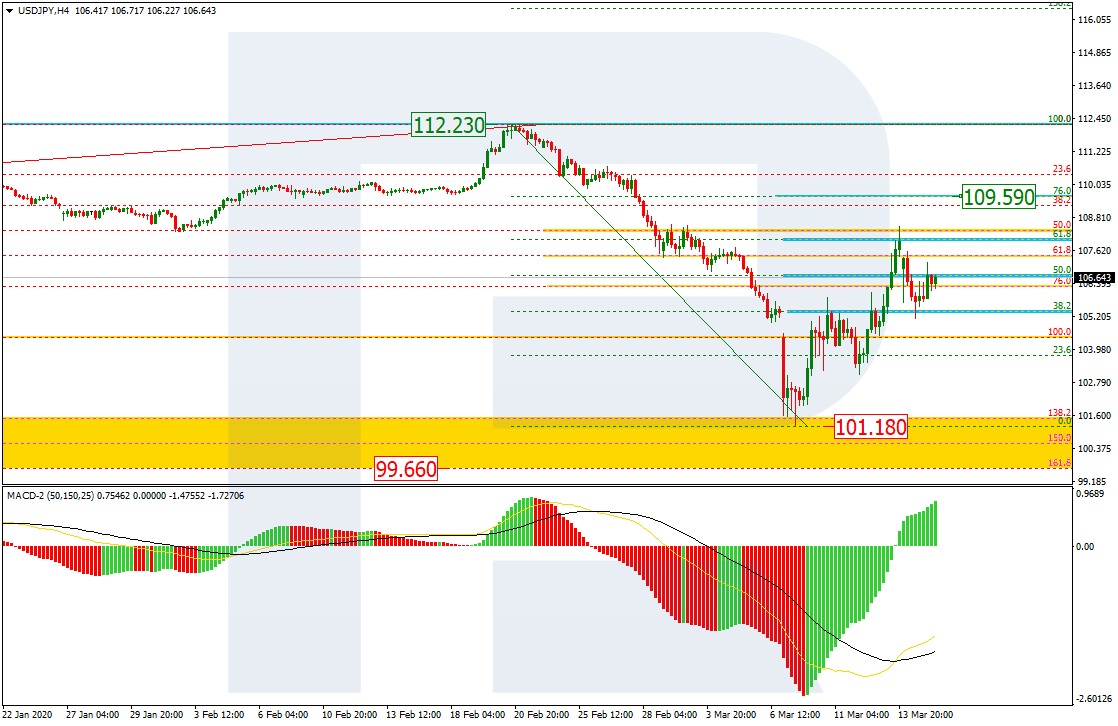
The H4 chart shows a rising correction after a descending impulse. The price has already reached 61.8% fibo and may continue moving towards 76.0% fibo at 109.59. If the price breaks the latter level, the instrument may continue growing to reach the high at 112.23. The support is at 101.18.