Fibonacci Retracements Analysis 20.04.2020 (GOLD, USDCHF)
XAUUSD, “Gold vs US Dollar”
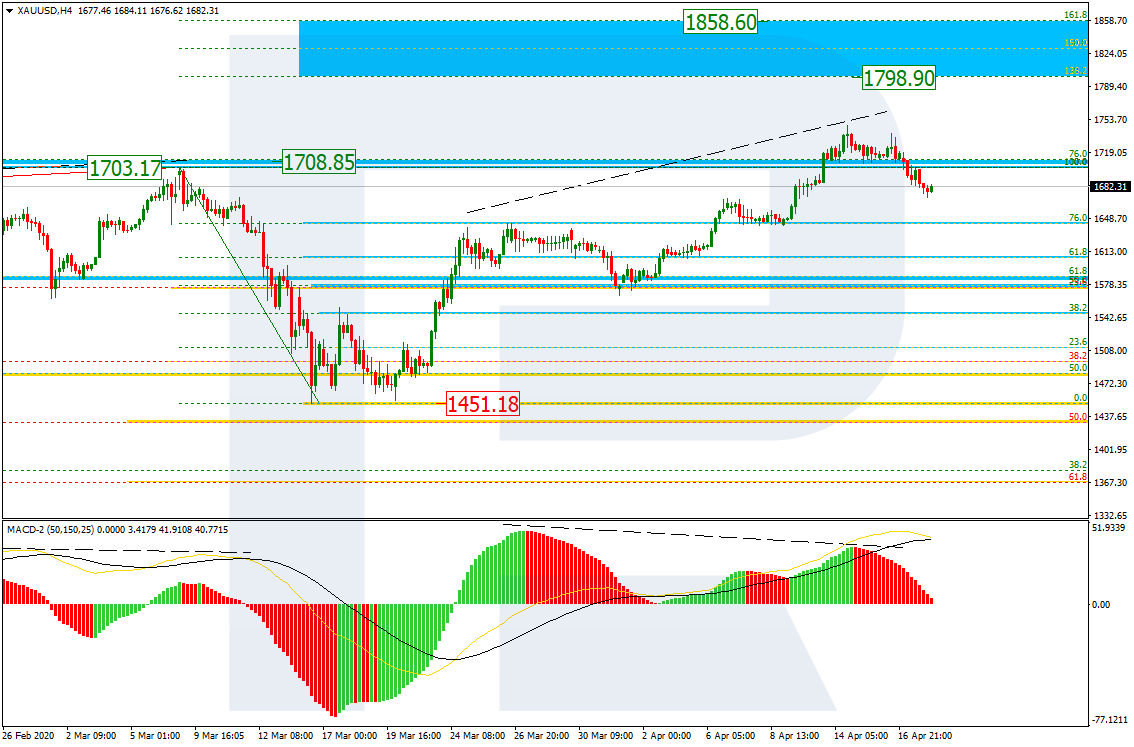
As we can see in the H4 chart, after updating its previous high, the ascending wave has reached 76.0% fibo. XAUUSD might have continued its growth to reach the post-correctional extension area between 138.2% and 161.8% fibo at 1798.90 and 1858.60 respectively, but there was a divergence on MACD to indicate a тку pullback to the downside. The support remains at the low at 1451.18.

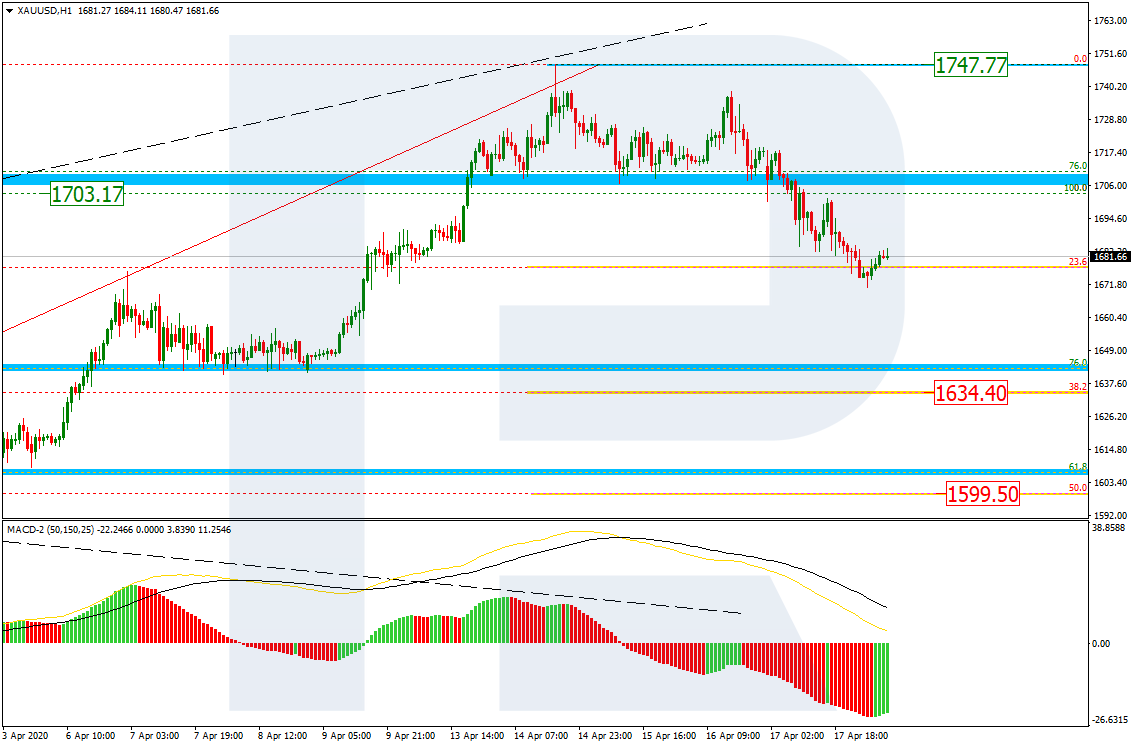
In the H1 chart, the divergence made the pair reverse and start a new decline, which has already reached 23.6% fibo. The next downside targets are 38.2% and 50.0% fibo at 1634.40 and 1599.50 respectively. The resistance is the local high at 1747.77.
USDCHF, “US Dollar vs Swiss Franc”
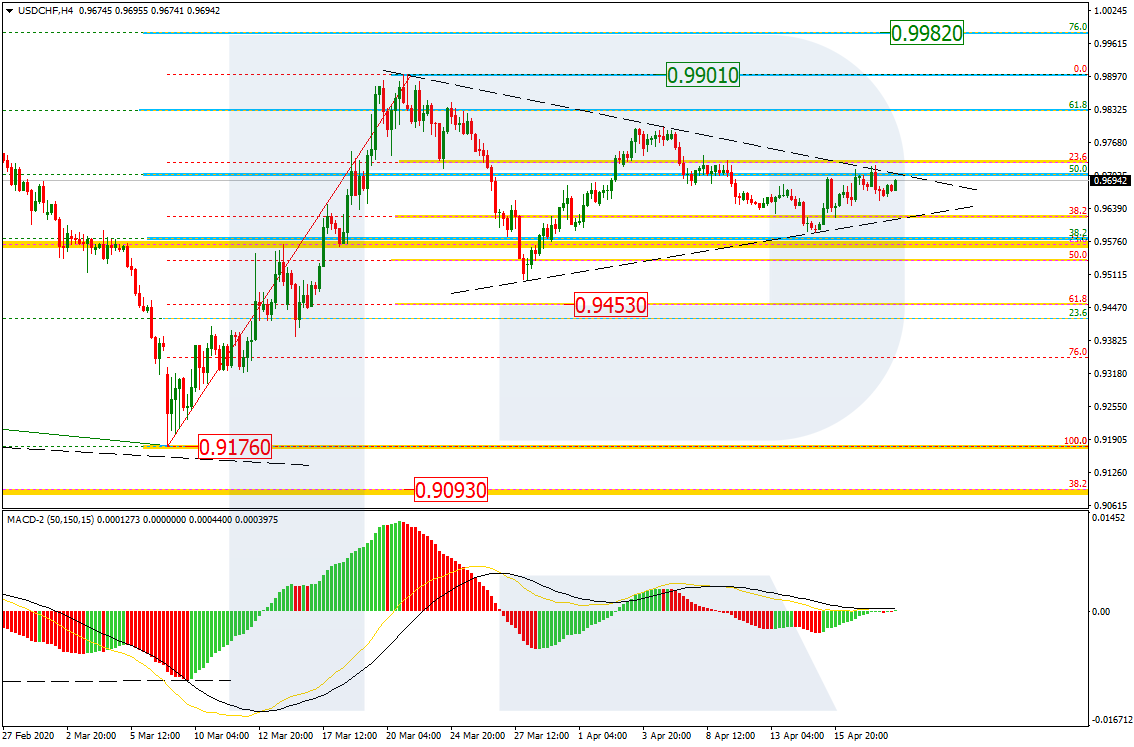
As we can see in the H4 chart, the pair continues correcting inside a Triangle pattern. However, the pattern has become so narrow that it can be broken very soon, most likely to the upside. In this case, the price may resume growing to reach its previous high at 0.9901 and then mid-term 76.0% fibo at 0.9982. At the same time, one shouldn’t exclude the possibility that the pattern may be broken to the downside. After that, USDCHF may fall towards 61.8% fibo at 0.9453.
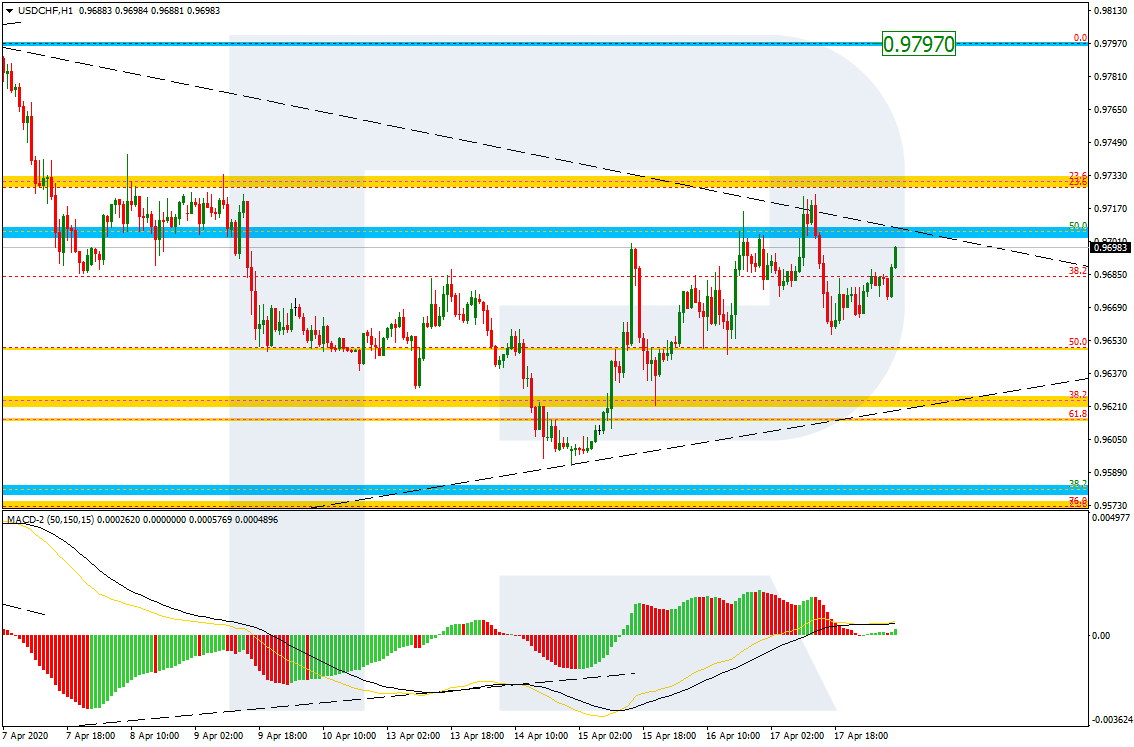
In the H1 chart, the divergence made the pair stop its pullback at 61.8% fibo and start a new growth, which is currently testing the resistance. In case it breaks the level, the instrument may continue trading upwards to reach local high at 0.9797.