Fibonacci Retracements Analysis 23.04.2020 (AUDUSD, USDCAD)
AUDUSD, “Australian Dollar vs US Dollar”
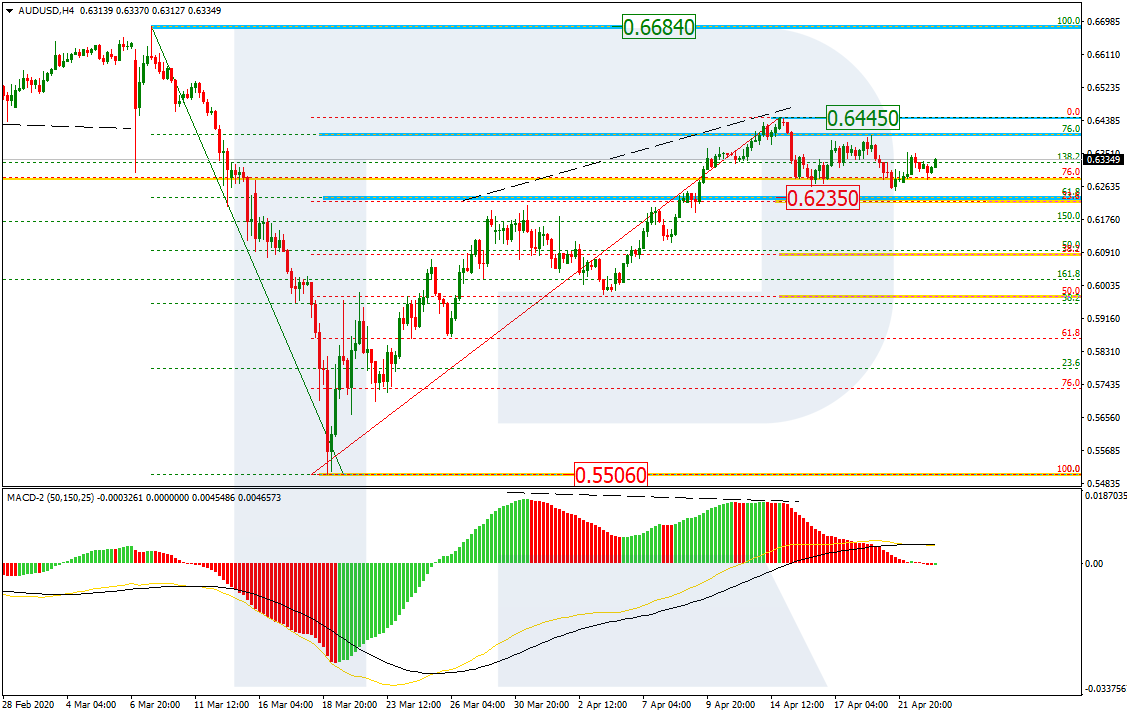
As we can see in the H4 chart, the divergence on MACD made the pair complete the correctional uptrend at 76.0% fibo and start a new pullback to the downside, which has already tested 0.6235. However, the pullback was pretty fast, so the instrument may start a new rising impulse towards 0.6445. After breaking this level, the pair may continue growing to reach the mid-term fractal high at 0.6684.

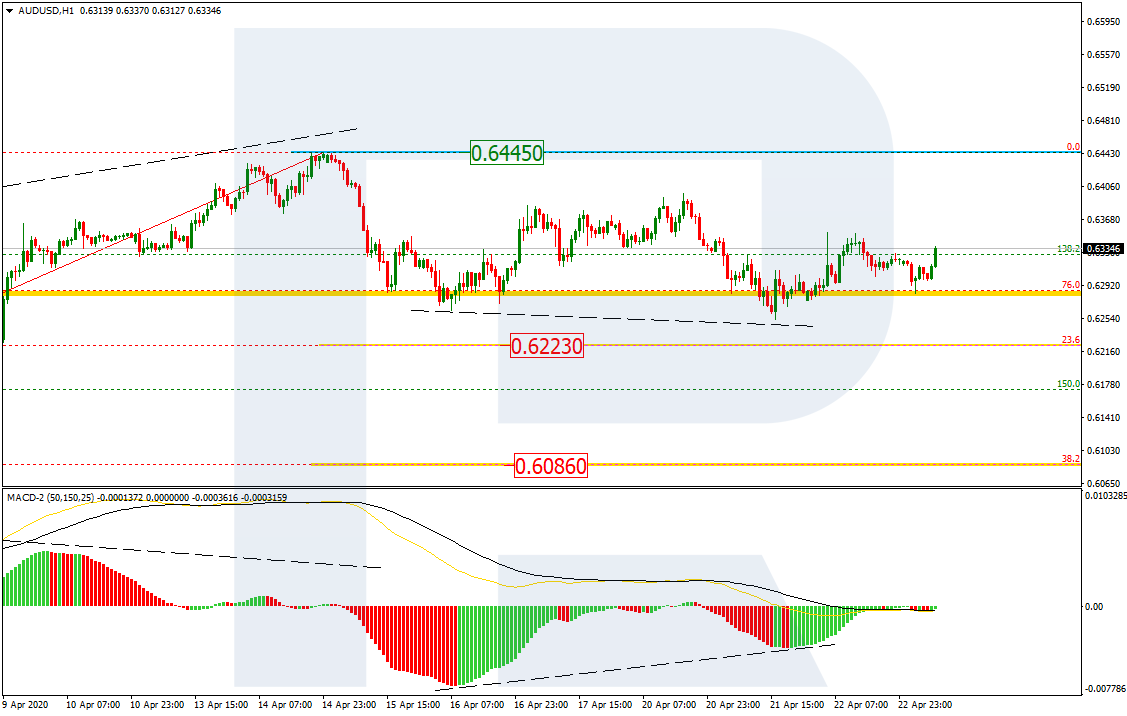
In the H1 chart, the convergence made AUDUSD reverse and start a new growth. However, as long as the high at 0.6445 isn’t broken, the pair may yet resume falling towards 23.6% and 38.2% fibo at 0.6223 and 0.6086 respectively.
USDCAD, “US Dollar vs Canadian Dollar”
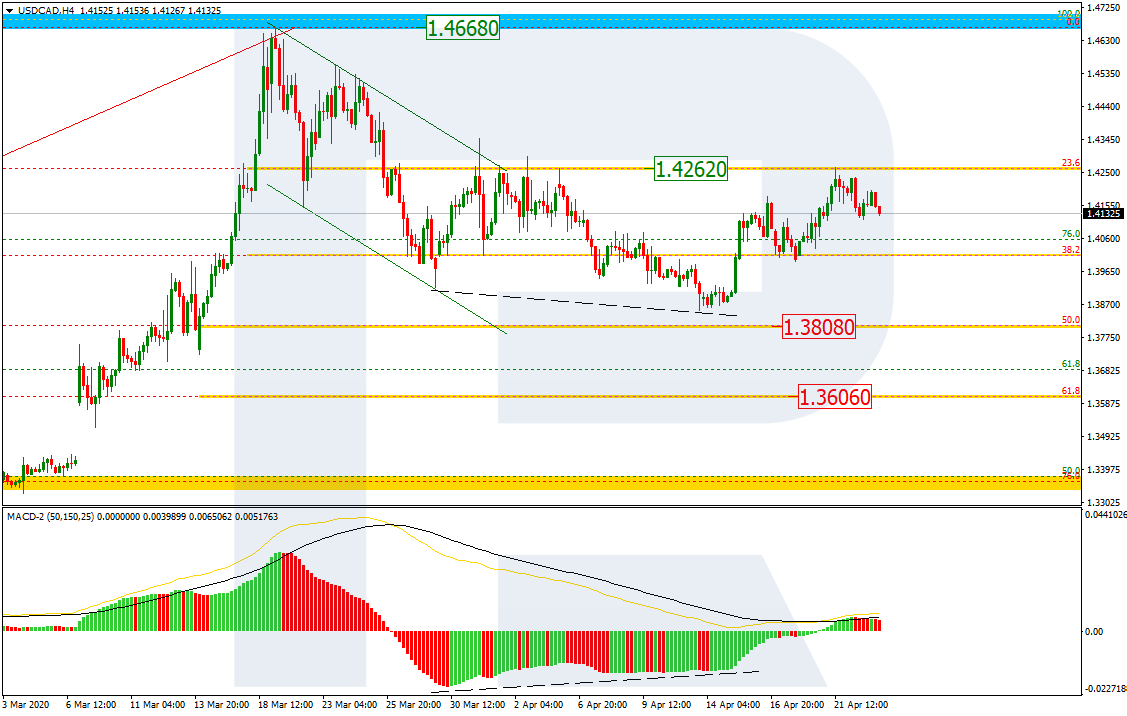
In the H4 chart, the convergence made the pair resume growing and test the resistance at 1.4262. However, the price failed to break this level and fix above it. In this light, the instrument is expected to resume falling. The downside targets may be 50.0% and 61.8% fibo at 1.3808 and 1.3606 respectively.
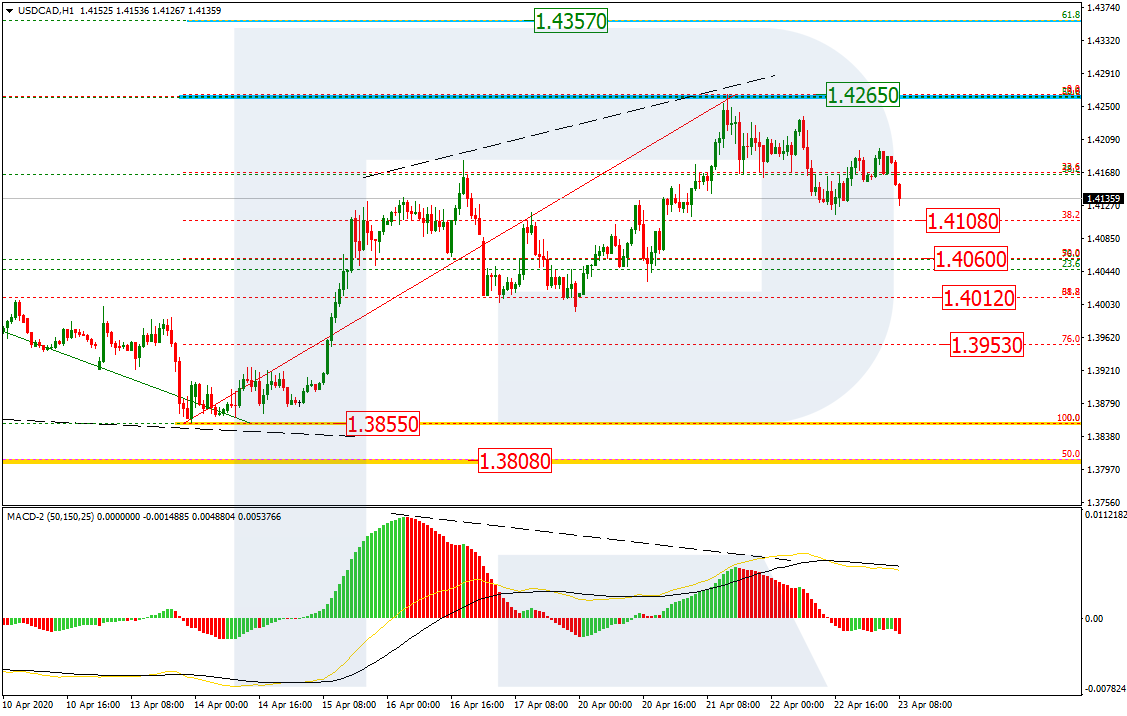
As we can see in the H1 chart, the correctional uptrend reached 50.0% fibo and then there was a divergence on MACD indicating a possible reversal and a new decline. At the moment, the pair is heading towards 38.2%, 50.0%, 61.8%, and 76.0% fibo at 1.4108, 1.4060, 1.4012 and 1.3953 respectively.