Fibonacci Retracements Analysis 30.04.2020 (AUDUSD, USDCAD)
AUDUSD, “Australian Dollar vs US Dollar”
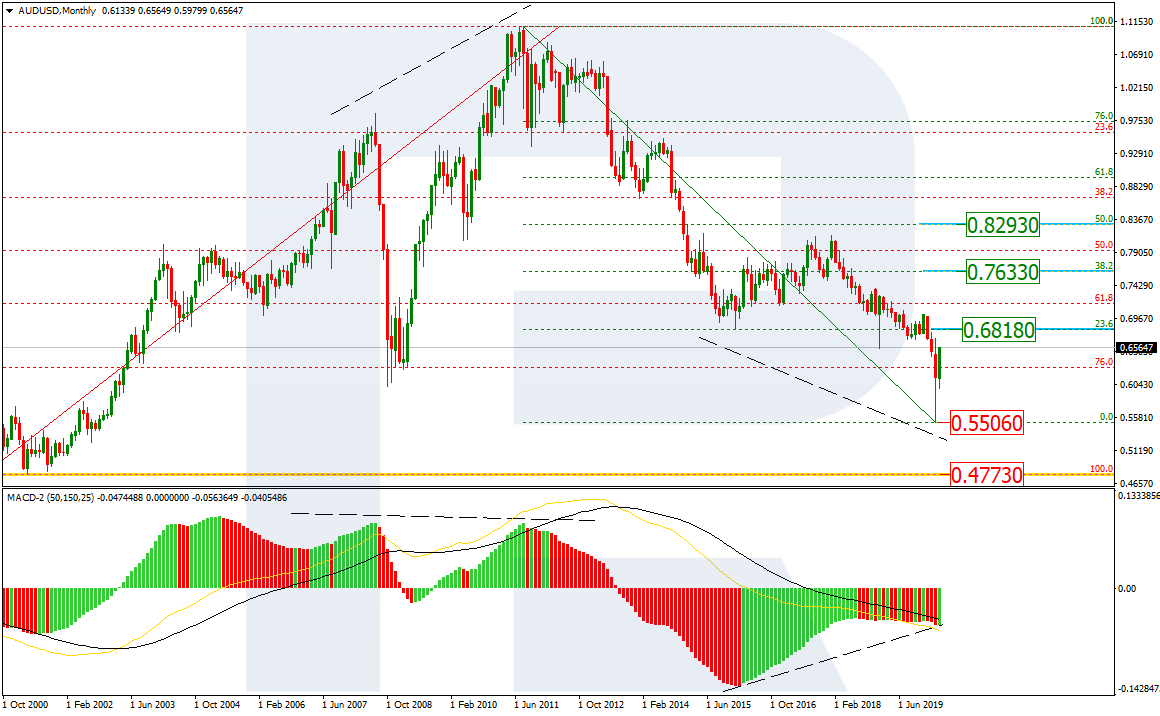
Now it’s the high time to check the long-term scenario for AUDUSD. As we can see in the monthly chart, the convergence on MACD made the pair complete the downtrend and fall to break 76.0% fibo. At the same time, the price didn’t reach the key low 0.4773 but managed to update the current one at 0.5506 and then started a new long-term bullish phase. At the moment, the instrument is moving towards 23.6% fibo and may later continue growing to reach 38.2% and 50.0% fibo at 0.7633 and 0.8293 respectively.

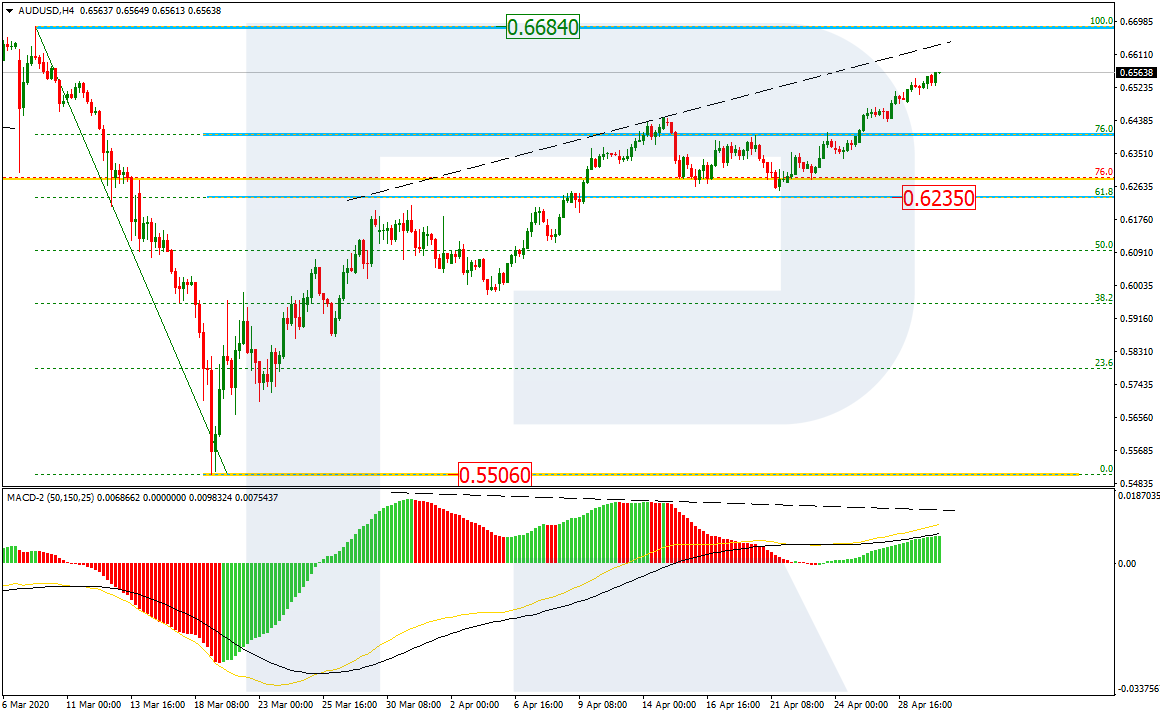
In the H4 chart, after completing a short-term pullback towards the local high at 0.6684, AUDUSD continue trading upwards. However, there might be a divergence on MACD, which indicates a possible pullback after the price reaches the high. The target of the pullback may be the current support, which is at 61.8% fibo at 0.6235
USDCAD, “US Dollar vs Canadian Dollar”
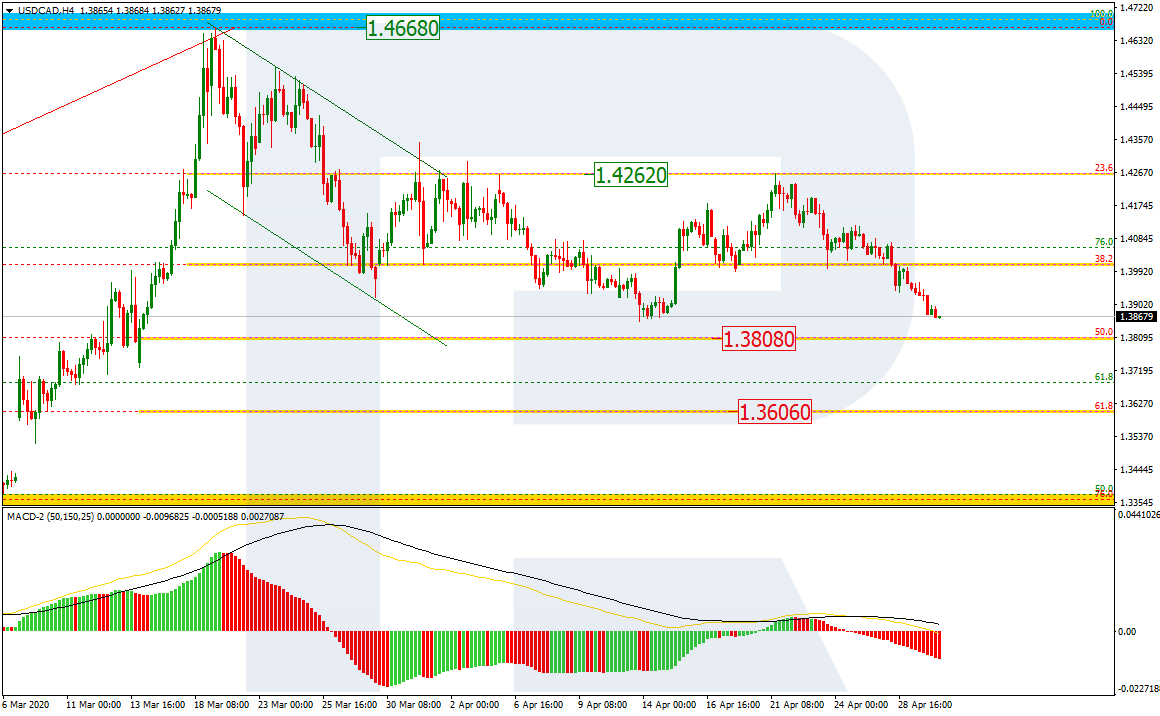
As we can see in the H4 chart, after rebounding from the resistance at 23.6% fibo at 1.4262, USDCAD is trading downwards. The downside targets may be 50.0% and 61.8% fibo at 1.3808 and 1.3606 respectively.
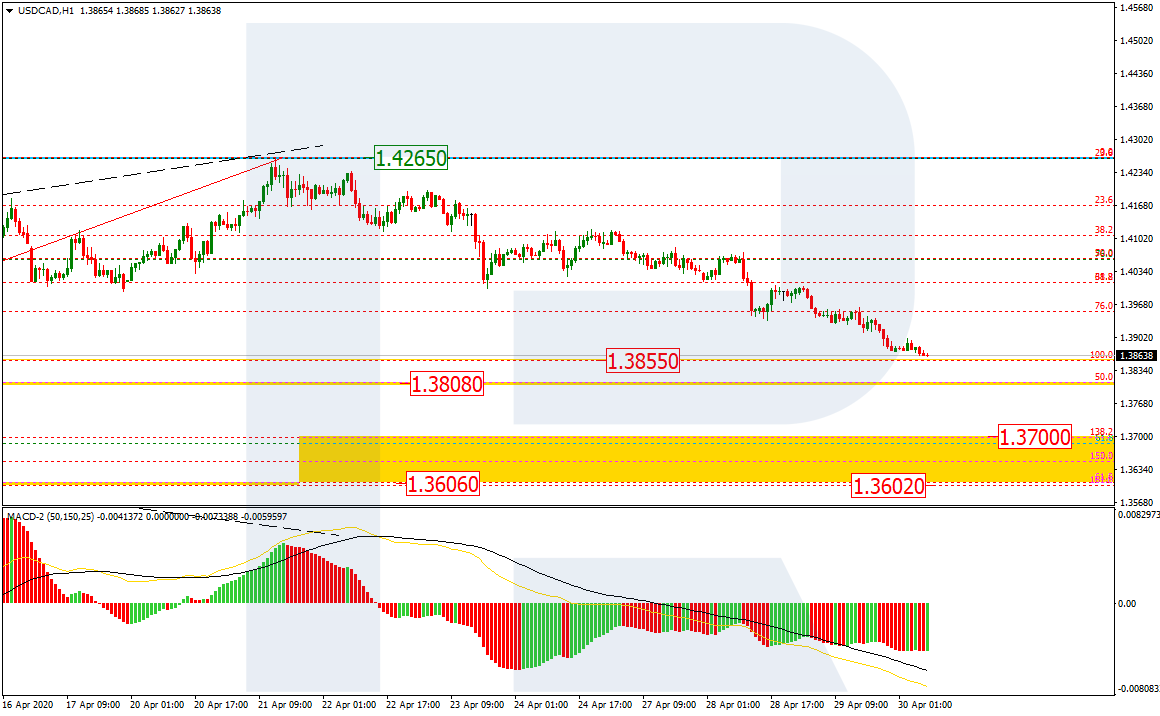
In the H1 chart, the descending wave has almost reached the low at 1.3855. The next downside targets may be not only mid-term 50.0% and 61.8% fibo at 1.3808 and 1.3606 respectively, but also the post-correctional extension area between 138.2% and 161.8% fibo at 1.3700 and 1.3602 respectively.