ibonacci Retracements Analysis 06.05.2020 (GBPUSD, EURJPY)
GBPUSD, “Great Britain Pound vs US Dollar”
What can we see in the H4 chart? It looks like the pair is going to continue trading downwards in the nearest future, because it has failed to break the high at 1.2648. After testing the high and rebounding from it, GBPUSD is forming a new correctional structure to the downside with the target at 38.2%, 50.0%, and 61.8% fibo at 1.2175, 1.2030, and 1.1881 respectively.


The H1 chart shows a more detailed structure of the current descending wave. The pair is approaching 23.6% fibo and may break it to continue falling towards 38.2% fibo at 1.2175. This scenario is confirmed by the downward dynamics of the MACD lines.


EURJPY, “Euro vs. Japanese Yen”
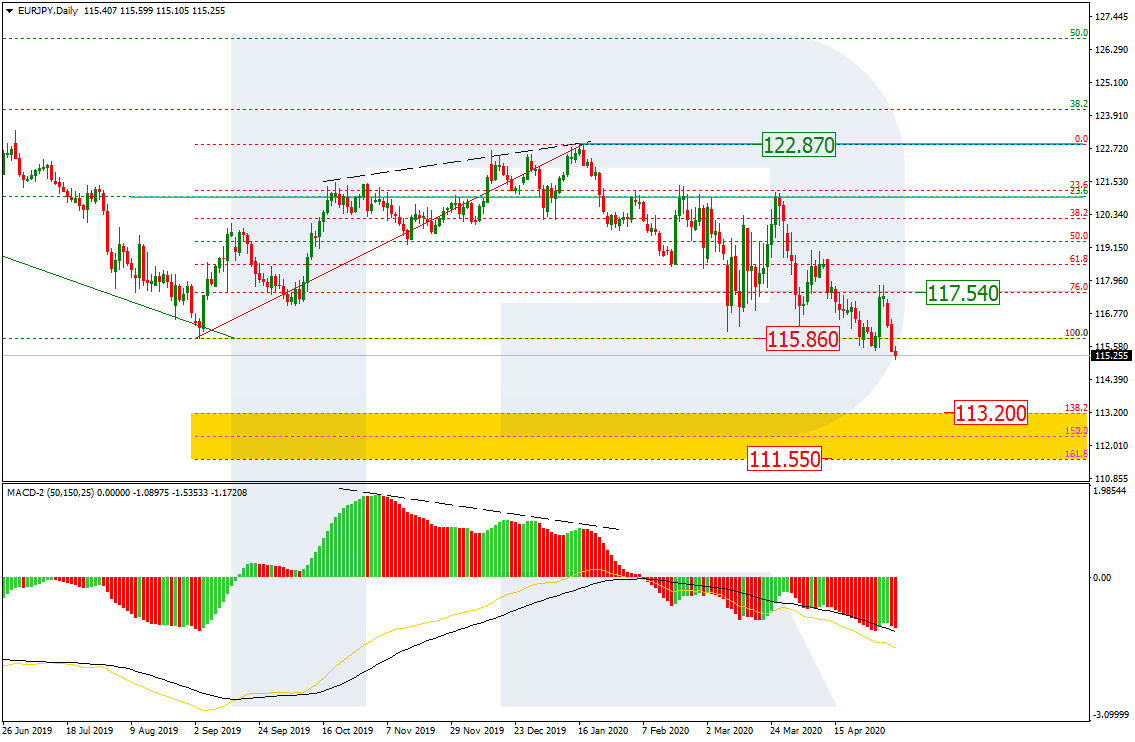
As we can see in the daily chart, after breaking the previous low at 115.86, EURJPY has managed to fix below it. In the future, the pair may continue falling towards the post-correctional extension area between 138.2% and 161.8% fibo at 113.20 and 111.54 respectively. the current resistance is at 76.0% fibo (117.54).


In the H4 chart, after finishing the short-term pullback, the pair is forming a new descending wave. One should pay attention that the current descending tendency is rather slow. At the same time, there might be a convergence on MACD to indicate a new correction soon to reach 76.0% fibo at 117.54.
