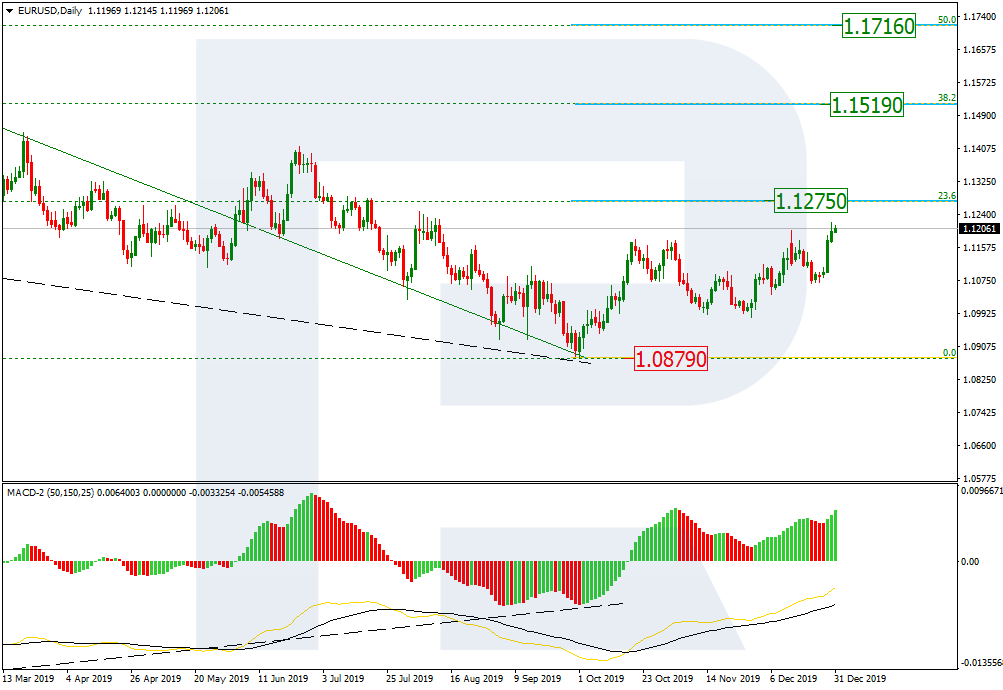
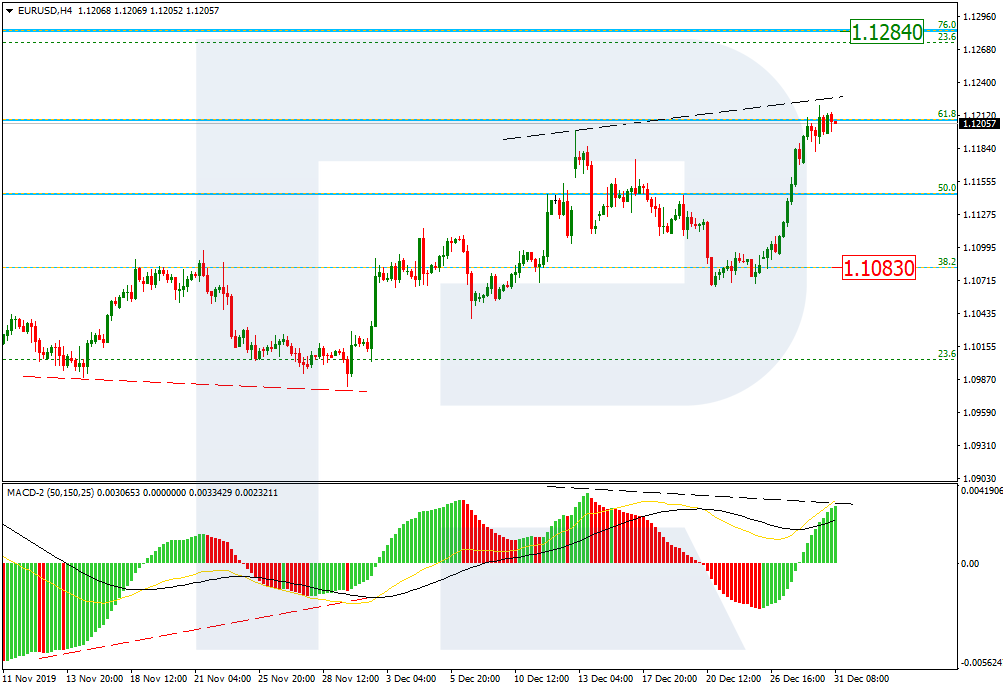
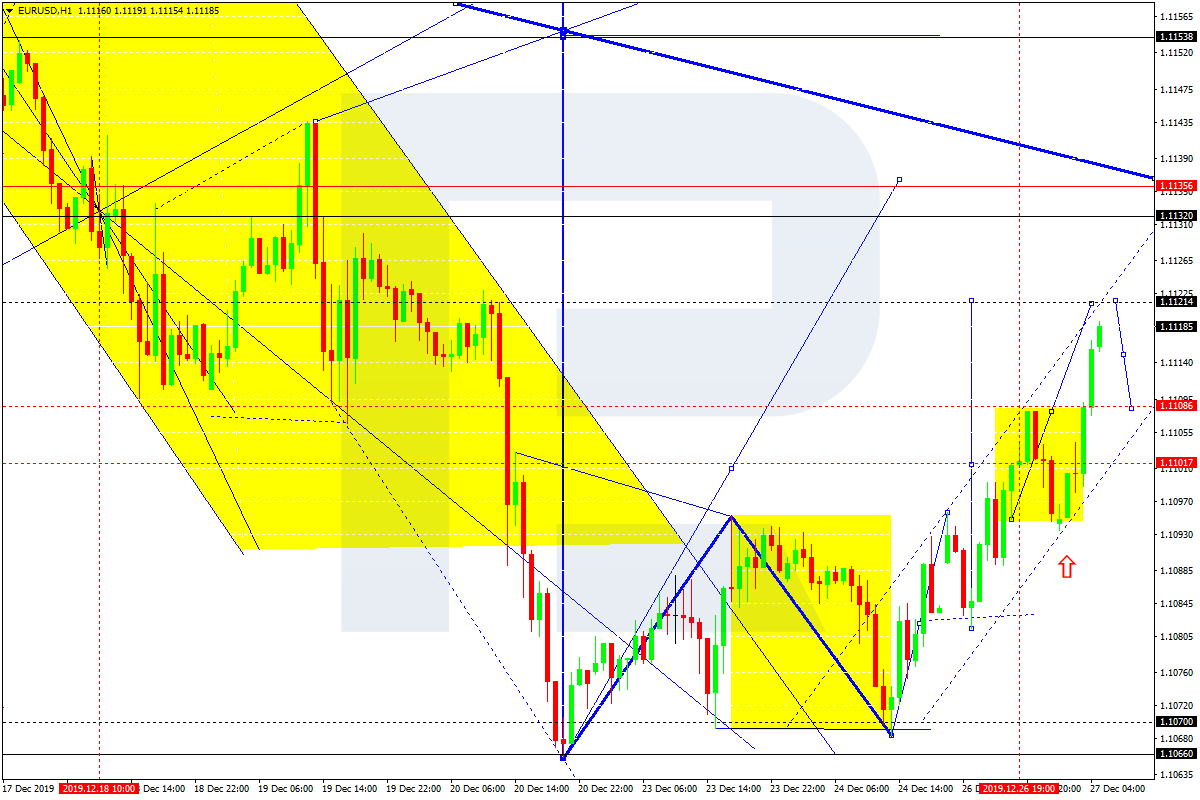
EURUSD, “Euro vs US Dollar”
EURUSD has formed an upside continuation pattern around 1.1100; right now, it is growing to reach 1.1121. After that, the instrument may start a new correction towards 1.1109 and then form one more ascending structure with the short-term target at 1.1133.

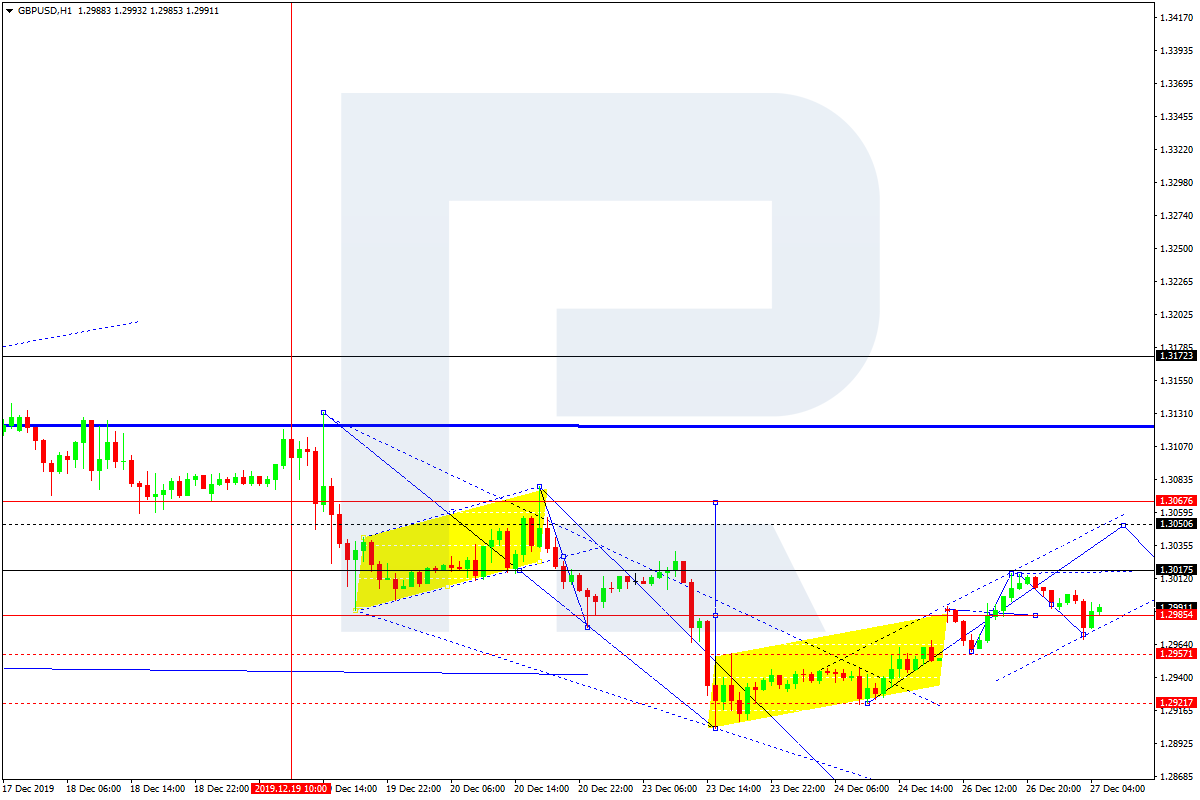
GBPUSD, “Great Britain Pound vs US Dollar”
GBPUSD has formed the consolidation range around 1.2985; right now, it is moving upwards. Possibly, the pair may reach 1.3050 and then start a new correction towards 1.3017. Later, the market may resume trading upwards with the target at 1.3067.
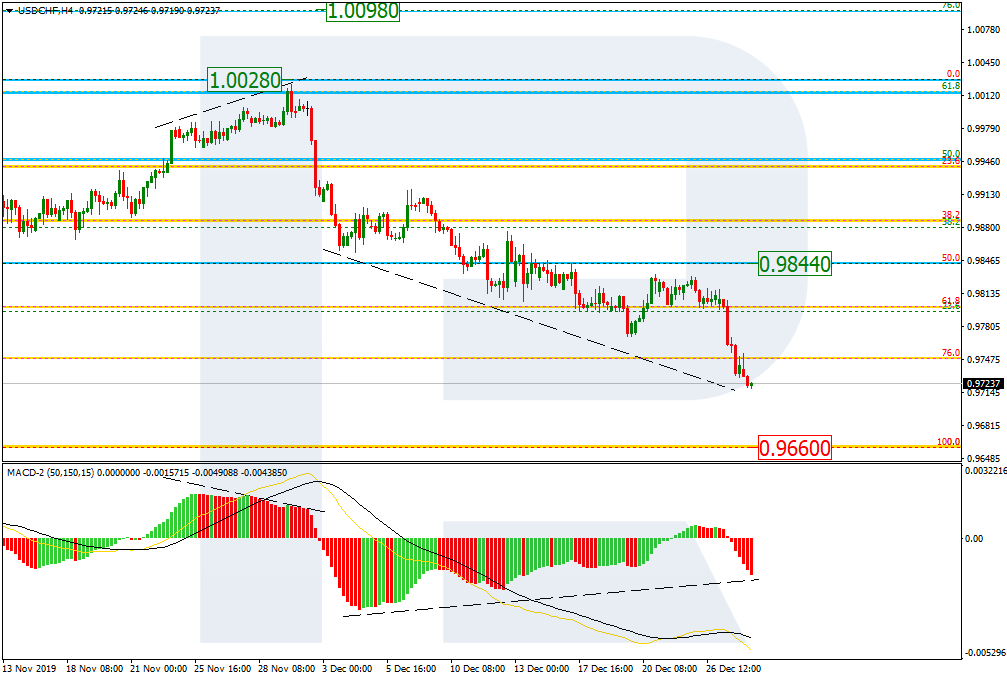
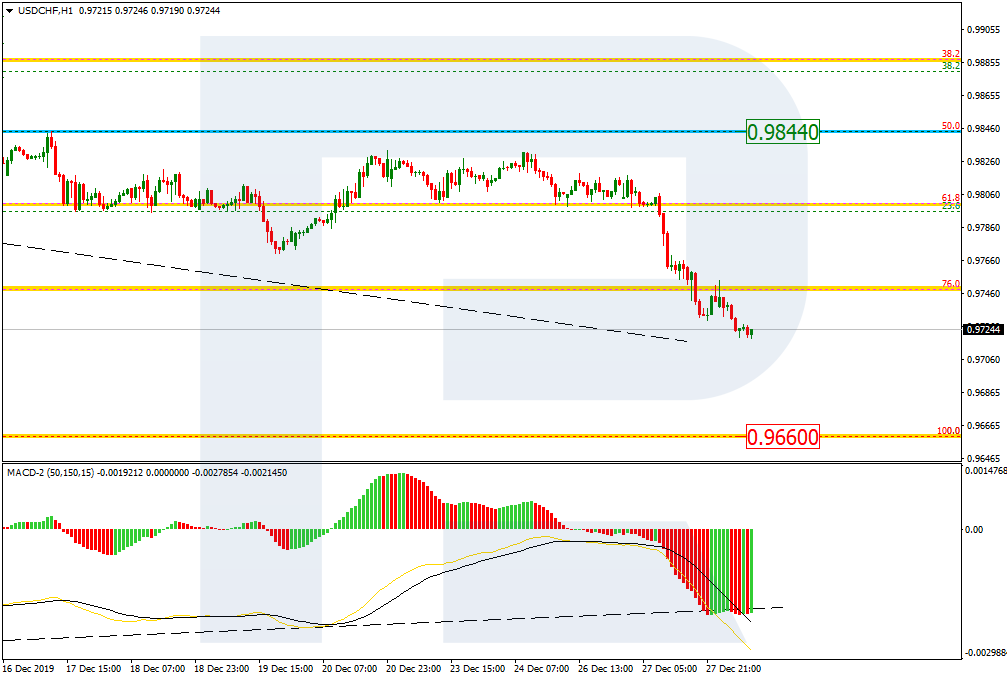
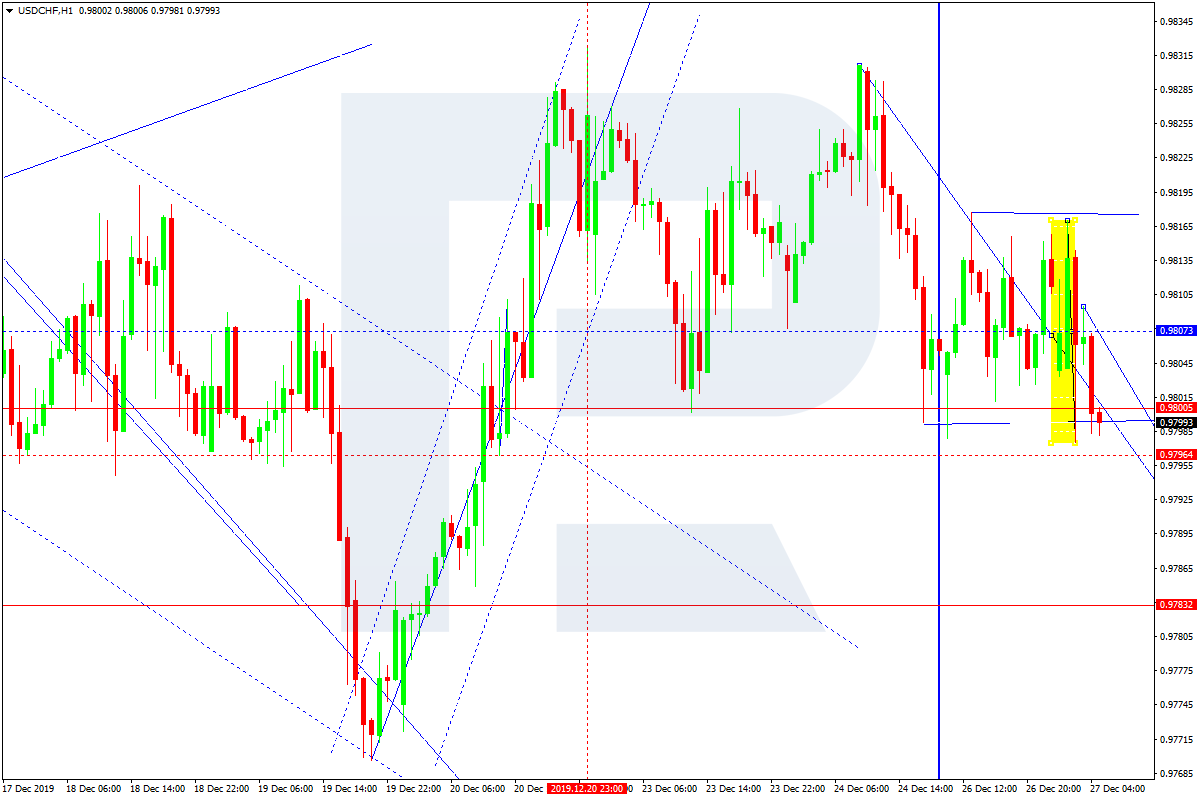
USDCHF, “US Dollar vs Swiss Franc”
USDCHF has formed the consolidation range around 0.9807; right now, it is moving downwards. Possibly, the pair may break 0.9797 and then continue falling towards 0.9783.
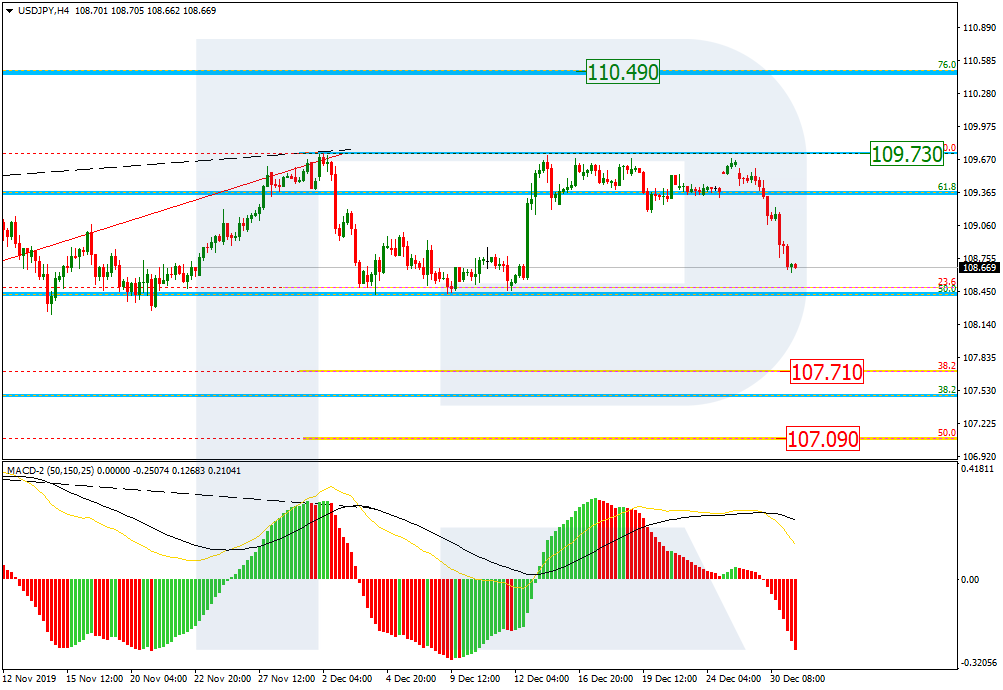
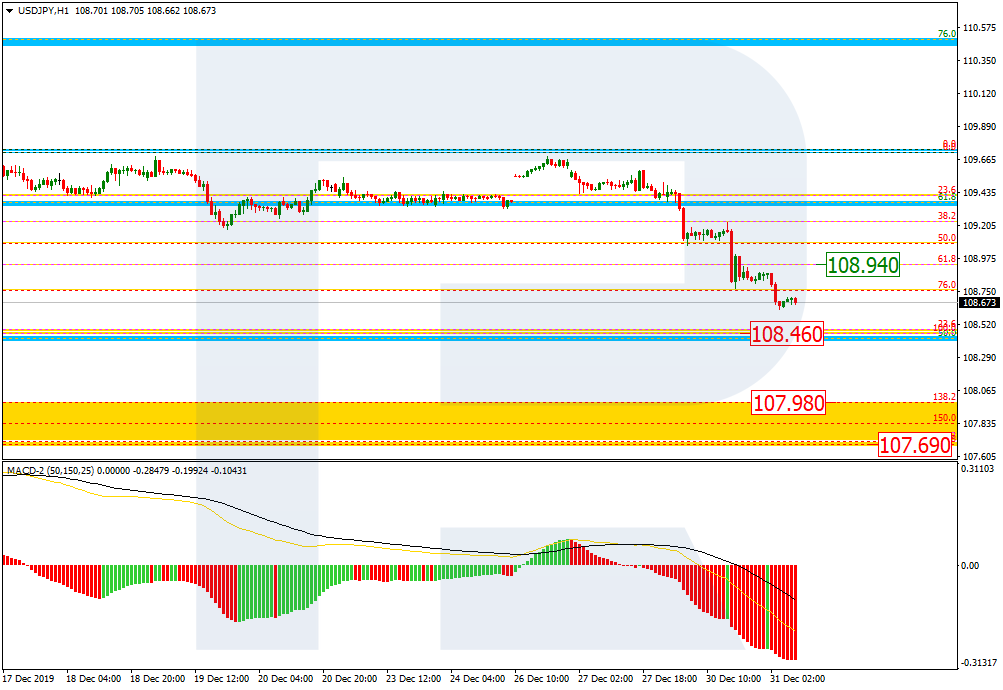
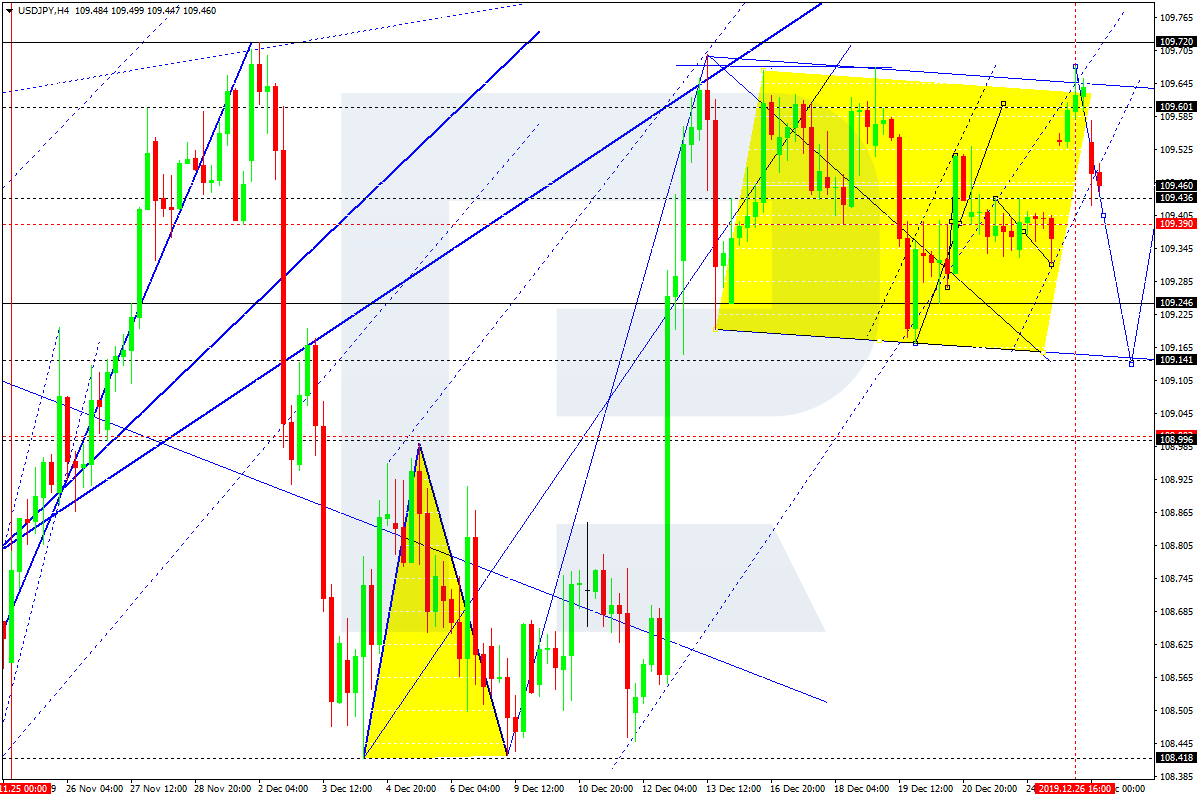
USDJPY, “US Dollar vs Japanese Yen”
USDJPY has reached 109.60; right now, it is falling. Possibly, today the pair may break 109.45 to the downside and then continue moving downwards with the target at 109.14.
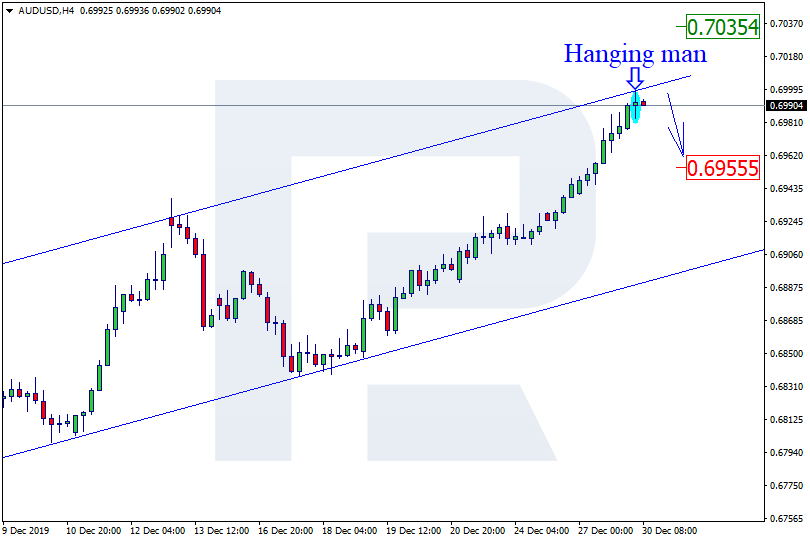
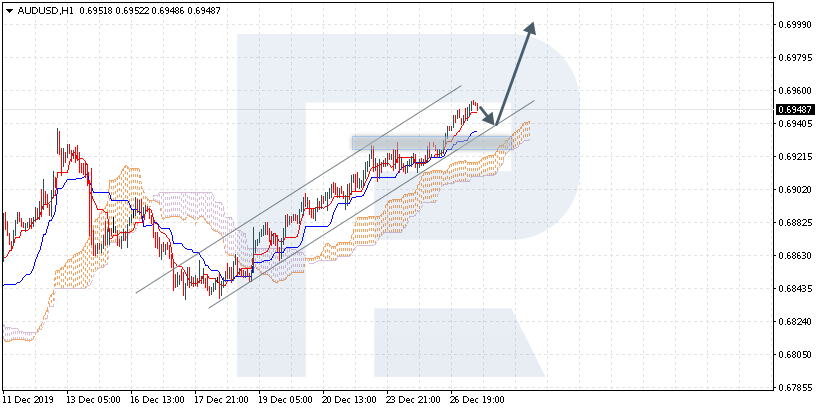
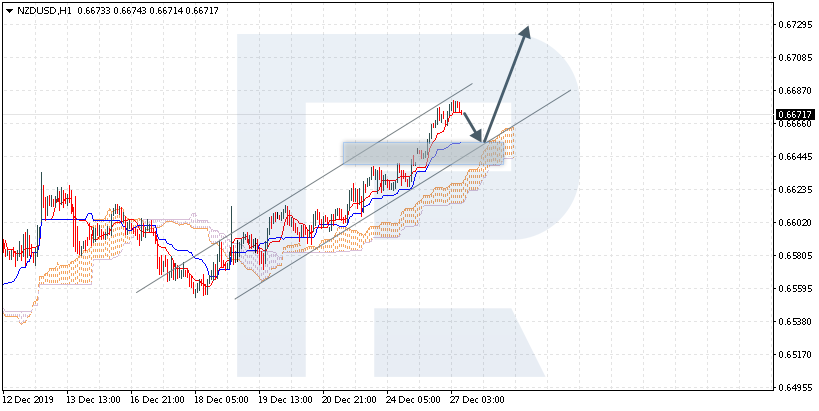
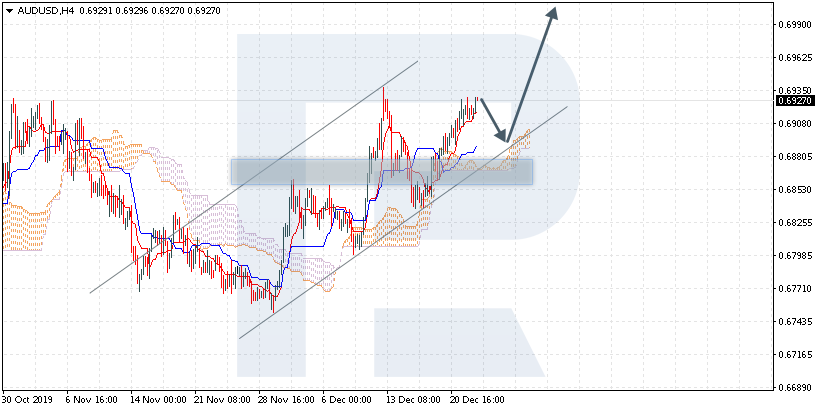
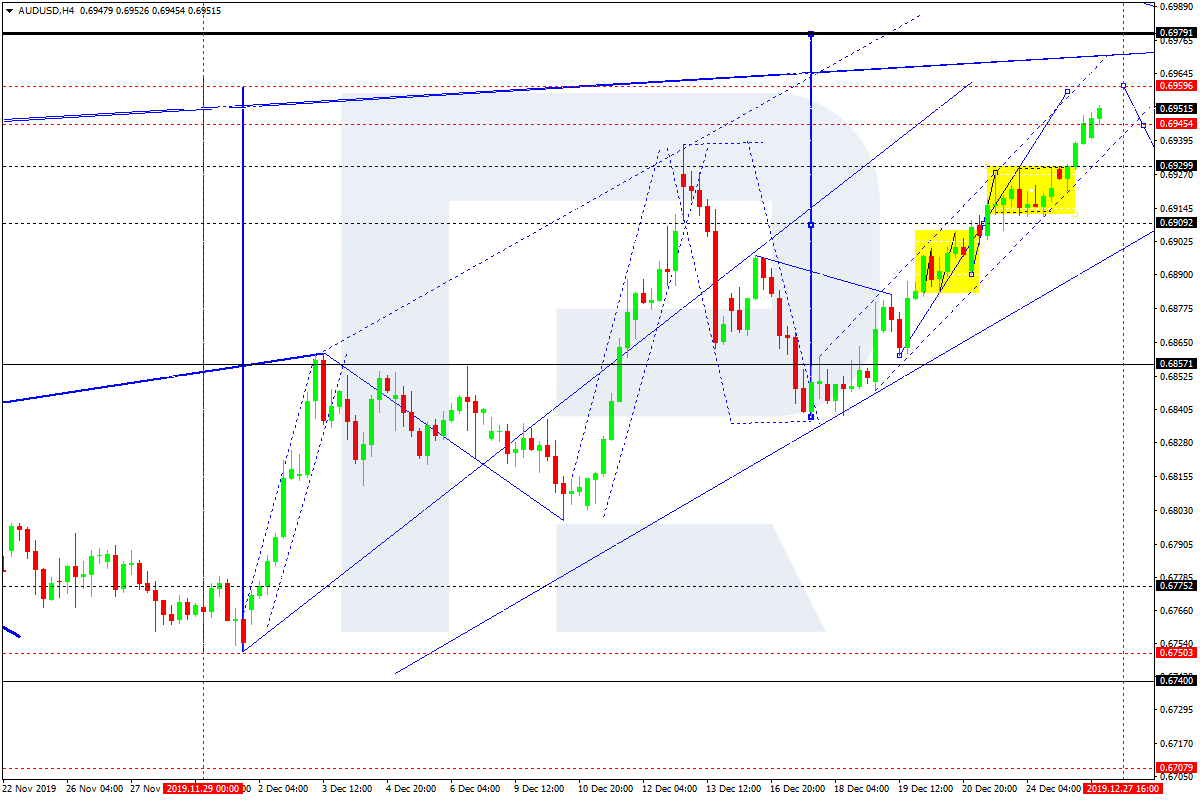
AUDUSD, “Australian Dollar vs US Dollar”
AUDUSD is still moving upwards. Possibly, the pair may reach 0.6957 and then start a new correction towards 0.6930. Later, the market may form one more ascending structure with the target at 0.6979.
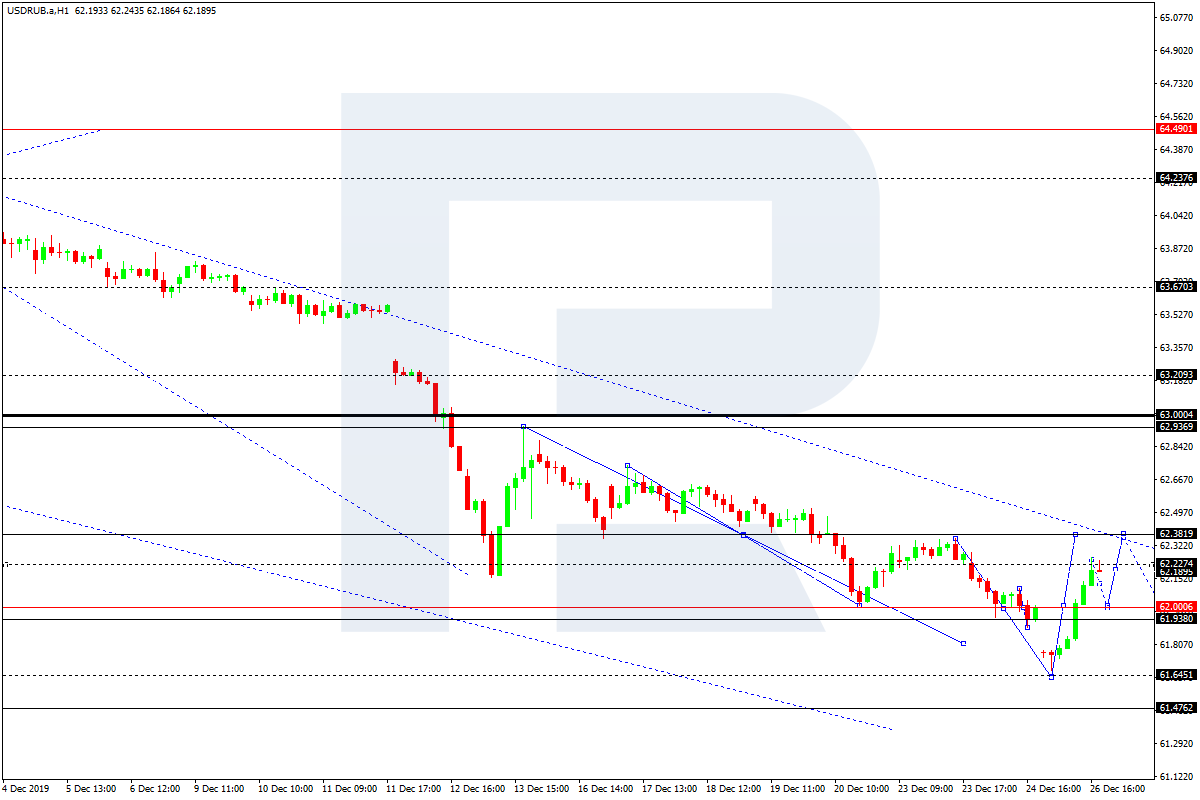
USDRUB, “US Dollar vs Russian Ruble”
USDRUB has returned to 62.25; right now, it is consolidating below it. Today, the pair may break the range to the downside and reach 62.00. Later, the market may start another growth towards 62.38 and then resume trading inside the downtrend with the target at 61.47.
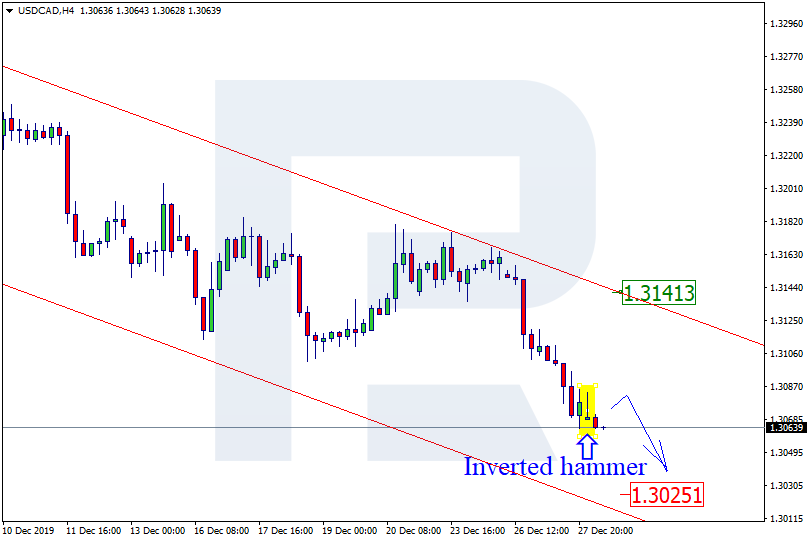
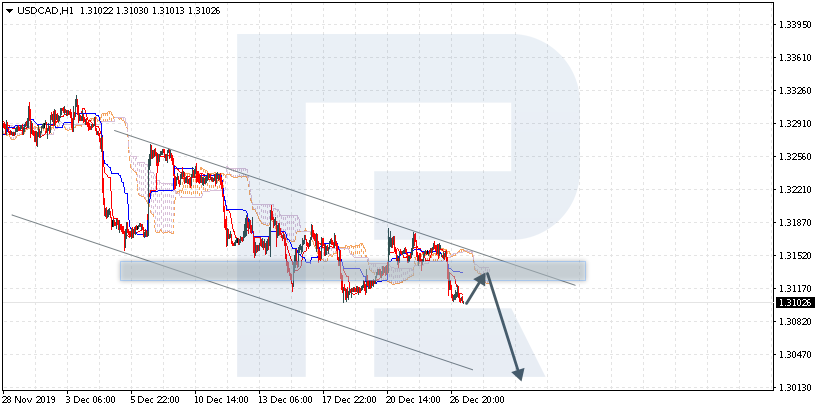
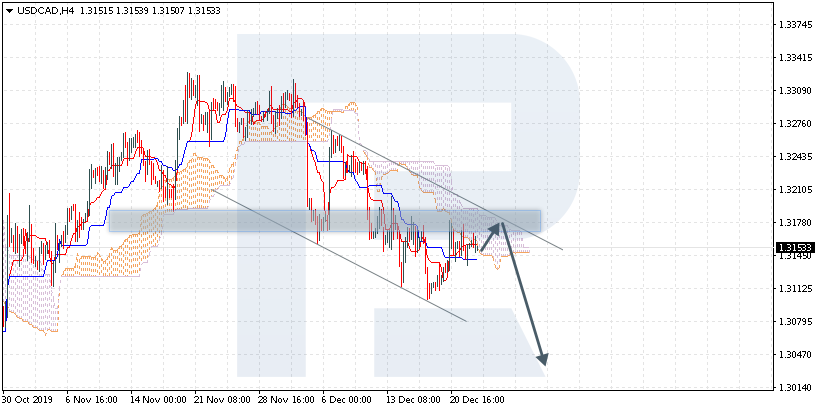
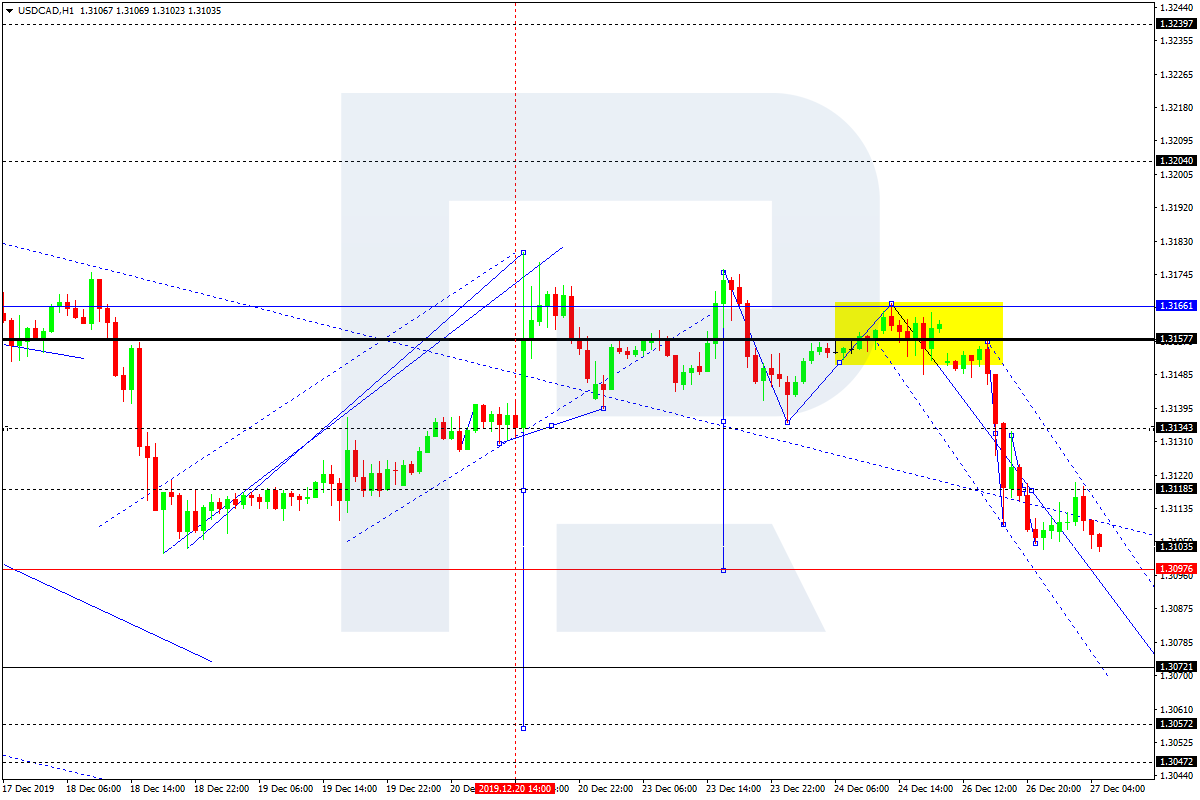
USDCAD, “US Dollar vs Canadian Dollar”
USDCAD has broken 1.3131 downwards; right now, it is still falling to reach 1.3072. Later, the market may start a new correction towards 1.3118 and then resume trading downwards with the target at 1.3050.
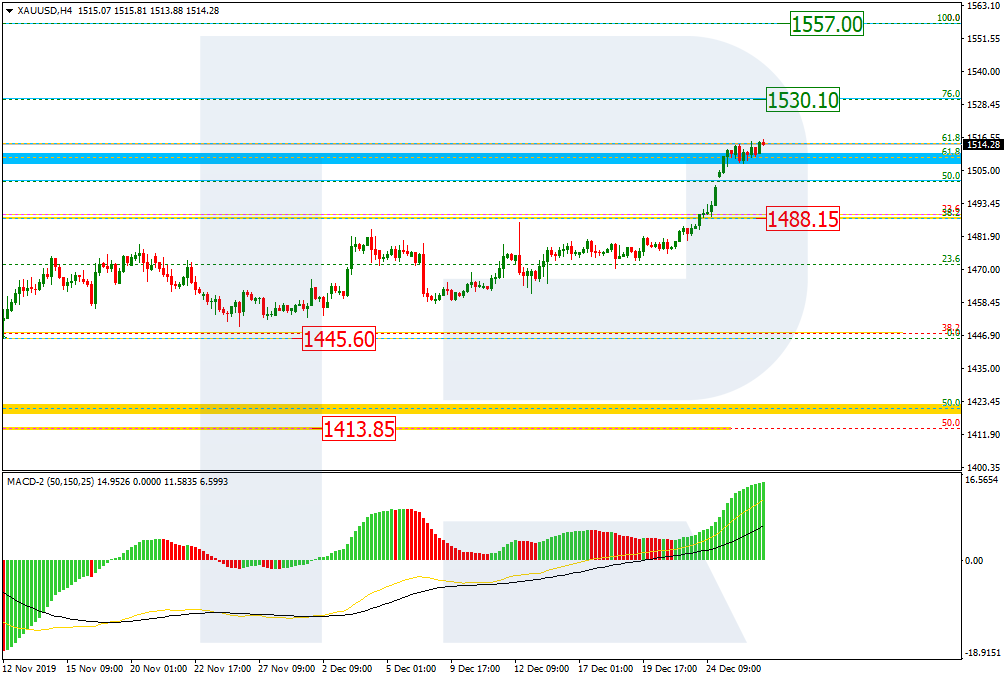
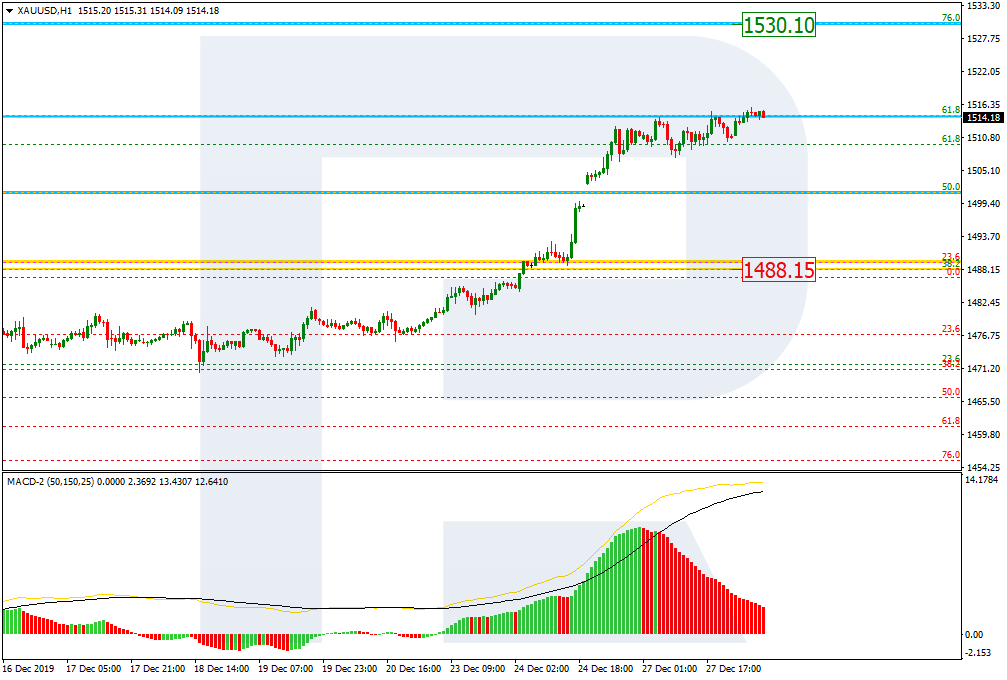
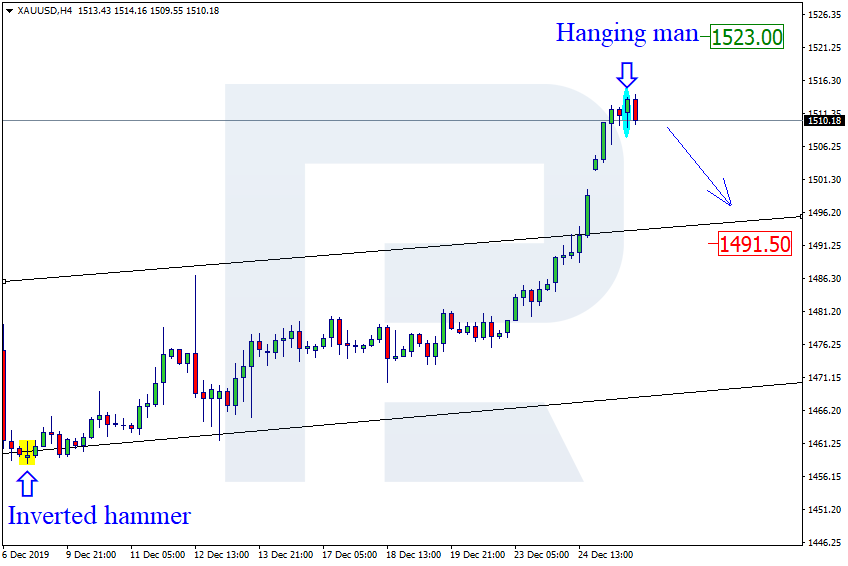
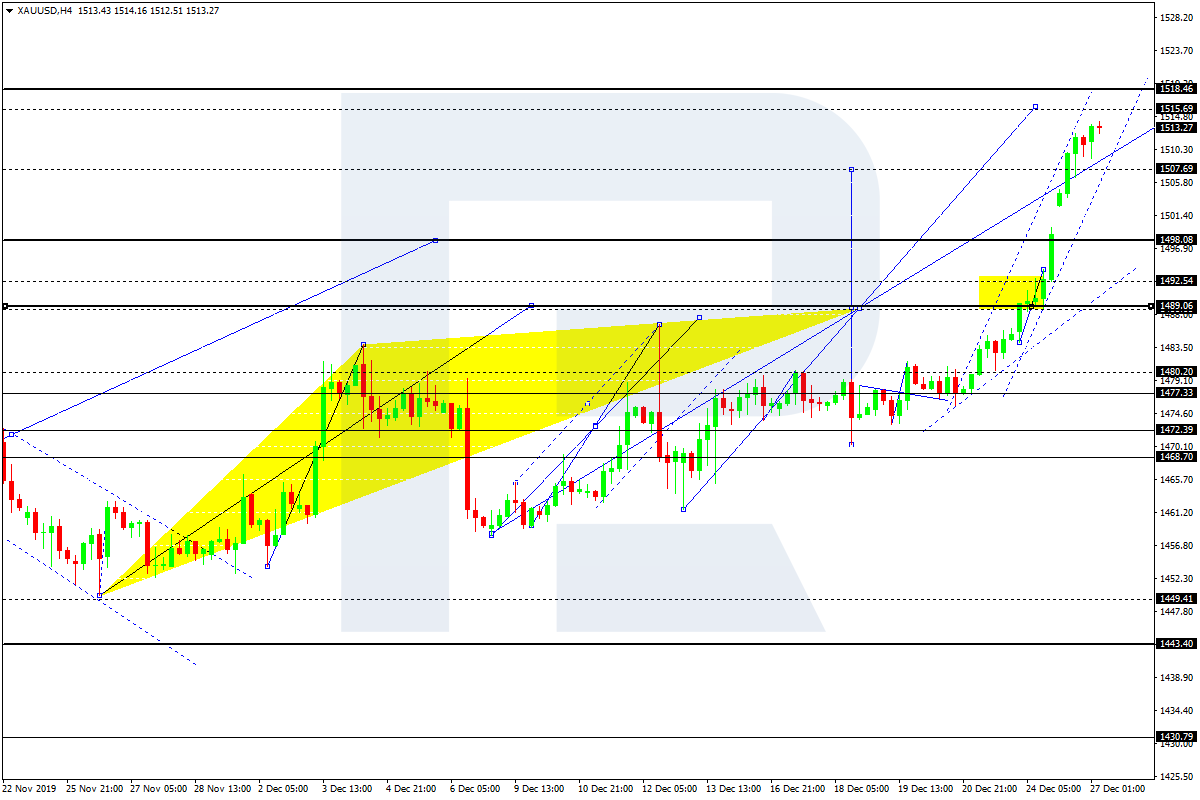
XAUUSD, “Gold vs US Dollar”
Gold has been able to fix above 1507.70; right now, it is still trading upwards to reach 1515.70. After that, the instrument may start a new correction to return to 1507.70 and then extend this ascending wave towards 1518.45.
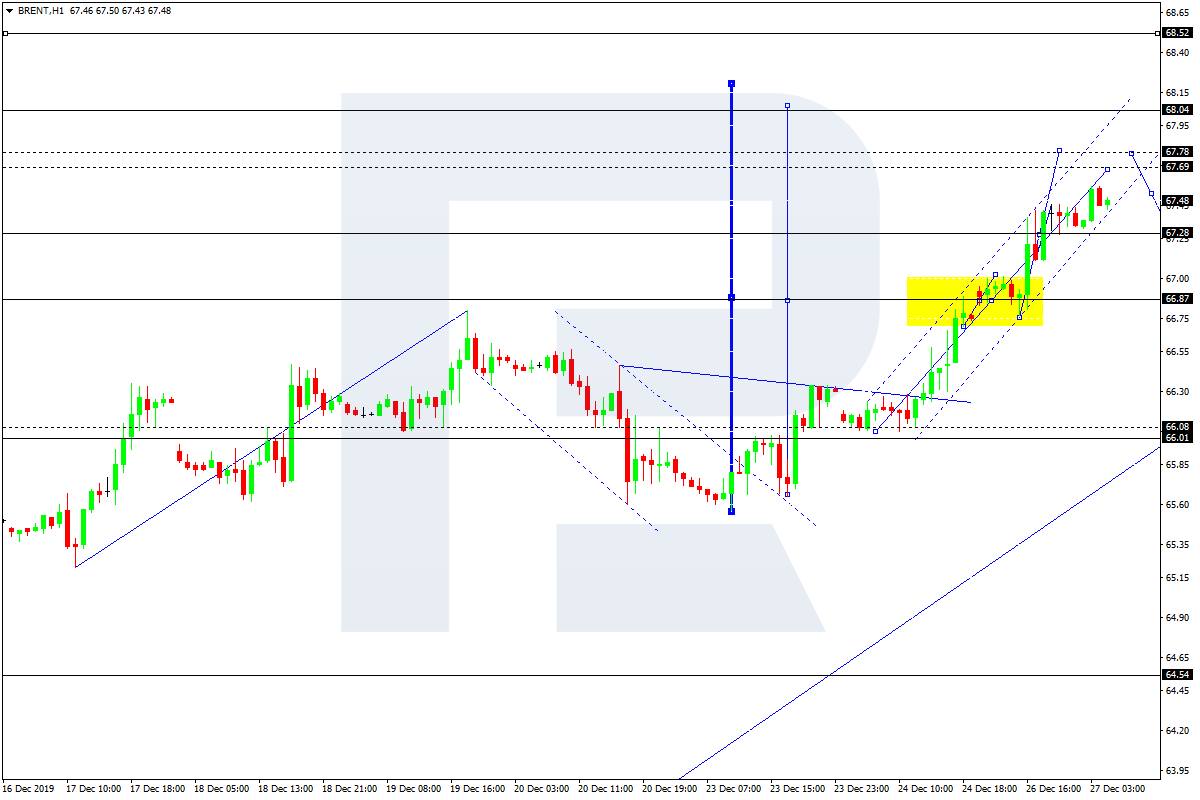
BRENT
After reaching 67.28 and forming an upside continuation pattern, Brent is still moving upwards. Possibly, today the pair may reach 67.77 and then start a new correction towards 67.28. After that, the market may resume trading upwards with the target at 68.04.
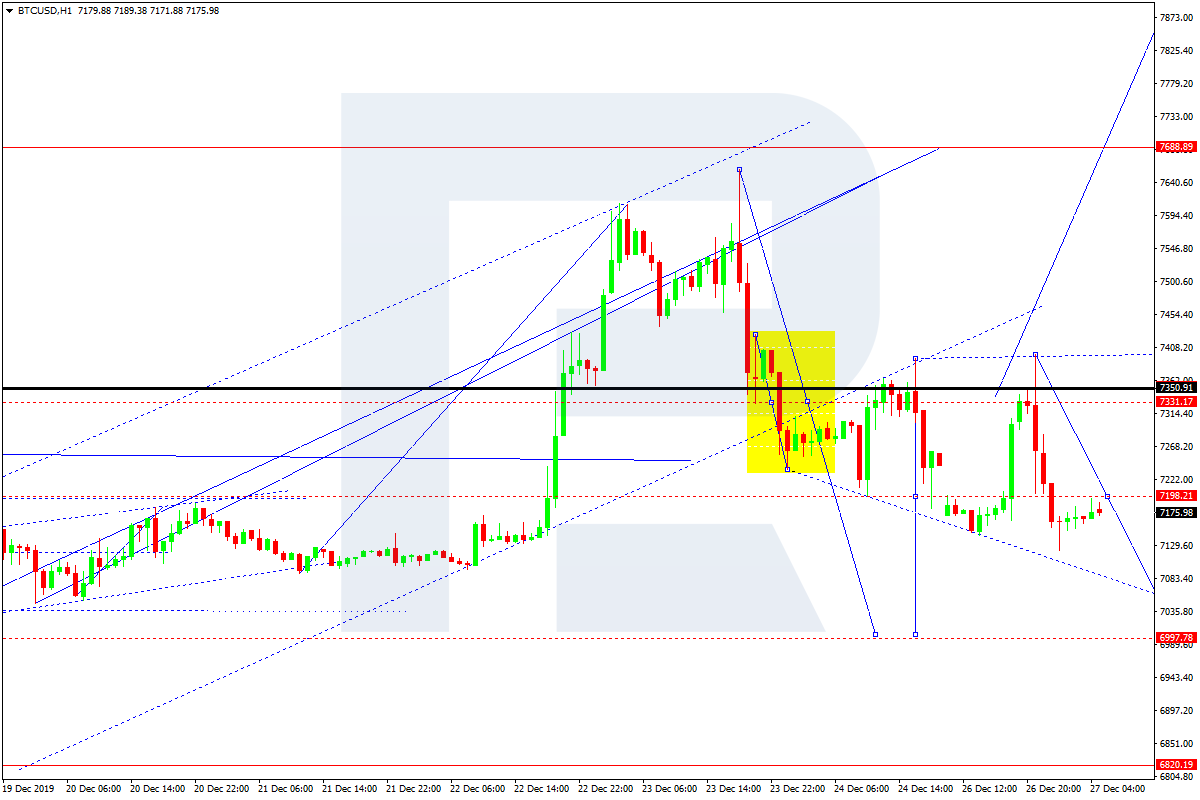
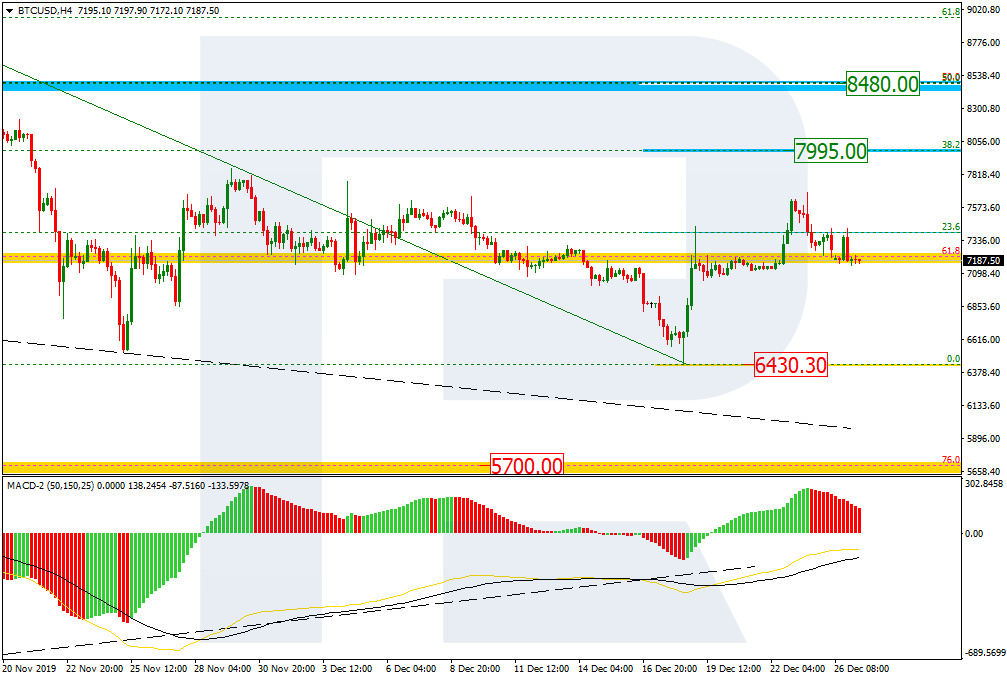
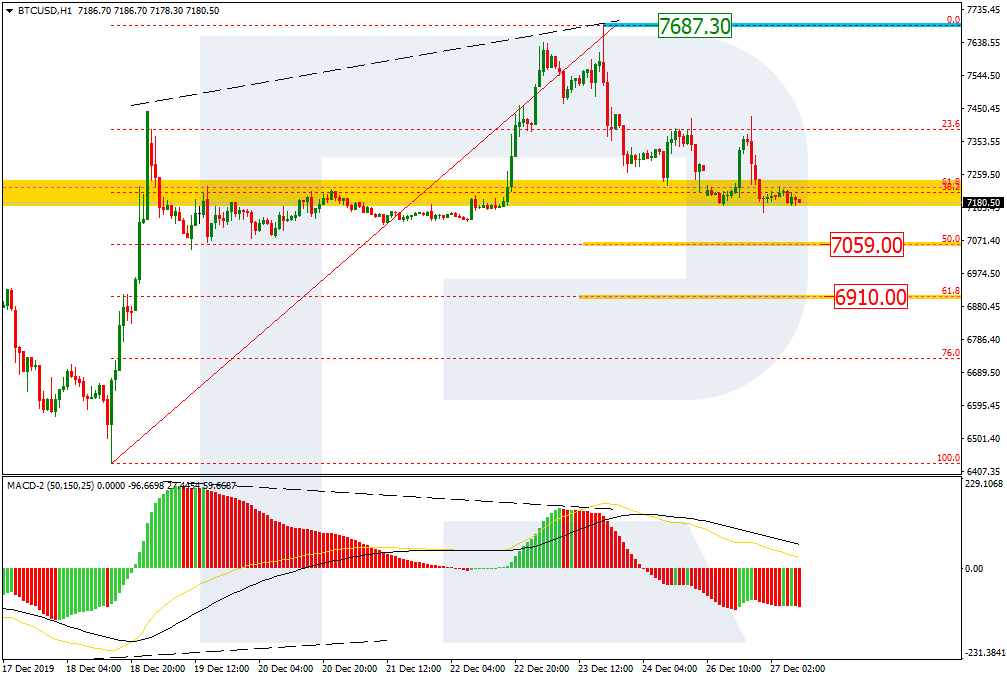
BTCUSD, “Bitcoin vs US Dollar”
BTCUSD has rebounded from 7350.00 downwards; right now, it is still falling to reach 7000.00. Later, the market may resume trading inside the uptrend to return to 7350.00.