Fibonacci Retracements Analysis 12.03.2020 (AUDUSD, USDCAD)
AUDUSD, “Australian Dollar vs US Dollar”
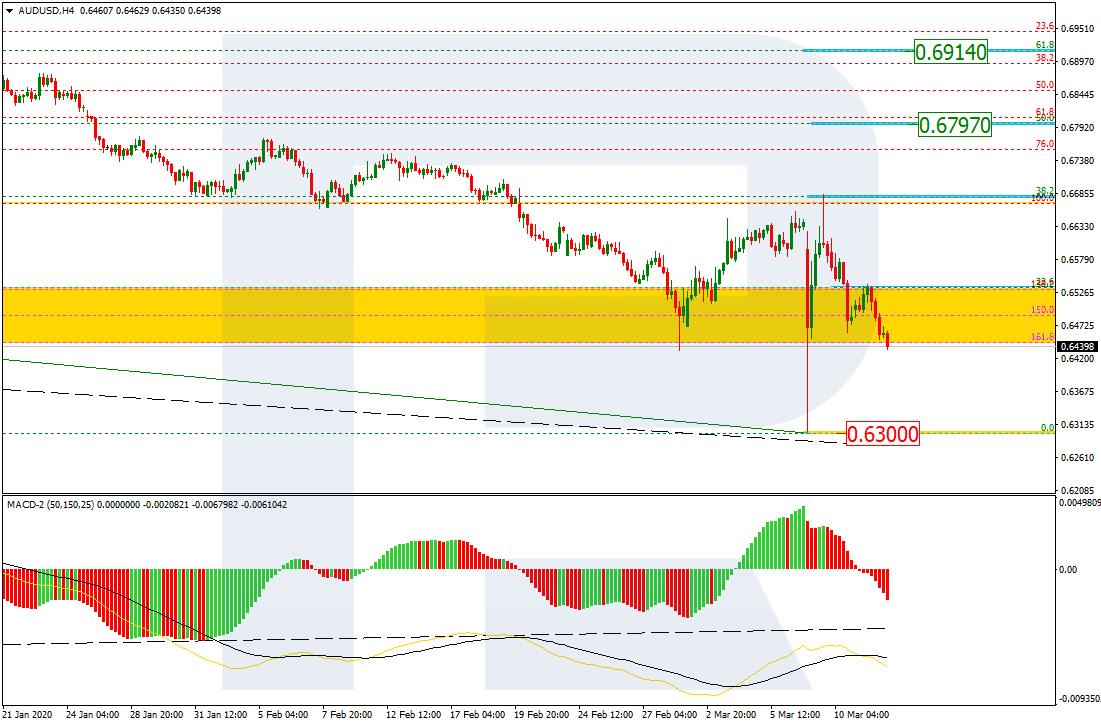
As we can see in the H4 chart, after AUDUSD had finished a quick descending impulse and reached 0.6300, there was a convergence that made the pair start a speedy correctional uptrend, which has already reached 38.2% fibo. The current decline may be considered as a pullback, which may be followed by further mid-term growth towards 50.0% and 61.8% fibo at 0.6797 and 0.6914 respectively.

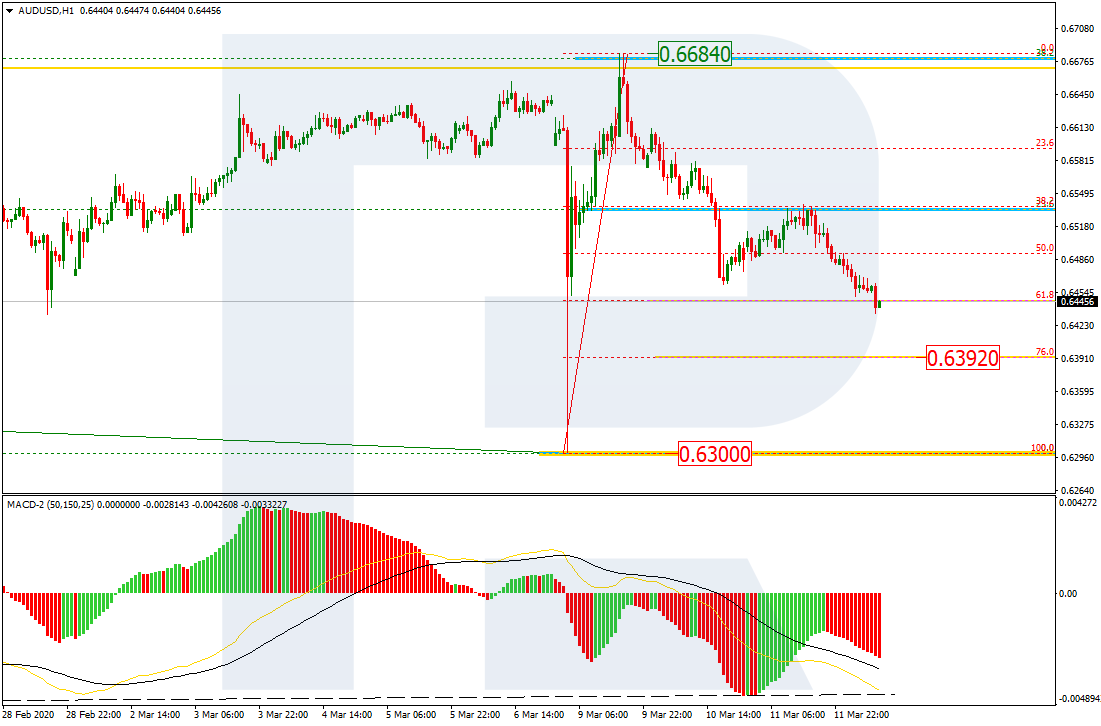
The H1 chart shows that AUDUSD is falling after finishing the rising impulse; right now, it is testing 61.8% fibo and may later reach 76.0% fibo at 0.6392. After that, the instrument may start a new growth towards 0.6684.
USDCAD, “US Dollar vs Canadian Dollar”
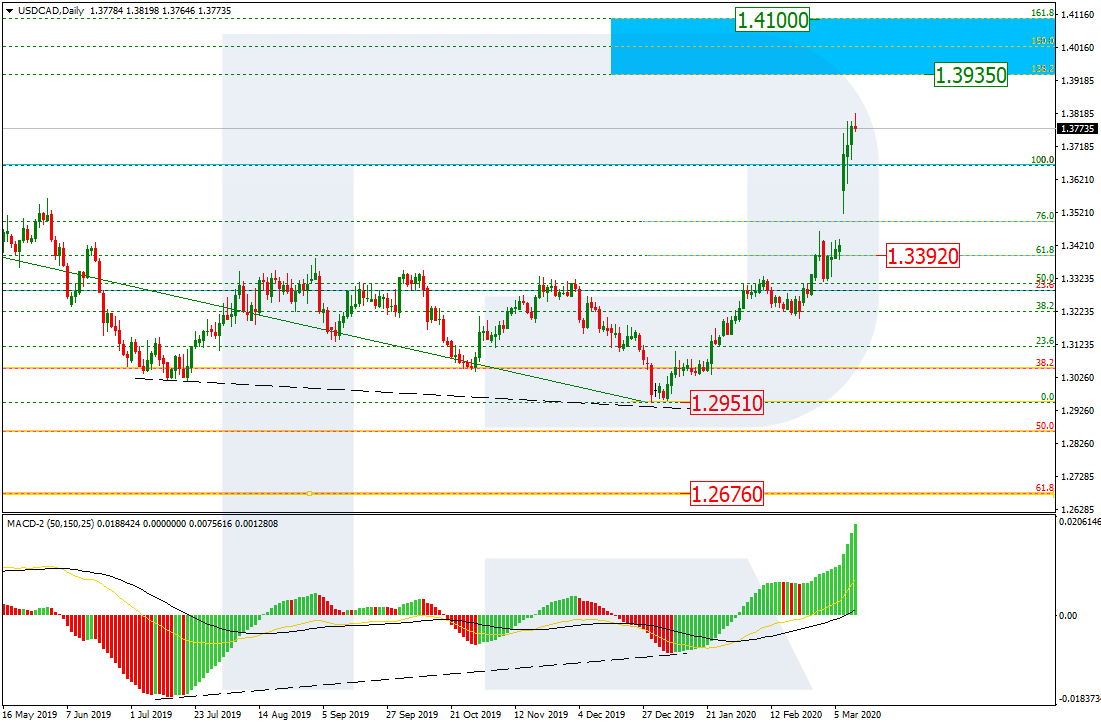
As we can see in the H4 chart, due to a gap, a quick rising impulse has broken the long-term high but failed to eliminate the gap. At the moment, USDCAD is heading towards the post-correctional extension area between 138.2% and 161.8% fibo at 1.3935 and 1.4100 respectively. However, the instrument may yet fall towards 1.3392 to close the gap.
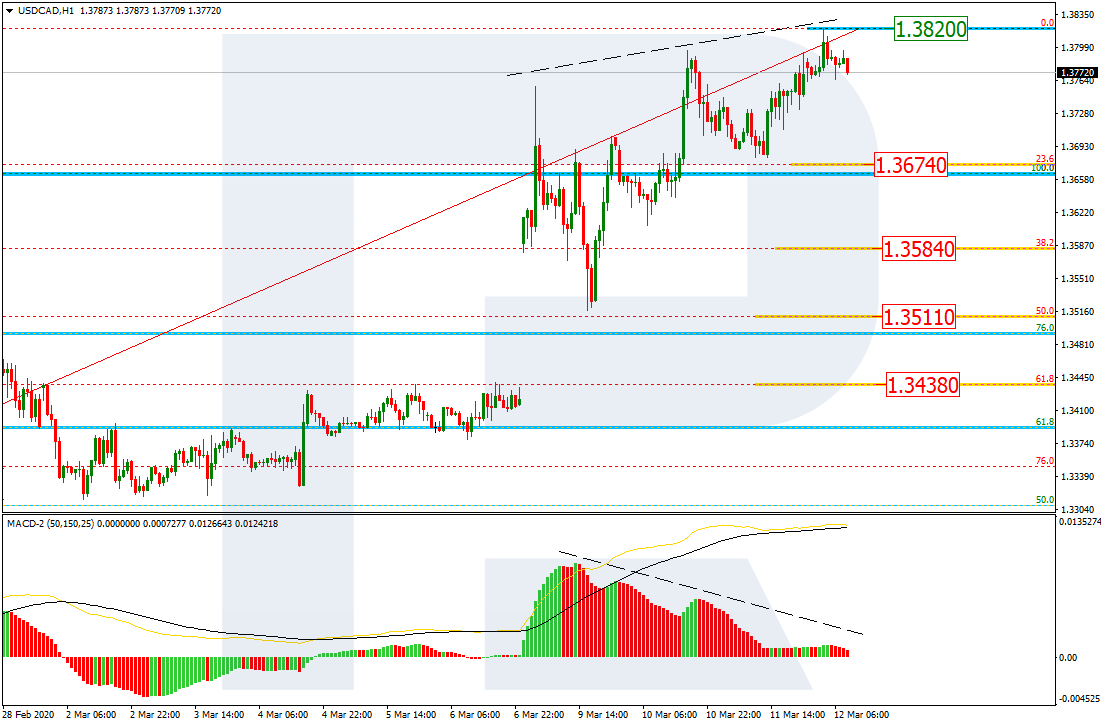
НIn the H1 chart, the divergence made the pair finish the rising tendency, thus indicating a possible pullback. In this case, the price may fall towards 23.6%, 38.2%, 50.0%, and 61.8% fibo at 1.3674, 1.3584, 1.3511, and 1.3438 respectively. the resistance is the high at 1.3820.