Fibonacci Retracements Analysis 15.04.2020 (GBPUSD, EURJPY)
GBPUSD, “Great Britain Pound vs US Dollar”
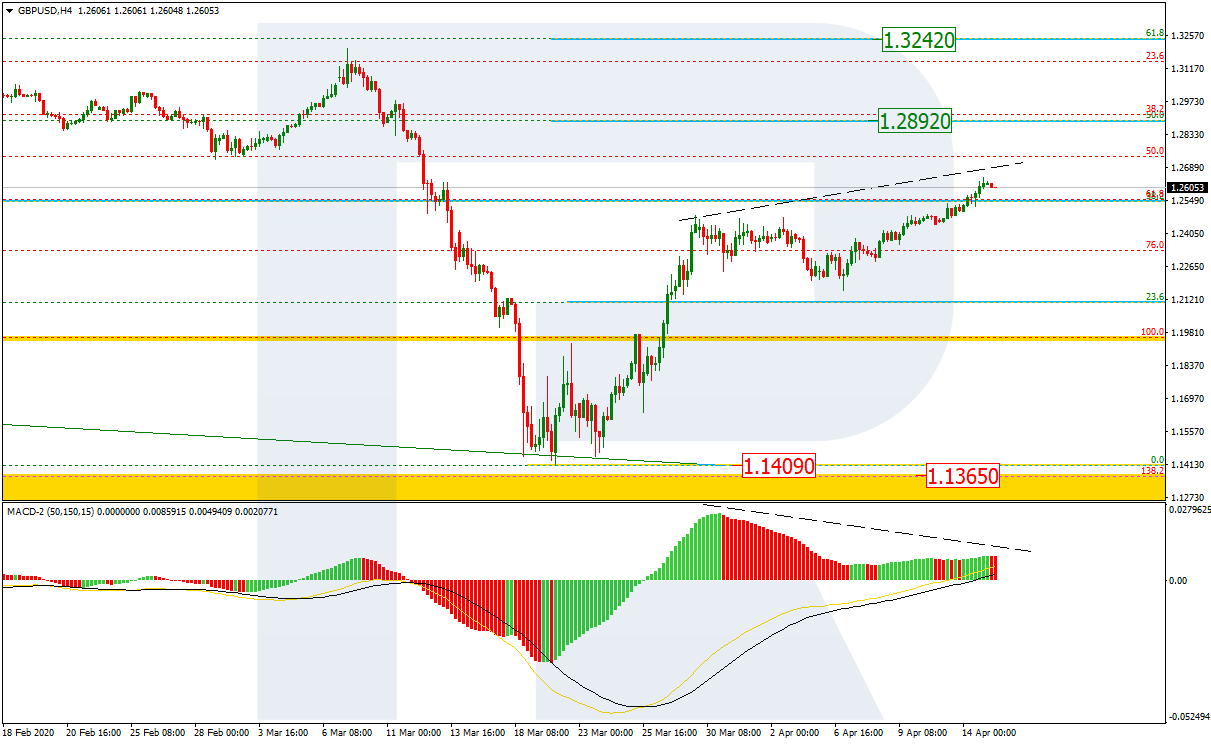
As we can see in the H4 chart, after completing a short-term correction and breaking the local high, GBPUSD has reached 38.2% fibo. The next upside targets may be 50.0% and 61.8% fibo at 1.2892 and 1.3242 respectively, but the current growth is so slow that it may suggest a possible pullback. Another signal to confirm the pullback is a divergence on MACD. If the price breaks the low at 1.1409, the instrument may continue falling towards the post-correctional extension area between 138.2% and 161.8% fibo at 1.1365 and 1.0996 respectively.

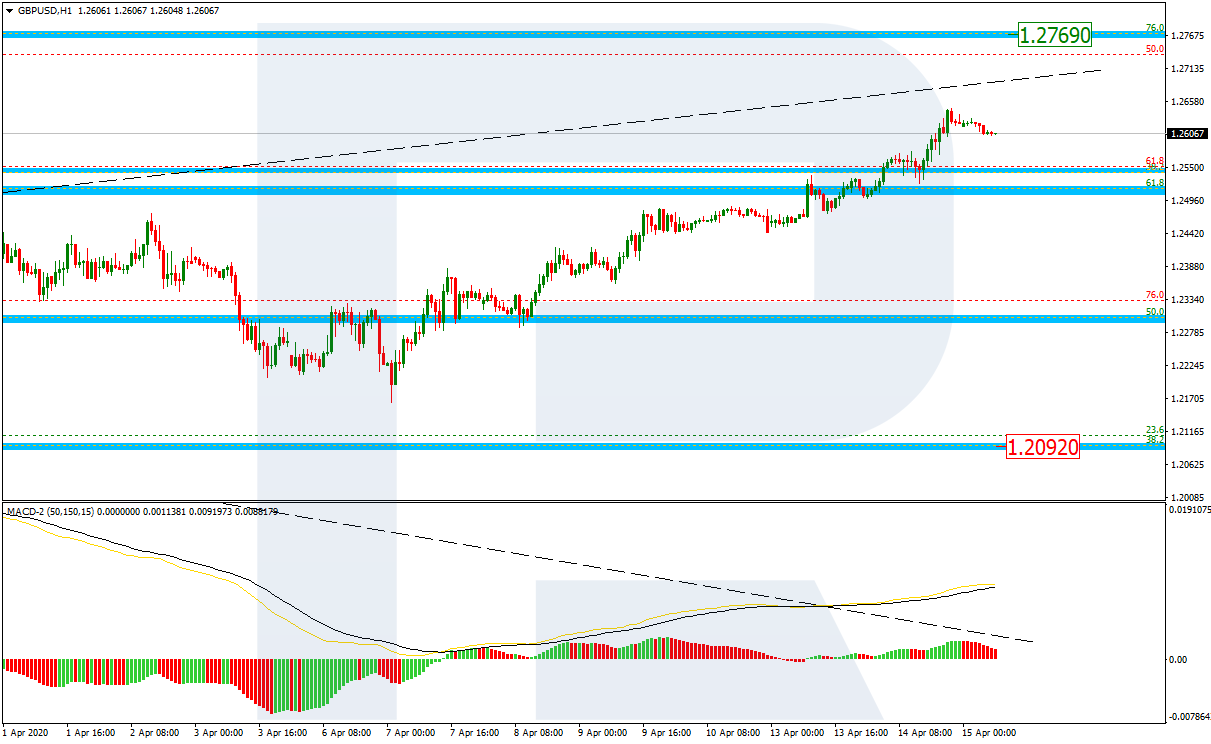
The H1 chart shows a more detailed structure of the rising tendency. The pair is approaching 76.0% fibo at 1.2769. At the same time, there is a divergence on MACD, which may indicate a possible reversal towards 38.2% fibo (1.2092).
EURJPY, “Euro vs. Japanese Yen”
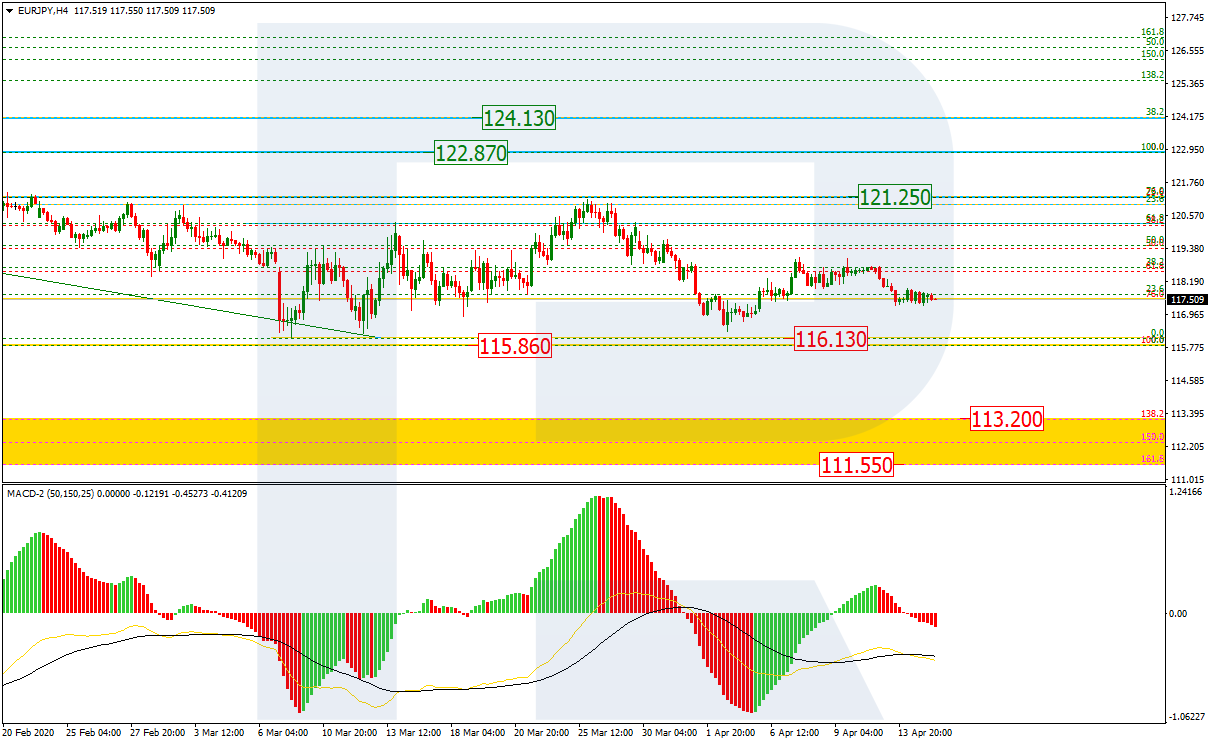
As we can see in the H4 chart, nothing has really changed over the previous week. The pair has failed to reach 76.0% fibo at 121.25; right now, it is failing to break the local low at 116.13 and then the key one at 115.85. If it happens, the instrument may continue trading towards the post-correctional extension area between 138.2% and 161.8% fibo at 113.20 and 111.55 respectively.
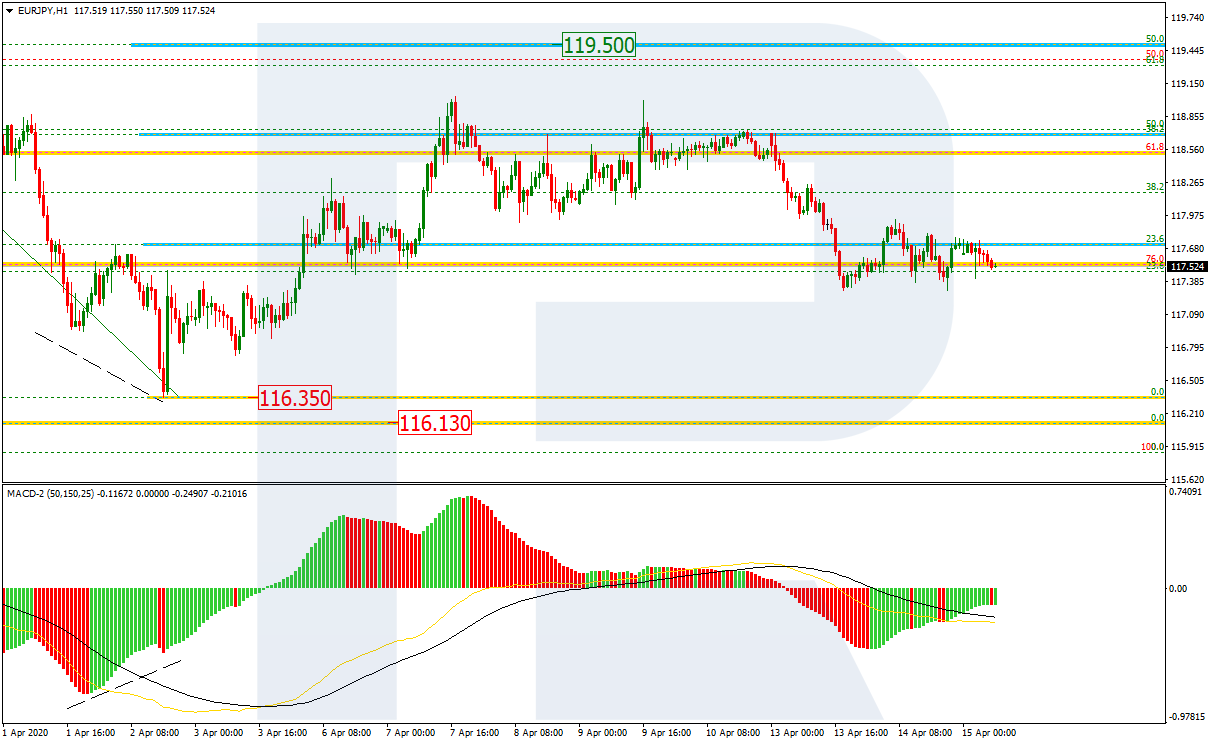
In the H1 chart, the correctional uptrend has reached 38.2% fibo and judging by the structure of the first descending wave the uptrend is very unlikely to reach 50.0% fibo at 119.50 anytime soon. The downside target and the support are the low at 116.35.