Fibonacci Retracements Analysis 18.05.2020 (GOLD, USDCHF)
XAUUSD, “Gold vs US Dollar”
As we can see in the daily chart, after a long test of 76.0% fibo and a breakout of the previous high, XAUUSD is forming a new ascending impulse towards its all-time high at 1920.66. However, attempting to reach and test the target, the instrument is expected to rebound and correct downwards.
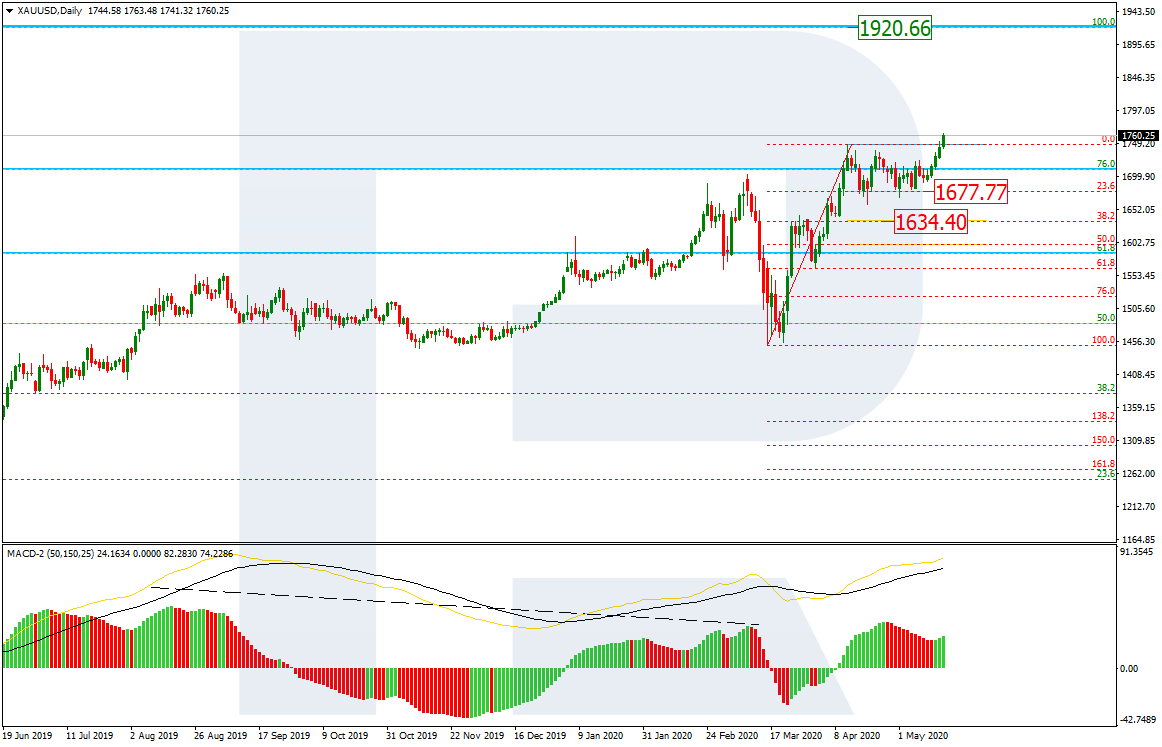

In the H4 chart, after breaking the long-term consolidation range and finishing the descending correction towards 23.6% fibo at 1677.77, the pair has broken the high at 1747.77. The next upside targets may be inside the post-correctional extension area between 138.2% and 161.8% fibo at 1798.90 and 1858.60 respectively. The support is at 1677.77.

USDCHF, “US Dollar vs Swiss Franc”
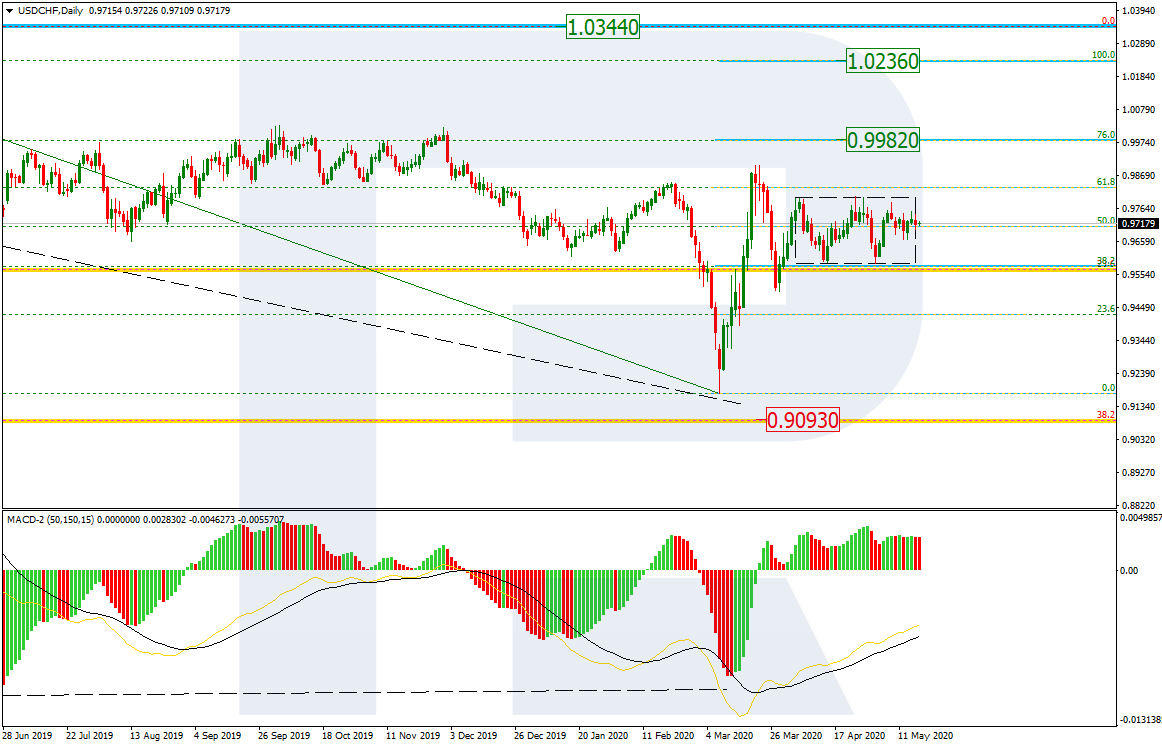
As we can see in the daily chart, USDCHF continues the long-running correction between 38.2% and 61.8% fibo. Since the MACD lines are directed upwards, the price is expected to break the current correction to the upside. The first target will be 76.0% fibo at 0.9982 and then the fractal high at 1.0236.
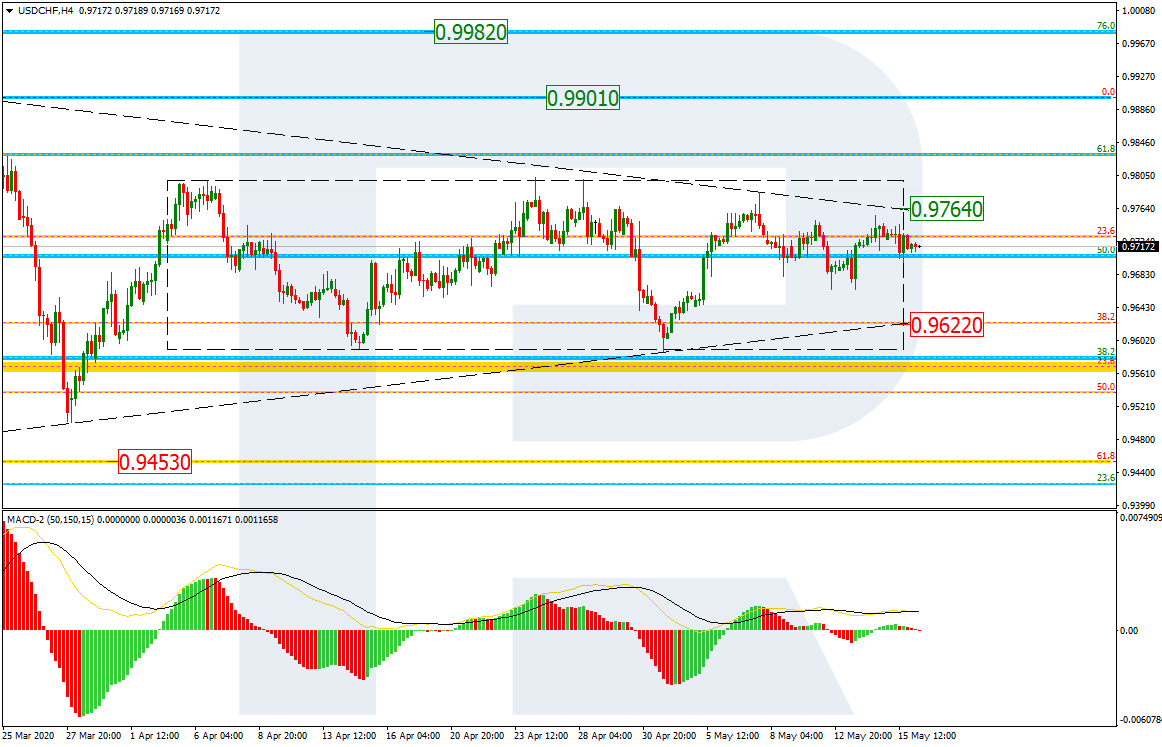
In the H4 chart, the correctional channel is squeezing between the support and resistance levels at 0.9622 and 0.9764 respectively. If the price breaks the support, it may expand the correctional channel down to 61.8% fibo at 0.9453. Otherwise, the pair may start a new growth to reach the high at 0.9901.