Fibonacci Retracements Analysis 23.09.2019 (GOLD, USDCHF)
23.09.2019
XAUUSD, “Gold vs US Dollar”
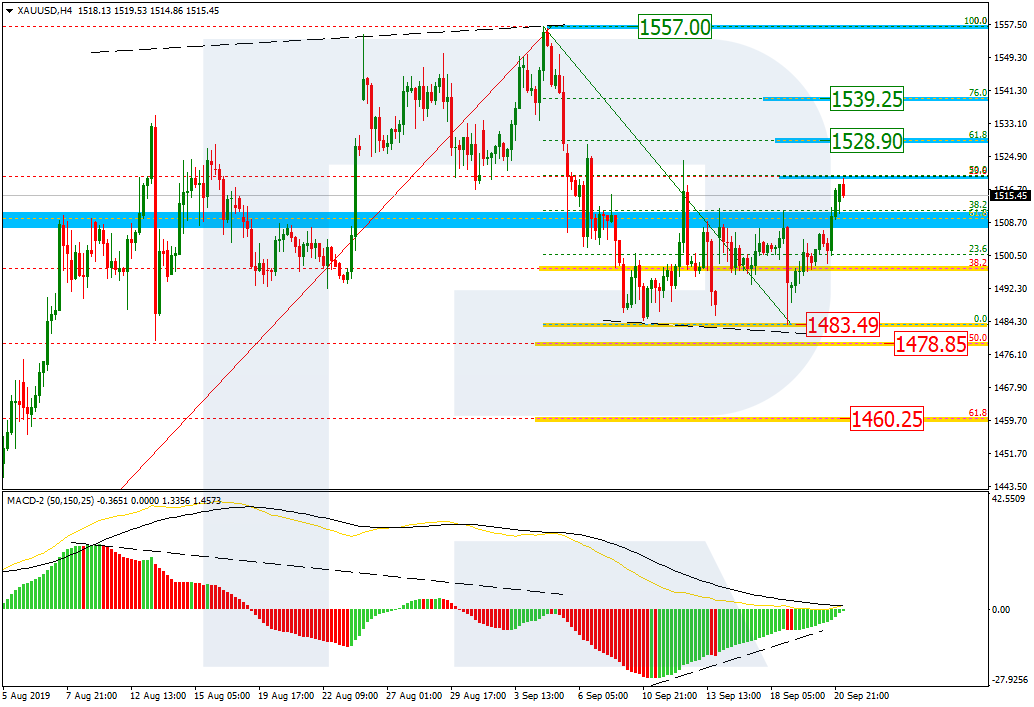
As we can see in the H4 chart, after updating the local low, XAUUSD is back to trading inside the previous correctional range. During the correction, the pair has got very close to 50.0% fibo, but may yet continue moving to reach 61.8% and 76.0% fibo at 1528.90 and 1539.25 respectively. However, if the price breaks the low at 1483.49, the instrument may continue the mid-term descending tendency towards 50.0% and 61.8% fibo at 1478.85 and 1460.25 respectively.

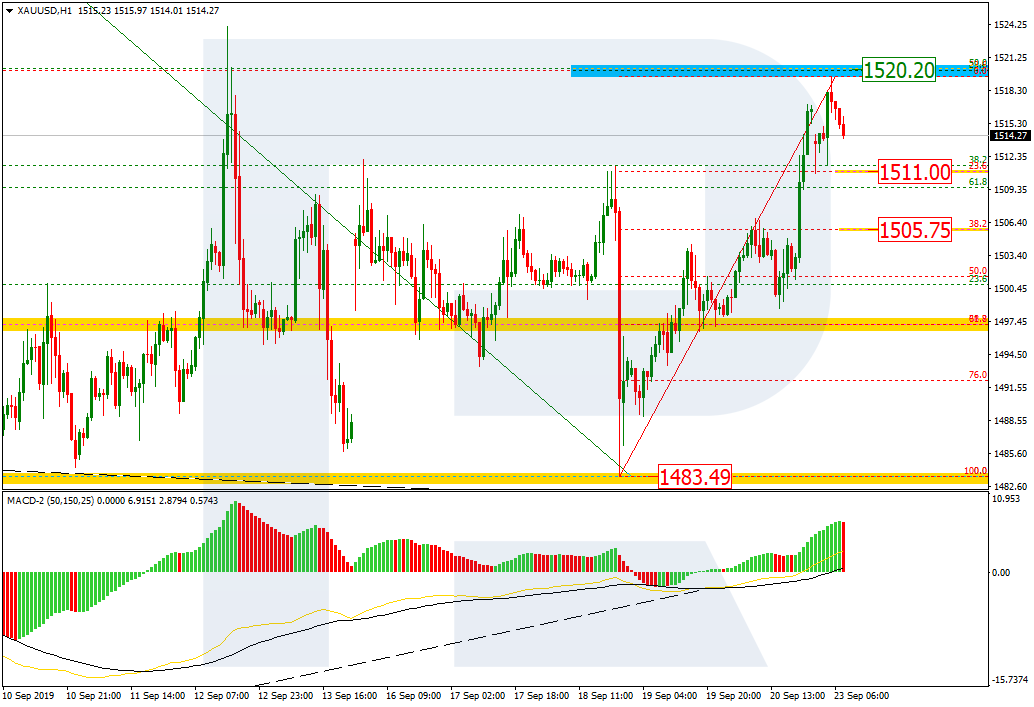
In the H1 chart, after testing 50.0% fibo at 1520.20, the pair may start a new short-term pullback. The targets may be 23.6% and 38.2% fibo at 1511.00 and 1505.75 respectively.
USDCHF, “US Dollar vs Swiss Franc”
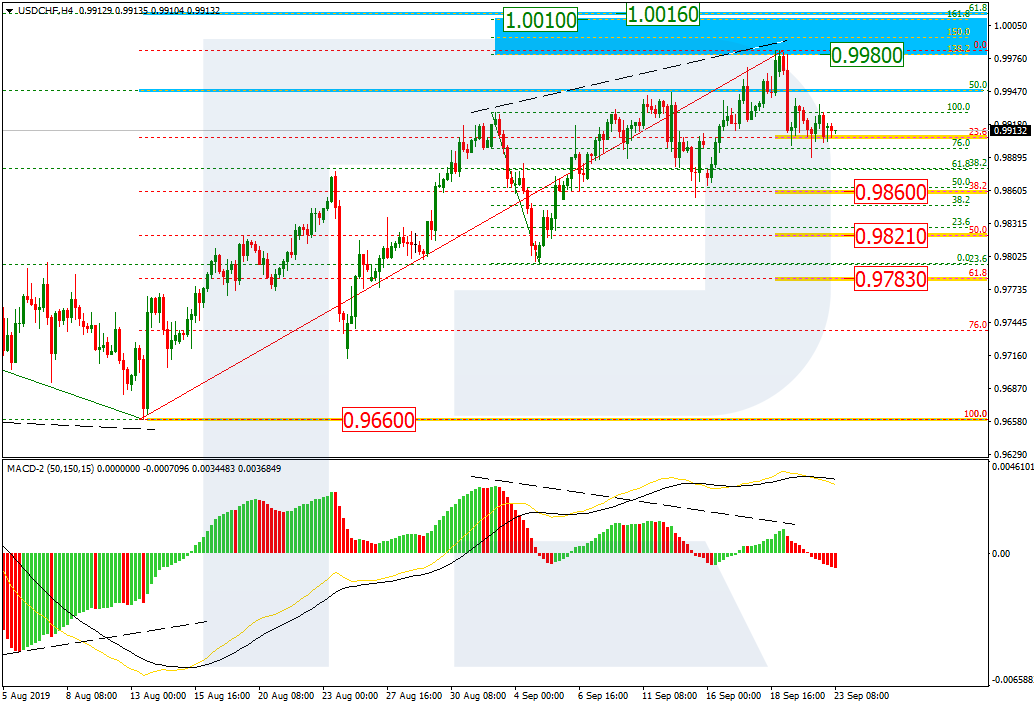
As we can see in the H4 chart, the divergence made the pair reverse after it tested the post-correctional extension area between 138.2% and 161.8% fibo at 0.9980 and 1.0010 respectively. By now, USDCHF has already reached 23.6% fibo and may continue falling towards 38.2%, 50.0%, and 61.8% fibo at 0.9860, 0.9821, and 0.9783 respectively.
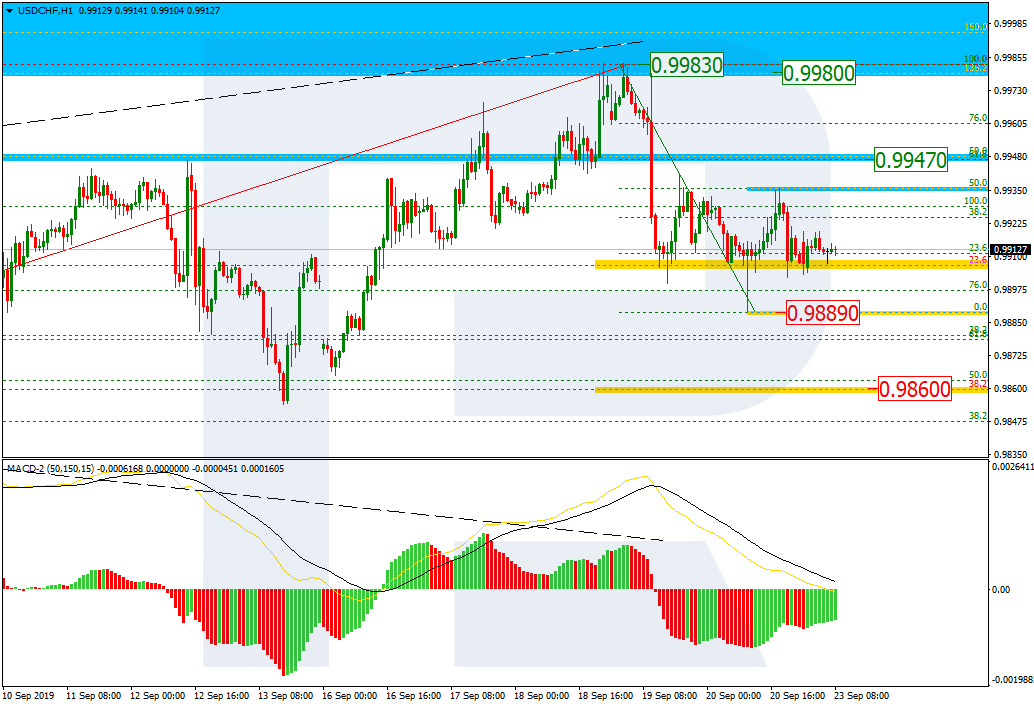
In the H1 chart, after reaching mid-term 23.6% fibo, USDCHF is correcting and has already reached 50.0% fibo. If the price breaks the local low at 0.9889, the instrument may continue falling.