30.10.2019
GBPUSD, “Great Britain Pound vs US Dollar”
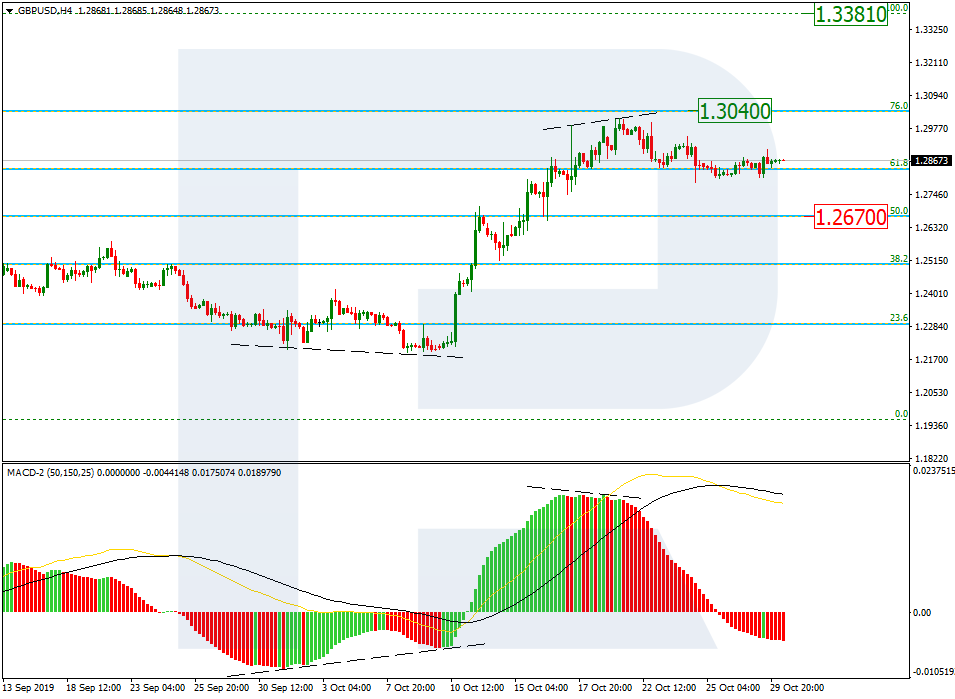
As we can see in the H4 chart, there was a divergence on MACD, which made GBPUSD complete the rising wave at 76.0% fibo at 1.3040 and start a new pullback. The support is at 1.2670. after completing the correction, the instrument may start another rising impulse to reach the previous high at 1.30450 and then the key one at 1.3381.

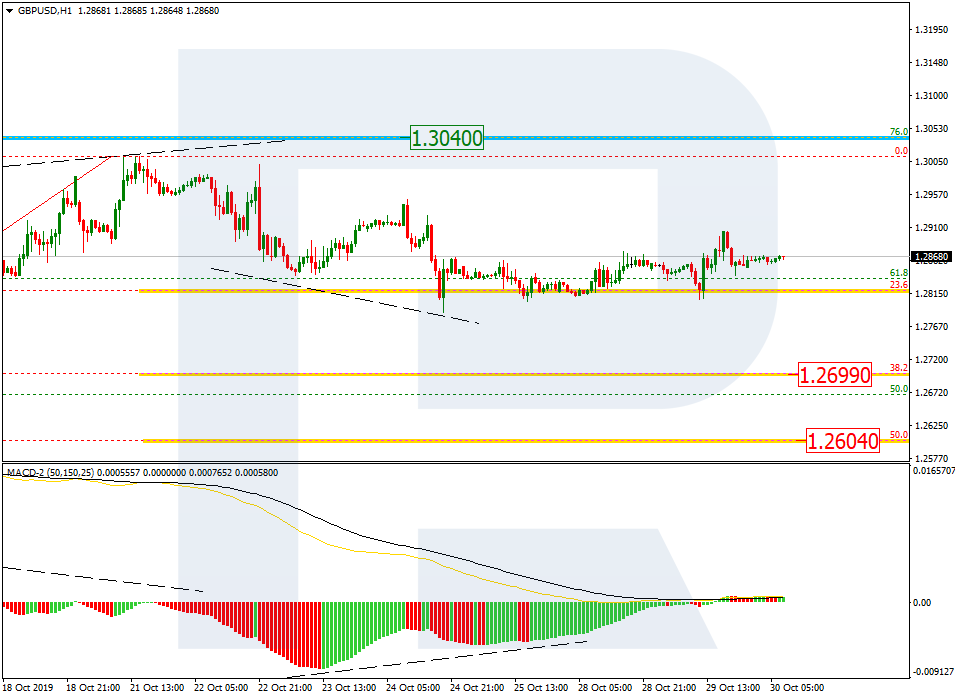
The H1 chart shows more detailed structure of the current descending correction after the divergence. The pair has already reached 23.6% fibo, but may yet continue falling towards 38.2% and 50.0% fibo at 1.2699 and 1.2604. at the same time, there is a short-term convergence, which is slowing down the current decline.
EURJPY, “Euro vs. Japanese Yen”
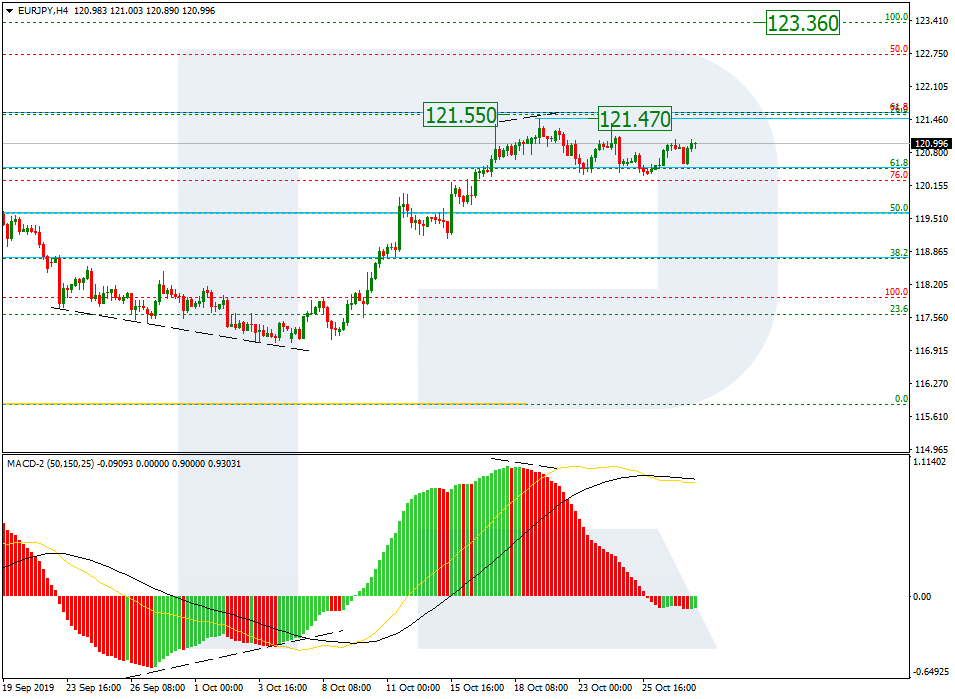
As we can see in the H4 chart, there was a divergence on MACD, which made EURJPY finish the ascending wave at 76.0% fibo at 121.55 and start a new sideways movement. If the price breaks the resistance at 121.27 the pair may resume growing. The key target is the high at 123.36.
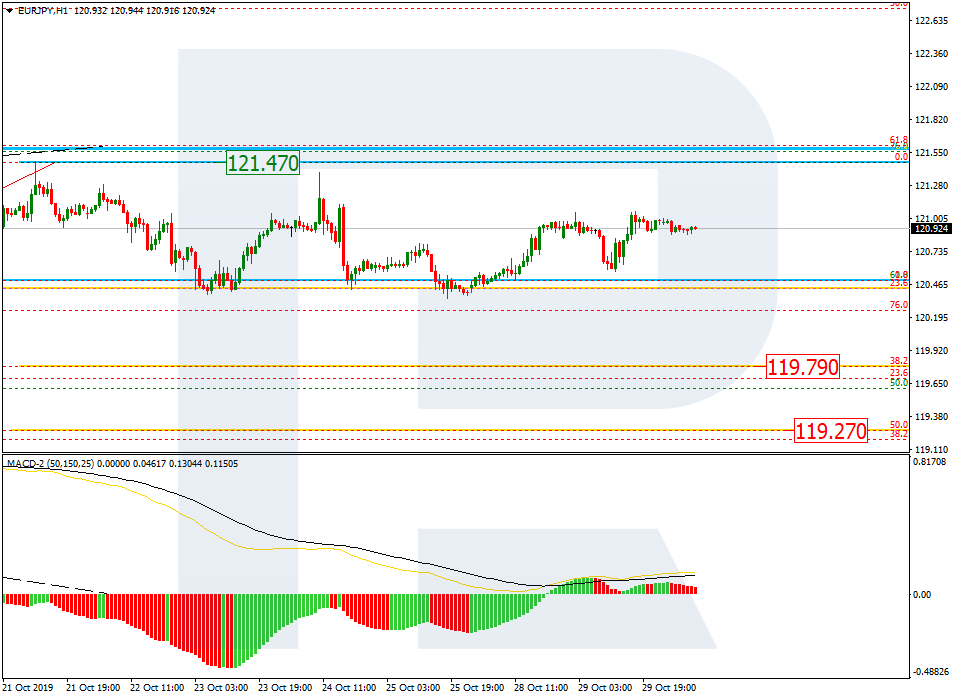
In the H1 chart, the pair has reached 23.6% fibo. In the future, the instrument may continue falling towards 38.2% and 50.0% fibo at 119.79 and 119.27 respectively.