|
If you’ve been trading the Forex market for a while you’ve probably had the painful experience of buying right at the top or selling right at the bottom.
Equally bitter, is the experience of closing a position on a whipsaw spike, only to watch the price go in your original direction for another 100 or 200 pips without you. Both of these situations are a trader’s nightmare, and even experienced traders can fall victims from time to time. |

|
Without further ado let’s get into the strategy.
How Does the Tall Candle Reversal Strategy Work?
1st condition is:
A significantly larger candle needs to be formed on the chart (at least 2 – 3 times larger than the bars preceding it).
Keep in mind, this situation is even better felt live than explained or noticed on a historical chart. The sudden huge spike in volatility and wild price action in those moments are what usually characterizes such a spiking candle.
The reasons for these kinds of wild price action are usually a surprise in the fundamentals of the currency pair or a panic among traders hence a sharp move is triggered.
2nd condition:
We are looking to see whether the gains, or the losses caused by the big candle stick are reversed.
3rd condition:
The 50% retracement needs to be broken on a close.
We measure the 50% point of the tall candle (from its high to its low) which acts as the trigger point for a trade. Very often the 50% retracement of tall candles acts as support or resistance and once it’s broken it usually means that the whole candle will be erased soon.
Entry signal:
Long: Buy on a close above the 50% Fib retracement (in this case we trade a tall red candle that is reversed to the upside).
Short: Sell on a close below the 50% Fib retracement (in this case we trade a tall green candle that is reversed to the downside).
It’s even better if the break of the 50% retracement occurs on strong momentum which will just help to confirm the reversal.
Stop-Loss:
Long: Below the low of the tall bar
Short: Above the high of the tall bar
Profit-Targets:
Support and resistance on larger timeframes or trailing Stop-Loss to ride the trend
Why this Strategy Works?
Further, all the traders that got in on the spike have their Stop-Losses behind the spike and now when those Stop-Losses are taken out it creates an additional squeeze contrary to the direction of the tall candle and in the direction of the trend.
Most often, if it’s going to be reversed, the tall candle will not close near the highs (in an uptrend) or near the lows (in a downtrend). But instead, it will have a reasonably long wick, or even better a very long wick. Of course, the longer the wick the stronger the reversal signal.
This strategy tends to work even better if a strong trend precedes the big candle in the contrary direction (as is the case on the EURUSD example below).
Trade Examples
On this 15-minute EURUSD chart, we can see a strong uptrend from left to right on the chart with the tall candle in the middle. The tall bearish candle engulfs the 70 previous bars on the close and 80 previous bars when its wick is taken into account. That’s quite a shock given the uptrend that was in place before it.
However, the whole shock, the spike, and the tall candle are just a fake-out. Imagine how many Stop-Losses of traders who were riding the uptrend were taken out!
Eventually, in such situations, as is evident from the following chart, the fake move is quickly and completely reversed and the uptrend continues at about the same pace.

High Probability Tall Candle Reversal Forex Strategy
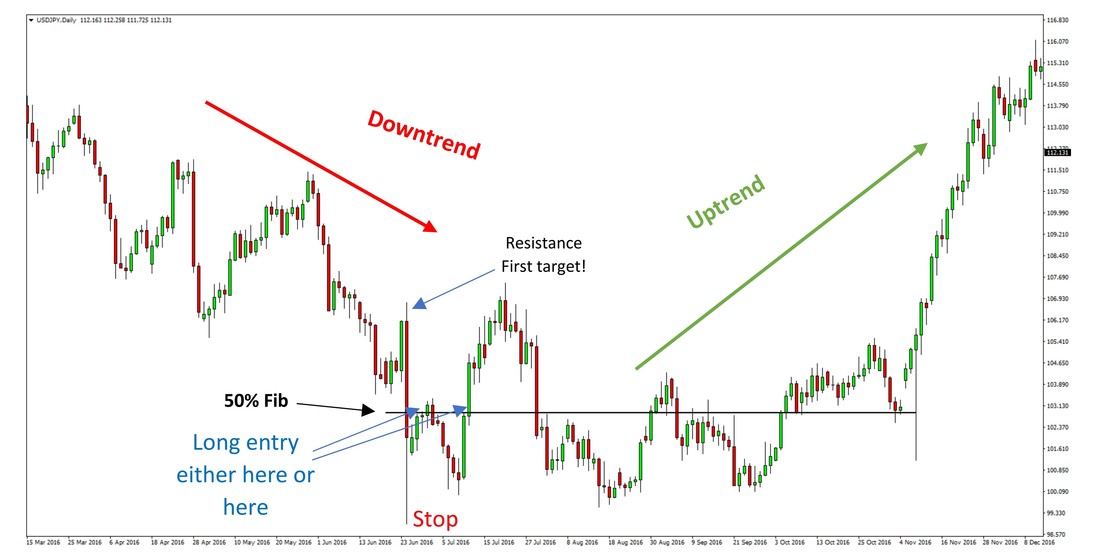
This USDJPY daily chart is a striking example of this pattern in action.
Namely, the low reached here is on Brexit day, right in the aftermath of the vote which triggered a broad risk-off move in markets and as a result, USDJPY fell all the way to 99 from 106. A 700 pips move in a matter of hours, and yet it turned out to be a multi-month low as is apparent now in 2017.
However, upon closer inspection, again, the 50% retracement of the tall candle acted as resistance and as the key level for the reversal later. The 50% line was first penetrated without a decisive close above it, and as a result the market went for another retest of lower levels. However, even the fact that the price reached the 50% level is significant by itself.
Though, the final confirmation for the trade comes on the second push above the 50% line with a decisively tall green candle. The full reversal of the tall candle to the upside is just a matter of time now.
Note that in this example, in contrast to the EURUSD example, the tall red bar came after a downtrend!
Hence, the difficulty of the market erasing it and the time it needed to march higher on the new uptrend can be attributed largely to the previous overall trend which was down.

High Probability Tall Candle Reversal Forex Strategy