|
The MACD is a technical indicator designed for trend trading the markets and as a result, there are many trend trading strategies based on the MACD indicator. In our strategy here, however, we will use a few other indicators in addition to the MACD in order to ensure a higher rate of profitable trades.
So, there is no need to do much price action reading with this strategy, although that is certainly always beneficial. The set of indicators used in this strategy provide all the information needed for it to work. |

|
- MACD (with histogram) – the default indicator in MetaTrader 4
- Parabolic SAR – also included in MetaTrader 4 by default
- ATR (Average True Range) – A volatility indicator also included in MetaTrader 4
The Parabolic SAR was specifically created to provide better stop levels and better stop management. In this strategy, we use it for placing the stop and also as a confirmation tool for entering trades.
Entry rules:
- Enter long when the MACD histogram (in these examples shaded area with green vertical lines) crosses above the zero level and when the signal line (red line in these examples) enters inside of the histogram.
- At the same time, the Parabolic SAR indicator should be bullish. That is the blue dots on the charts shown here should be below the price at the point of a long entry. If the parabolic SAR gives a contrary signal with the dots being above the price then there are no conditions for a trade to be taken according to this strategy.
- Always keep an eye on important support and resistance levels on higher timeframes and make sure there are no significant obstacles in the way of the trade. For example, if you take the trade from the 4h chart, check where important support and resistance levels are on the daily, weekly and monthly timeframes.
For best results, the MACD histogram should be above the zero level and the crossover of the signal line should happen at the same time as the Parabolic SAR reversal from bearish to bullish.
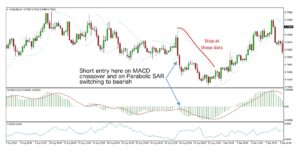
The same applies for short entries only in the opposite direction.

MACD Trend Forex Trading Strategy
Stop Loss Placement:
In order to avoid whipsaws and premature stop outs, it’s even better to use the dots of the Parabolic SAR as a stop on the close of the session, rather than simply to be taken out if price touches this level. However, currently, there is no such default feature in the popular MetaTrader 4 platform, although it can be done by using an expert advisor.
In the case of a stop out because of a volatility spike, it is acceptable to reenter again in the trade if the entry conditions are still in place.
Additionally, you can use the MACD indicator to aid your trade management.

MACD Trend Forex Trading Strategy
Targets and Take Profits
If there is a strong price reaction off a support or resistance zone it is wise to close the full position.
Additionally, if there is no support or resistance zone on the way you can use the ATR to take profits based on the average trading range for a given timeframe. 1xATR, 2xATR and 3x the ATR are good profit targets.
It’s best to take partial profits for example 1/3 at 1x ATR then 2/3 at 2xATR and the last third at 3x the value of the ATR.
Make sure there is at least a 1:2 risk-reward ratio where the risk is the stop according to the Parabolic SAR and the reward is the target based on support/resistance or the ATR.
To see how we can combine support and resistance we’ll use a zoomed-out 4h chart to demonstrate this situation. The support level was an important technical zone on the daily and weekly timeframes.

MACD Trend Forex Trading Strategy