Fibonacci Retracements Analysis 02.03.2020 (GOLD, USDCHF)

Fibonacci Retracements Analysis 02.03.2020 (GOLD, USDCHF)

02.03.2020

XAUUSD, “Gold vs US Dollar”

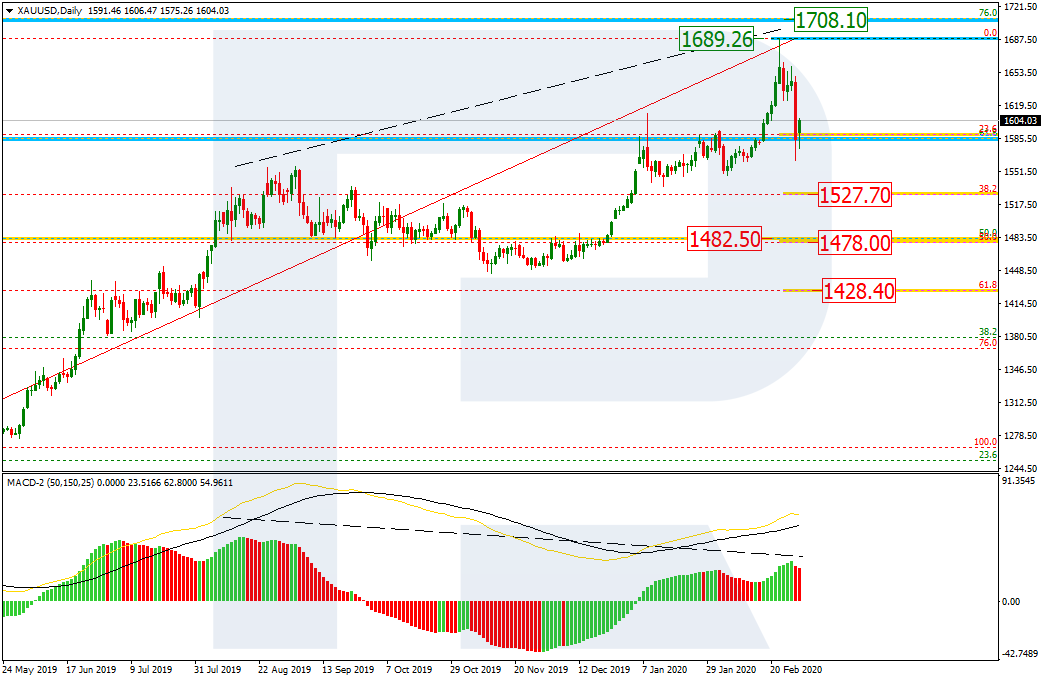
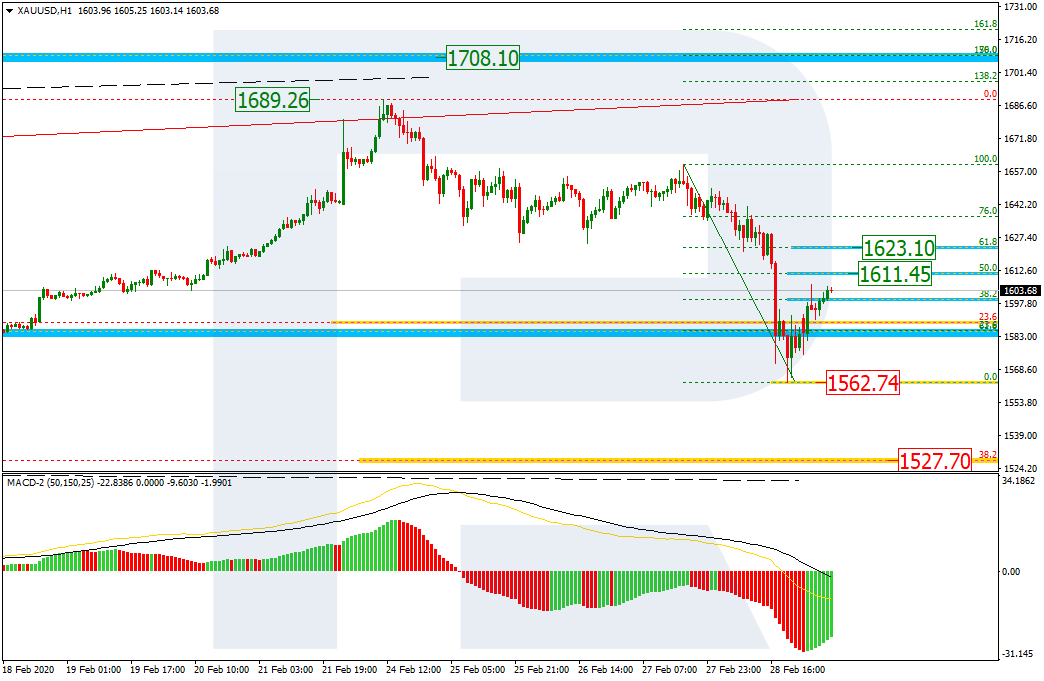
As we can see in the daily chart, XAUUSD has failed to reach the long-term high at 76.0% fibo (1708.10): there was a divergence on MACD, which made the pair reverse and start a new decline. After reaching 23.6% fibo, the descending movement may continue towards 38.2%, 50.0%, and 61.8% fibo at 1527.70, 1478.00, and 1428.40 respectively. At the same time, one should realize that if the price breaks the long-term support at 50.0% fibo (1482.50), it will confirm the long-term trend reverse. The resistance is the high at 1689.26.

GOLD_D1
Risk Warning: the result of previous trading operations do not guarantee the same results in the future

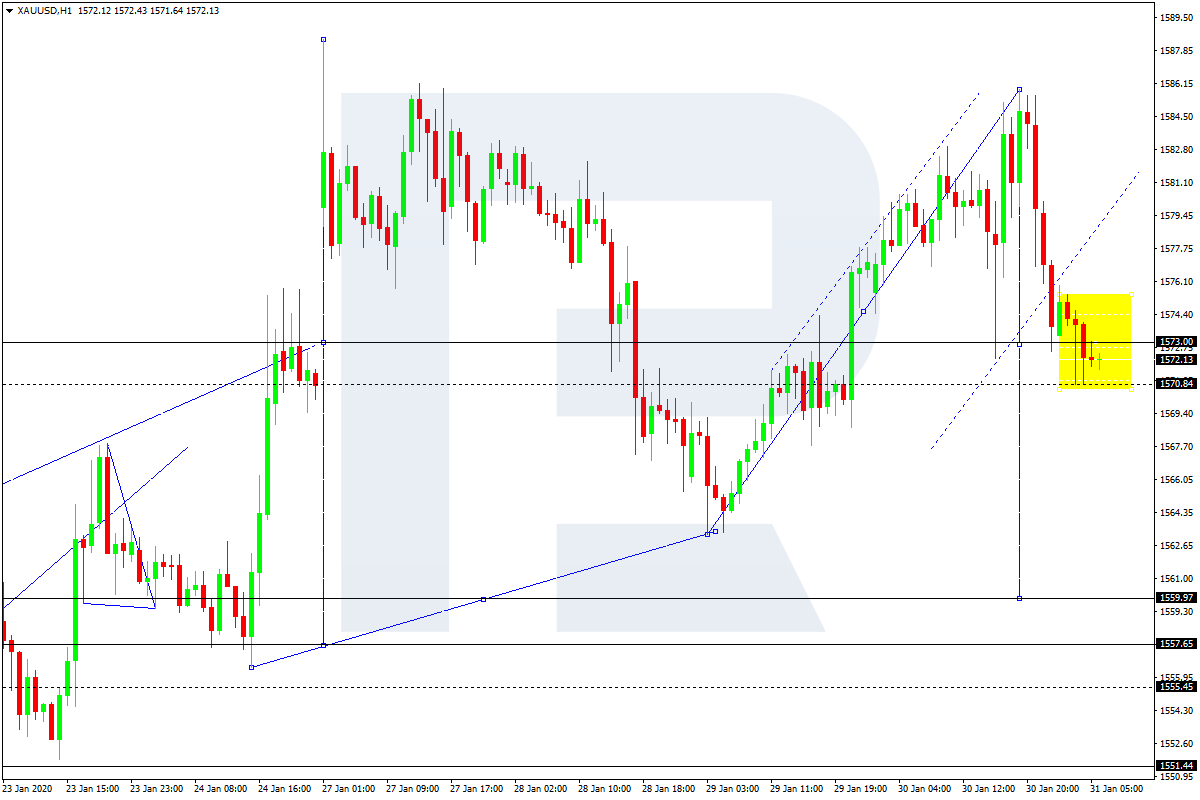
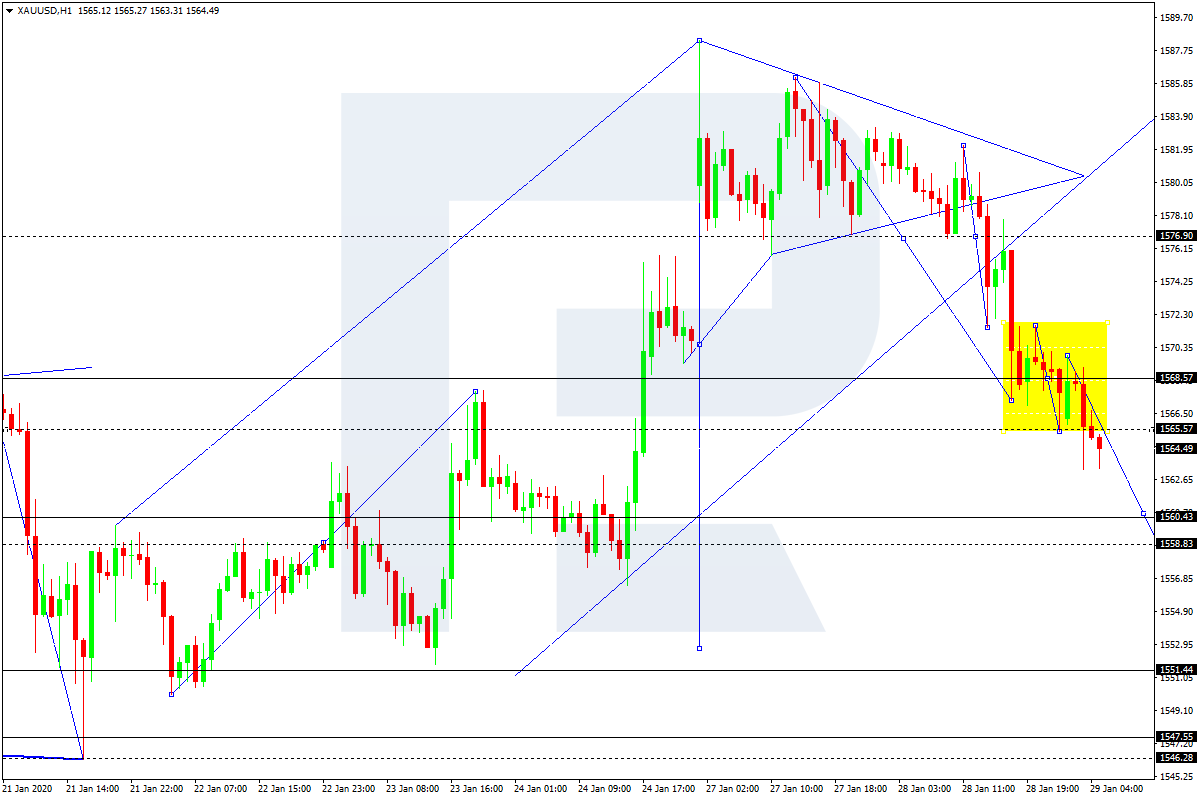
In the H1 chart, the pair is correcting upwards; it has already reached 38.2% fibo, and may continue towards 50.0% and 61.8% fibo at 1611.45 and 1623.10 respectively. After the price breaks the support at 1562.74, the instrument may resume its mid-term downtrend towards 38.2%fibo at 1527.70.

GOLD_H1
Risk Warning: the result of previous trading operations do not guarantee the same results in the future

USDCHF, “US Dollar vs Swiss Franc”

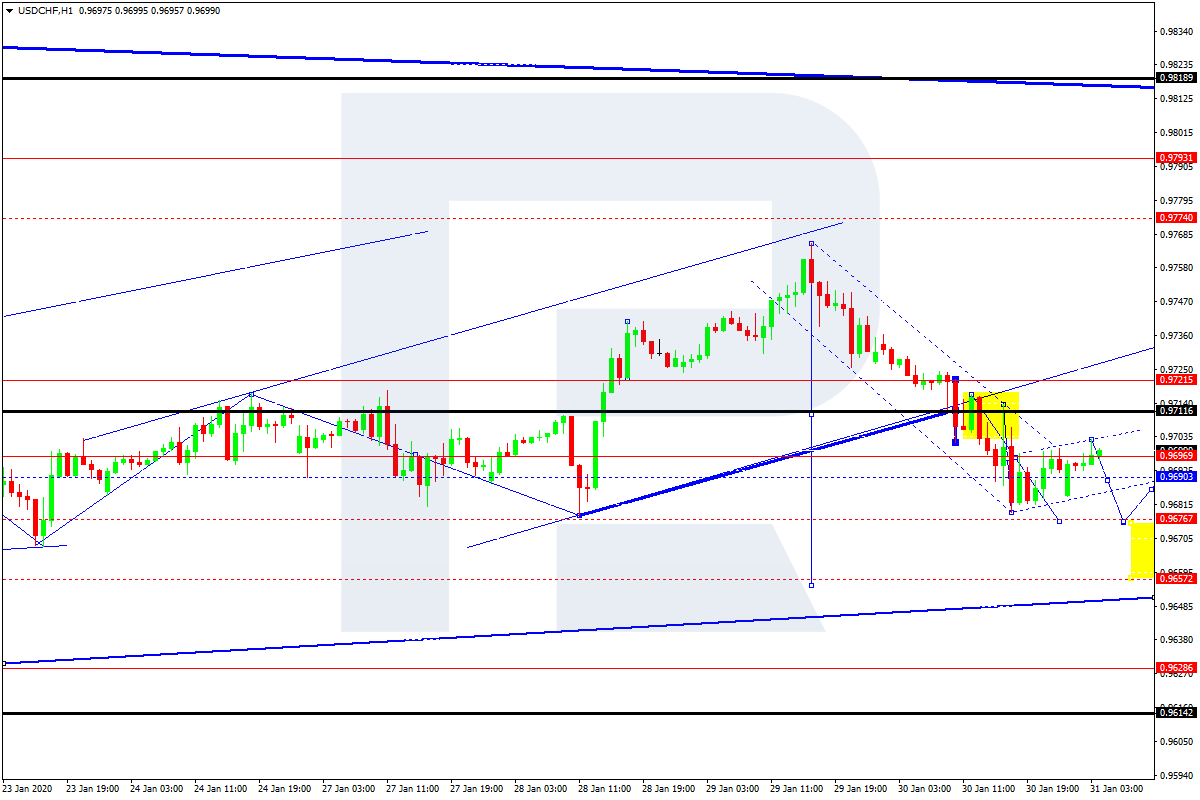
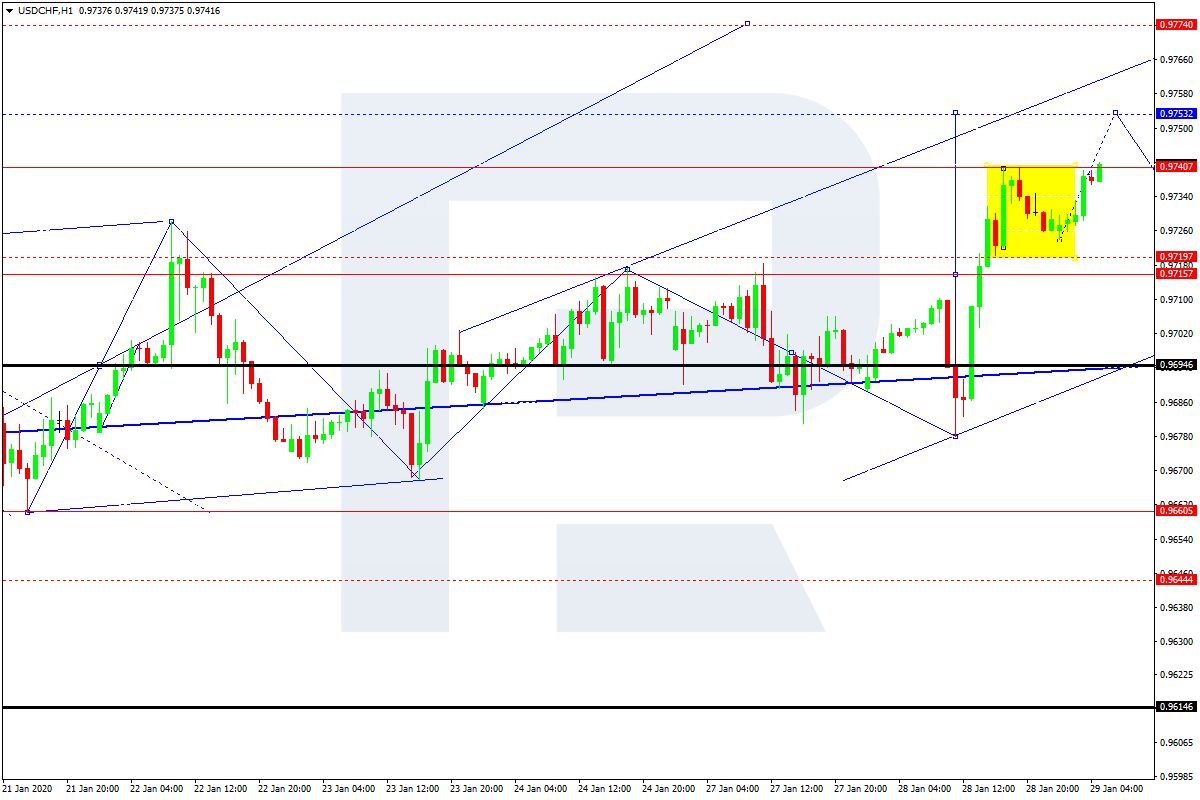
As we can see in the H4 chart, the divergence on MACD made the pair reverse after reaching 50.0% and start a new descending movement, which has already reached the long-term low at 0.9613. Right now, the price is testing the low and may break it. In this case, USDCHF may continue falling towards the post-correctional extension area between 138.2% and 161.8% fibo at 0.9523 and 0.9468 respectively.

USDCHF_H4
Risk Warning: the result of previous trading operations do not guarantee the same results in the future

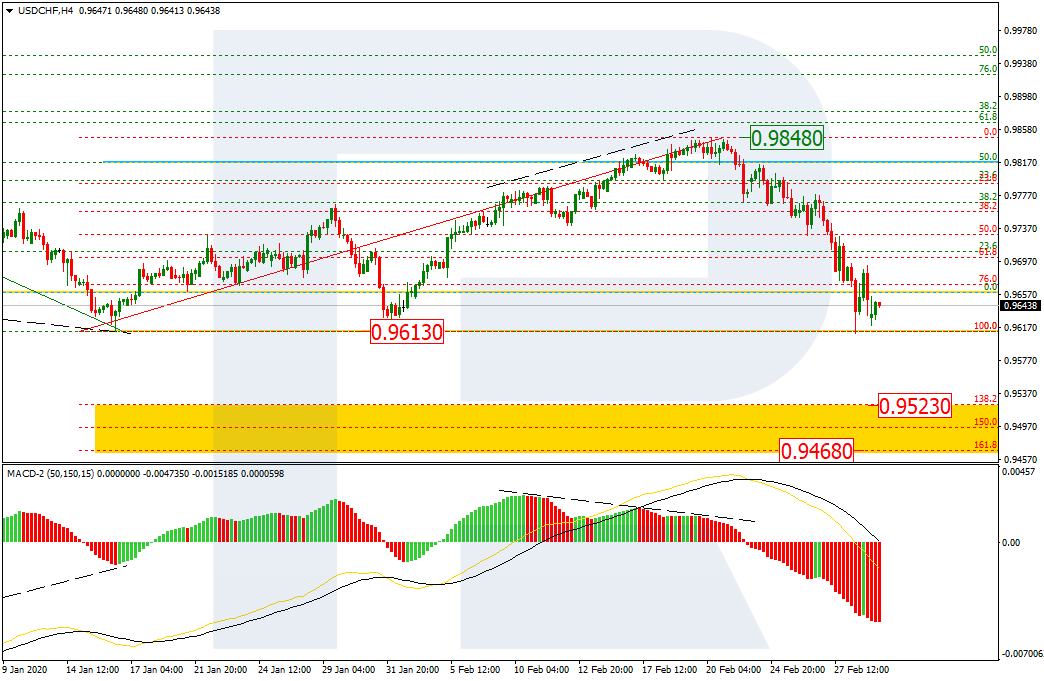
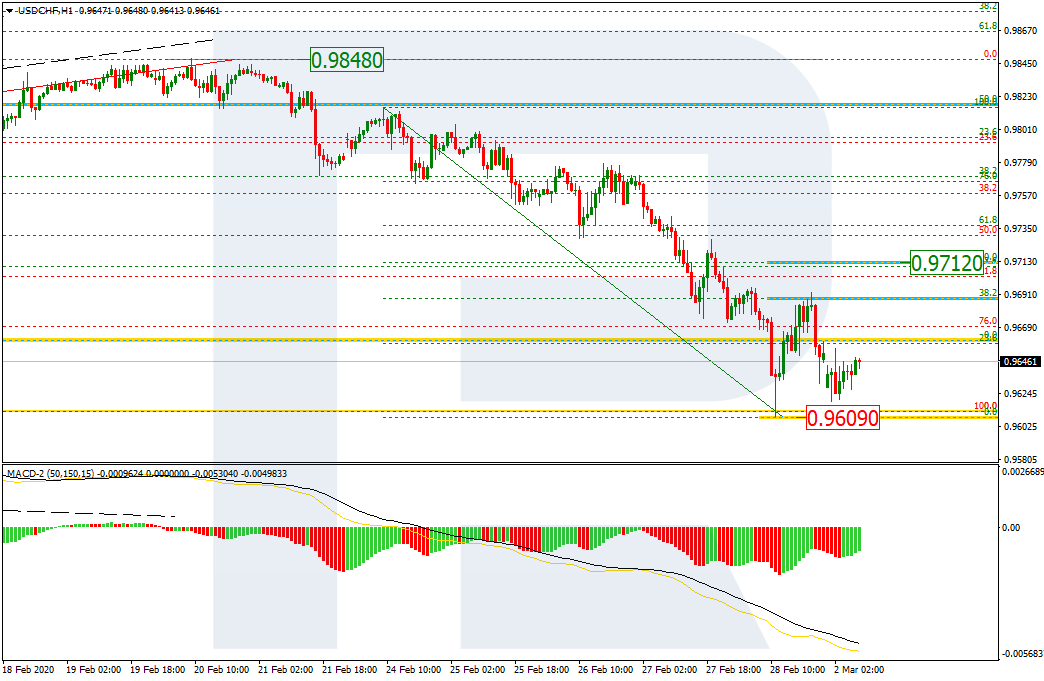
In the H1 chart, after finishing the downtrend and testing the low, the pair is correcting upwards. By now, the first correctional wave has already reached 38.2% fibo and may continue towards 50.0% fibo at 0.9712. The support is local low at 0.9609.

USDCHF_H1
Risk Warning: the result of previous trading operations do not guarantee the same results in the future

Murrey Math Lines 31.01.2020 (EURUSD, GBPUSD)

Murrey Math Lines 31.01.2020 (EURUSD, GBPUSD)

31.01.2020

EURUSD, “Euro vs. US Dollar”

As we can see in the H4 chart, EURUSD has rebounded from the support at 0/8. In this case, the price is expected to continue trading upwards to reach 3/8. However, this scenario may no longer be valid if the price breaks 1/8 to the downside. After that, the instrument is expected to continue falling to reach the support at -1/8.

EURUSD_H4
Risk Warning: the result of previous trading operations do not guarantee the same results in the future

In the M15 chart, the pair has broken the upside line of the VoltyChannel indicator and, as a result, may continue trading upwards to reach 3/8 from the H4 chart

EURUSD_M15
Risk Warning: the result of previous trading operations do not guarantee the same results in the future

GBPUSD, “Great Britain Pound vs US Dollar”

As we can see in the H4 chart, the pair is trading below 3/8. In this case, GBPUSD is expected to test this level, rebound from it, and then resume falling towards the support at 0/8. However, this scenario may no longer be valid if the price breaks 3/8 and fixes above it. After that, the instrument is expected to continue growing to reach the resistance at 5/8.

GBPUSD_H4
Risk Warning: the result of previous trading operations do not guarantee the same results in the future

In the M15 chart, the pair may break the downside line of the VoltyChannel indicator and, as a result, may continue trading downwards to reach 0/8 from the H4 chart.

GBPUSD_M15
Risk Warning: the result of previous trading operations do not guarantee the same results in the future

Forex Technical Analysis & Forecast 31.01.2020 (EURUSD, GBPUSD, USDCHF, USDJPY, AUDUSD, USDRUB, USDCAD, GOLD, BRENT, BTCUSD)

Forex Technical Analysis & Forecast 31.01.2020 (EURUSD, GBPUSD, USDCHF, USDJPY, AUDUSD, USDRUB, USDCAD, GOLD, BRENT, BTCUSD)

31.01.2020

EURUSD, “Euro vs US Dollar”

EURUSD has completed another ascending impulse towards 1.1038; right now, it is correcting towards 1.1013. After that, the instrument may form one more ascending structure to break 1.1038 and then continue growing with the target at 1.1060.

EURUSD
Risk Warning: the result of previous trading operations do not guarantee the same results in the future

GBPUSD, “Great Britain Pound vs US Dollar”

GBPUSD has returned to 1.3085; right now, it is consolidating near the highs. Possibly, the pair may form a new descending structure towards 1.3040 and then start another growth with the target at 1.3090.

GBPUSD
Risk Warning: the result of previous trading operations do not guarantee the same results in the future

USDCHF, “US Dollar vs Swiss Franc”

After finishing the descending structure towards 0.9680, USDCHF has completed the correction at 0.9700. Later, the market may start a new decline with the target at 0.9661.

USDCHF
Risk Warning: the result of previous trading operations do not guarantee the same results in the future

USDJPY, “US Dollar vs Japanese Yen”

USDJPY is still consolidating around 108.99. Possibly, today the pair may expand the range up to 109.39 or even 109.57 to test it from below. Later, the market may resume falling inside the downtrend with the target at 108.03.

USDJPY
Risk Warning: the result of previous trading operations do not guarantee the same results in the future

AUDUSD, “Australian Dollar vs US Dollar”

After breaking 0.6733, AUDUSD has completed the descending structure towards 0.6707. Today, the pair may grow to test 0.6733 from below and then resume trading downwards with the target at 0.6688.

AUDUSD
Risk Warning: the result of previous trading operations do not guarantee the same results in the future

USDRUB, “US Dollar vs Russian Ruble”

USDRUB is moving upwards. Possibly, the pair may reach 63.50 and then form a new descending structure to break 62.90. Later, the market may resume trading downwards with the first target at 62.38.

USDRUB
Risk Warning: the result of previous trading operations do not guarantee the same results in the future

USDCAD, “US Dollar vs Canadian Dollar”

USDCAD is falling towards 1.3188 and may later start a new correction to reach 1.3206, thus forming a new consolidation range. If the price breaks this range to the downside, the market may form a new descending structure to reach 1.3170; if to the upside – resume growing with the target at 1.3250.

USDCAD
Risk Warning: the result of previous trading operations do not guarantee the same results in the future

XAUUSD, “Gold vs US Dollar”

Gold is moving downwards. Possibly, the pair may break 1570.84. The downside target is at 1560.00.

GOLD
Risk Warning: the result of previous trading operations do not guarantee the same results in the future

BRENT

Brent is growing towards 58.87. Today, the pair is expected to form a new consolidation around this level. If later the price breaks this range to the upside, the market may continue trading upwards with the target at 60.75.

BRENT
Risk Warning: the result of previous trading operations do not guarantee the same results in the future

BTCUSD, “Bitcoin vs US Dollar”

BTCUSD has reached 9500.00; right now, it is moving downwards. The main scenario implies that the pair may fall to reach 9050.00 and then start a new correction towards 9250.00. After that, the instrument may continue falling with the target at 8500.00.

BITCOIN

Ichimoku Cloud Analysis 31.01.2020 (AUDUSD, NZDUSD, USDCAD) 31.01.2020

Ichimoku Cloud Analysis 31.01.2020 (AUDUSD, NZDUSD, USDCAD)

31.01.2020

AUDUSD, “Australian Dollar vs US Dollar”

AUDUSD is trading at 0.6715; the instrument is moving below Ichimoku Cloud, thus indicating a descending tendency. The markets could indicate that the price may test the cloud’s downside border at 0.6775 and then resume moving downwards to reach 0.6575. Another signal to confirm further descending movement is the price’s rebounding from the resistance level. However, the scenario that implies further decline may be canceled if the price breaks the cloud’s upside border and fixes above 0.6845. In this case, the pair may continue growing towards 0.6935.

AUDUSD
Risk Warning: the result of previous trading operations do not guarantee the same results in the future

NZDUSD, “New Zealand Dollar vs US Dollar”

NZDUSD is trading at 0.6481; the instrument is moving below Ichimoku Cloud, thus indicating a descending tendency. The markets could indicate that the price may test the cloud’s downside border at 0.6545 and then resume moving downwards to reach 0.6375. Another signal to confirm further descending movement is the price’s rebounding from the descending channel’s upside border. However, the scenario that implies further decline may be canceled if the price breaks the cloud’s upside border and fixes above 0.6585. In this case, the pair may continue growing towards 0.6675.

NZDUSD
Risk Warning: the result of previous trading operations do not guarantee the same results in the future

USDCAD, “US Dollar vs Canadian Dollar”

USDCAD is trading at 1.3210; the instrument is moving above Ichimoku Cloud, thus indicating an ascending tendency. The markets could indicate that the price may test the cloud’s upside border at 1.3165 and then resume moving upwards to reach 1.3355. Another signal to confirm further ascending movement is the price’s rebounding from the support level. However, the scenario that implies further growth may be canceled if the price breaks the cloud’s downside border and fixes below 1.3075. In this case, the pair may continue falling towards 1.2995. After breaking the descending channel’s upside border and fixing above 1.3255, the price may continue moving upwards.

USDCAD
Risk Warning: the result of previous trading operations do not guarantee the same results in the future

Japanese Candlesticks Analysis 31.01.2020 (EURUSD, USDJPY)

Japanese Candlesticks Analysis 31.01.2020 (EURUSD, USDJPY)

31.01.2020

EURUSD, “Euro vs. US Dollar”

As we can see in the H4 chart, EURUSD is forming the descending tendency. Right now, EURUSD has completed several reversal candlestick patterns, such as Harami, close to the channel’s upside border. We may assume that later the price may reverse and continues its decline to reach the support level at 1.0955. However, one shouldn’t exclude a possibility that the price may form a pullback and reach 1.1075.

EURUSD
Risk Warning: the result of previous trading operations do not guarantee the same results in the future

USDJPY, “US Dollar vs. Japanese Yen”

As we can see in the H4 chart, USDJPY is moving near the rising channel’s downside border, where it has formed several reversal patterns, such as Engulfing. The current situation implies that the pair may reverse and resume growing to reach 109.65. At the same time, the pair may choose another scenario, according to which it is expected to continue falling towards 108.45.

USDJPY
Risk Warning: the result of previous trading operations do not guarantee the same results in the future

Fibonacci Retracements Analysis 31.01.2020 (BITCOIN, ETHEREUM)

Fibonacci Retracements Analysis 31.01.2020 (BITCOIN, ETHEREUM)

31.01.2020

BTCUSD, “Bitcoin vs US Dollar”

As we can see in the H4 chart, after reaching 38.2% fibo, BTCUSD is trying to get to 50.0% fibo. At the same time, there is a divergence on MACD, which may indicate a possible pullback soon. The support is at 23.6% fibo (8184.75).

BTCUSD
Risk Warning: the result of previous trading operations do not guarantee the same results in the future

In the H1 chart, after the pair had reached the upside post-correctional extension area between 138.2 and 161.8% fibo at 9552.55 and 9783.85 respectively, there was a divergence on MACD, which made it start a new pullback. The targets of this pullback may be 23.6%, 38.2%, and 50.0% fibo at 9248.00, 9051.40, 8893.30 respectively. The resistance is the local high at 9564.80.

BITCOIN
Risk Warning: the result of previous trading operations do not guarantee the same results in the future

ETHUSD, “Ethereum vs. US Dollar”

As we can see in the H4 chart, after updating the high, ETHUSD is trying to fix above 23.6%. the next upside target is 38.2% fibo at 210.20. At the same time, there is a divergence on MACD.

ETHUSD
Risk Warning: the result of previous trading operations do not guarantee the same results in the future

In the H1 chart, the pair is growing towards the local post-correctional extension area between 138.2 and 161.8% fibo at 188.05 and 193.65 respectively.

ETHEREUM

Ichimoku Cloud Analysis 29.01.2020 (AUDUSD, NZDUSD, USDCAD)

Ichimoku Cloud Analysis 29.01.2020 (AUDUSD, NZDUSD, USDCAD)

29.01.2020

AUDUSD, “Australian Dollar vs US Dollar”

AUDUSD is trading at 0.6763; the instrument is moving below Ichimoku Cloud, thus indicating a descending tendency. The markets could indicate that the price may test the cloud’s downside border at 0.6800 and then resume moving downwards to reach 0.6655. Another signal to confirm further descending movement is the price’s rebounding from the descending channel’s upside border. However, the scenario that implies further decline may be canceled if the price breaks the cloud’s upside border and fixes above 0.6835. In this case, the pair may continue growing towards 0.6925.

AUDUSD
Risk Warning: the result of previous trading operations do not guarantee the same results in the future

NZDUSD, “New Zealand Dollar vs US Dollar”

NZDUSD is trading at 0.6532; the instrument is moving below Ichimoku Cloud, thus indicating a descending tendency. The markets could indicate that the price may test the cloud’s downside border at 0.6555 and then resume moving downwards to reach 0.6385. Another signal to confirm further descending movement is the price’s rebounding from the descending channel’s upside border. However, the scenario that implies further decline may be canceled if the price breaks the cloud’s upside border and fixes above 0.6615. In this case, the pair may continue growing towards 0.6705.

NZDUSD
Risk Warning: the result of previous trading operations do not guarantee the same results in the future

USDCAD, “US Dollar vs Canadian Dollar”

USDCAD is trading at 1.3161; the instrument is moving above Ichimoku Cloud, thus indicating an ascending tendency. The markets could indicate that the price may test the cloud’s upside border at 1.3115 and then resume moving upwards to reach 1.3335. Another signal to confirm further ascending movement is the price’s rebounding from the support level. However, the scenario that implies further growth may be canceled if the price breaks the cloud’s downside border and fixes below 1.3065. In this case, the pair may continue falling towards 1.2995. After breaking the descending channel’s upside border and fixing above 1.3255, the price may continue moving upwards.

USDCAD
Risk Warning: the result of previous trading operations do not guarantee the same results in the future

Murrey Math Lines 29.01.2020 (USDJPY, USDCAD)

Murrey Math Lines 29.01.2020 (USDJPY, USDCAD)

29.01.2020

USDJPY, “US Dollar vs. Japanese Yen”

As we can see in the H4 chart, USDJPY is consolidating. In this case, the price is expected to break 4/8 and then continue growing to reach the resistance at 5/8. However, this scenario may no longer be valid if the price breaks 3/8 to the downside. After that, the instrument may start a new decline towards the support at 1/8.

USDJPY_H4
Risk Warning: the result of previous trading operations do not guarantee the same results in the future

In the M15 chart, the pair may break the upside line of the VoltyChannel indicator and, as a result, continue trading upwards.

USDJPY_M15
Risk Warning: the result of previous trading operations do not guarantee the same results in the future

USDCAD, “US Dollar vs Canadian Dollar”

In the H4 chart, USDCAD has rebounded from the strong resistance at 8/8. In this case, the pair may resume falling to reach the support at 6/8. However, this scenario may no longer be valid if the price breaks 8/8 to the upside. After that, the instrument may continue growing towards the resistance at +1/8.

USDCAD_H4
Risk Warning: the result of previous trading operations do not guarantee the same results in the future

As we can see in the M15 chart, the pair has broken the downside line of the VoltyChannel indicator and, as a result, continue moving downwards to reach 6/8 from the H4 chart.

USDCAD_M15

Japanese Candlesticks Analysis 29.01.2020 (GOLD, NZDUSD)

Japanese Candlesticks Analysis 29.01.2020 (GOLD, NZDUSD)

29.01.2020

XAUUSD, “Gold vs US Dollar”

As we can see in the H4 chart, the sideways movement within the ascending tendency continues. By now, XAUUSD has completed several reversal patterns, such as Shooting Star, close to the rising channel’s upside border. At the moment, the pair is reversing. Later, the market may form a slight correction and then continue moving to reach 1545.00. However, one shouldn’t ignore another scenario, according to which the instrument may continue the ascending tendency towards 1545.00 without any corrections.

GOLD
Risk Warning: the result of previous trading operations do not guarantee the same results in the future

NZDUSD, “New Zealand vs. US Dollar”

As we can see in the H4 chart, the pair is moving near the support level, where it has formed several reversal patterns, including Hammer. At the moment, NZDUSD is expected to reverse; the closest upside target may be at 0.6575. At the same time, one shouldn’t exclude an opposite scenario, according to which the instrument may fall to reach 0.6508.

NZDUSD

Forex Technical Analysis & Forecast 29.01.2020 (EURUSD, GBPUSD, USDCHF, USDJPY, AUDUSD, USDRUB, USDCAD, GOLD, BRENT, BTCUSD)

Forex Technical Analysis & Forecast 29.01.2020 (EURUSD, GBPUSD, USDCHF, USDJPY, AUDUSD, USDRUB, USDCAD, GOLD, BRENT, BTCUSD)

29.01.2020

EURUSD, “Euro vs US Dollar”

EURUSD has completed the ascending impulse; right now, it is correcting. Possibly, the pair may fall to reach 1.1012 or even 1.1004. Later, the market may resume trading upwards to break 1.1026 and then continue growing with the short-term target at 1.1053.

EURUSD
Risk Warning: the result of previous trading operations do not guarantee the same results in the future

GBPUSD, “Great Britain Pound vs US Dollar”

GBPUSD has finished another descending structure towards 1.2975; right now, it is correcting. Today, the pair may reach 1.3040 and then resume falling with the target at 1.2957.

GBPUSD
Risk Warning: the result of previous trading operations do not guarantee the same results in the future

USDCHF, “US Dollar vs Swiss Franc”

USDCHF has completed the ascending wave towards 0.9735; right now, it is consolidating above 0.9715. If later the price breaks this range to the upside, the market may form one more ascending structure to reach 0.9753; if to the downside – start a new correction with the target at 0.9695.

USDCHF
Risk Warning: the result of previous trading operations do not guarantee the same results in the future

USDJPY, “US Dollar vs Japanese Yen”

USDJPY is growing to break 109.16. Possibly, today the pair may continue this correction towards 109.57 and then form a new descending structure to return to 109.16. After that, the instrument may grow to reach 109.60 and then resume trading inside the downtrend with the short-term target at 108.22.

USDJPY
Risk Warning: the result of previous trading operations do not guarantee the same results in the future

AUDUSD, “Australian Dollar vs US Dollar”

AUDUSD is correcting upwards to reach 0.6844. Today, the pair may form the first structure of this correction with the target at 0.6790.

AUDUSD
Risk Warning: the result of previous trading operations do not guarantee the same results in the future

USDRUB, “US Dollar vs Russian Ruble”

USDRUB is forming the first descending wave with the target at 62.08. According to the main scenario, the price is expected to reach it and then start a new correction towards 62.60.

USDRUB
Risk Warning: the result of previous trading operations do not guarantee the same results in the future

USDCAD, “US Dollar vs Canadian Dollar”

USDCAD is forming the first descending wave with the target at 1.3148. Possibly, the pair may reach this level and then start another correction towards 1.3178.

USDCAD
Risk Warning: the result of previous trading operations do not guarantee the same results in the future

XAUUSD, “Gold vs US Dollar”

After reaching 1565.55 and then forming another consolidation range around 1568.87, Gold has broken it to the downside. Possibly, the pair may continue falling with the target at 1560.43. However, if the price breaks the range to the upside, the market may start a new correction to reach 1576.9 and then resume trading downwards with the above-mentioned target.

GOLD
Risk Warning: the result of previous trading operations do not guarantee the same results in the future

BRENT

After finishing the ascending impulse towards 59.76, Brent is trying to break its top. Possibly, the pair may continue growing to reach 60.80. An alternative scenario implies that the price may break 59.60 and start a new correction towards 58.88. After that, the instrument may form one more ascending structure with the target at 61.25.

BRENT
Risk Warning: the result of previous trading operations do not guarantee the same results in the future

BTCUSD, “Bitcoin vs US Dollar”

After forming the consolidation range below 9153.00, BTCUSD has broken it to the upside. The main scenario implies that the pair may reach 9350.00 and then resume falling to test 9153.00 from above. After that, the instrument may start a new growth with the target at 9500.00.

BITCOIN
Risk Warning: the result of previous trading operations do not guarantee the same results in the future