Ichimoku Cloud Analysis 10.03.2020 (GBPUSD, XAUUSD, USDCAD)
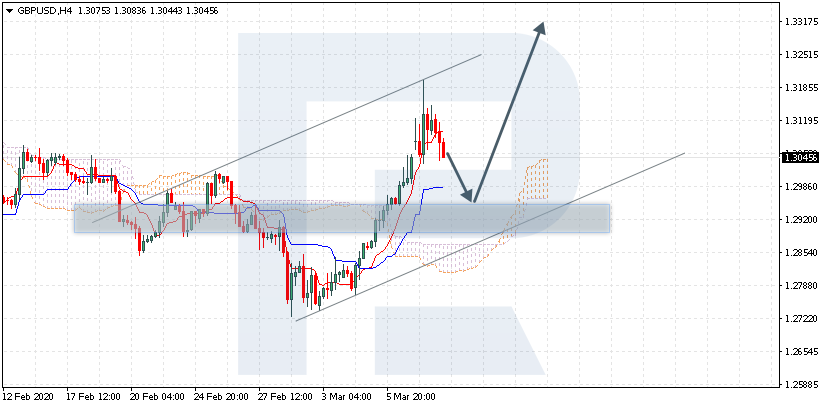
GBPUSD, “Great Britain Pound vs US Dollar”
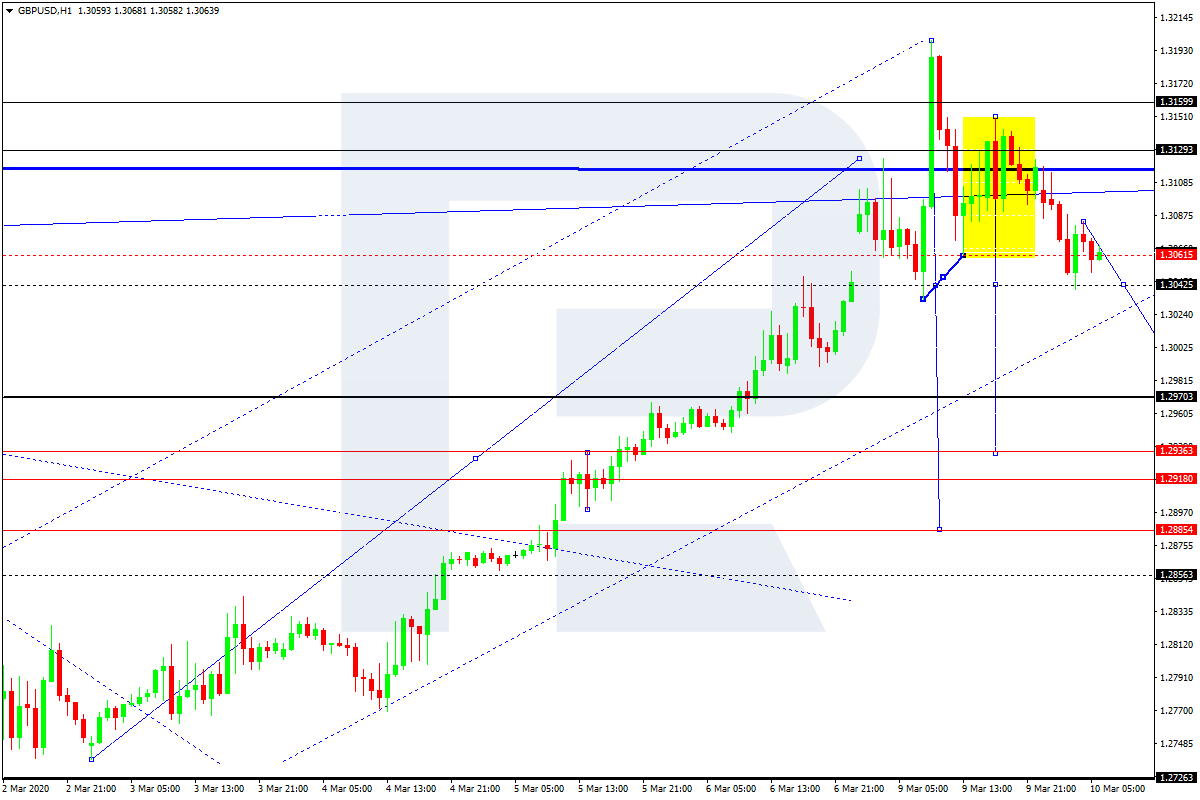
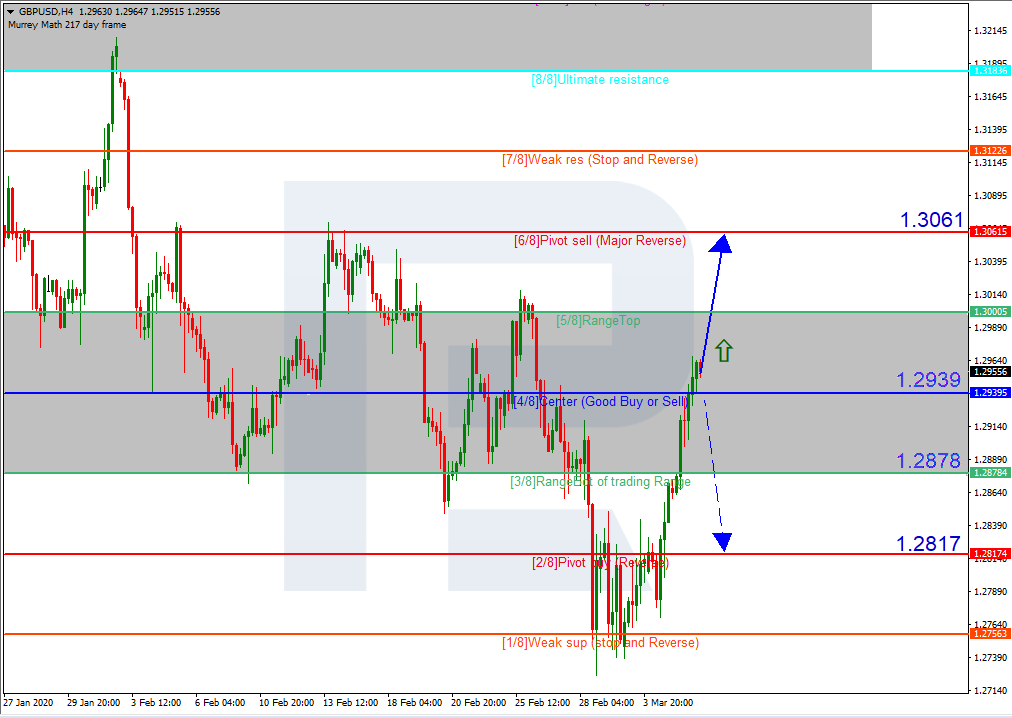
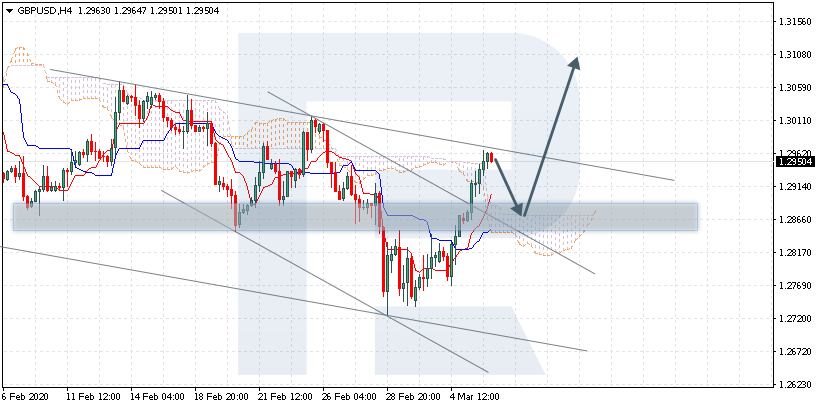
GBPUSD is trading at 1.3045; the instrument is moving above Ichimoku Cloud, thus indicating an ascending tendency. The markets could indicate that the price may test Tenkan-Sen and Kijun-Sen at 1.2975 and then resume moving upwards to reach 1.3315. Another signal to confirm further ascending movement is the price’s rebounding from the support level. However, the scenario that implies further growth may be canceled if the price breaks the cloud’s downside border and fixes below 1.2780. In this case, the pair may continue falling towards 1.2675.

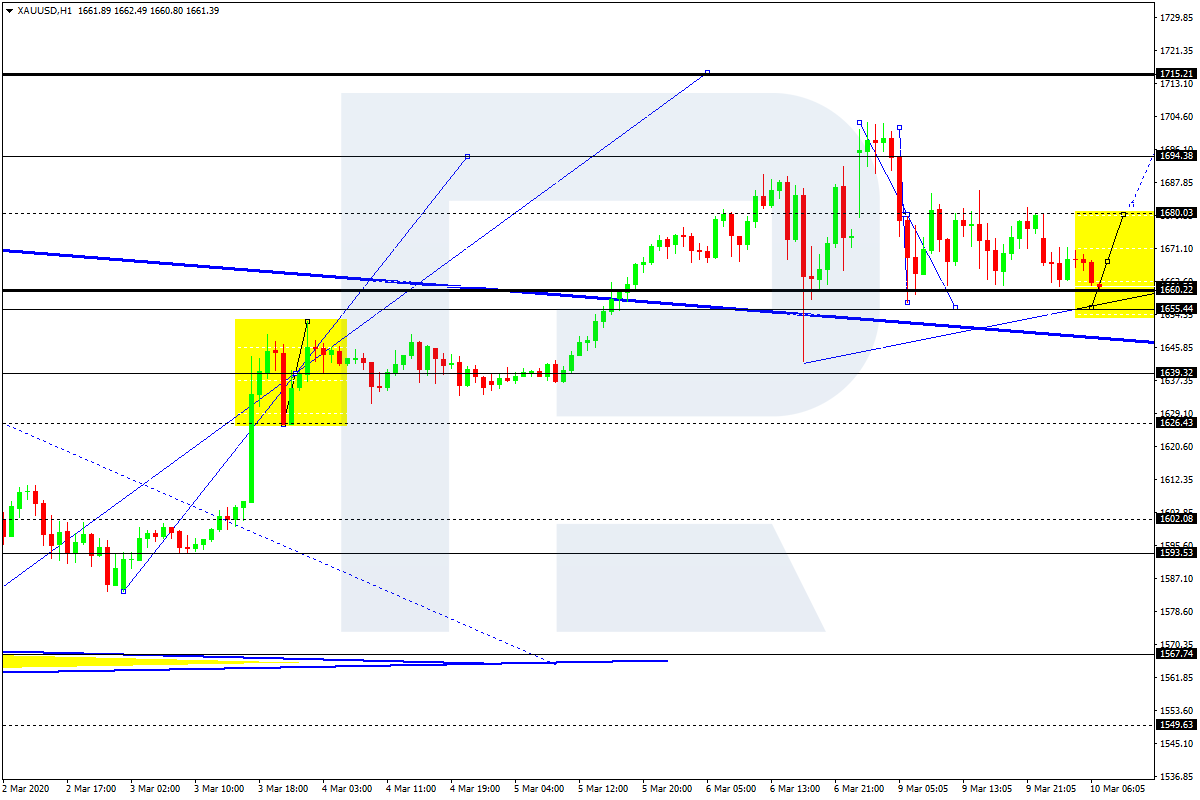
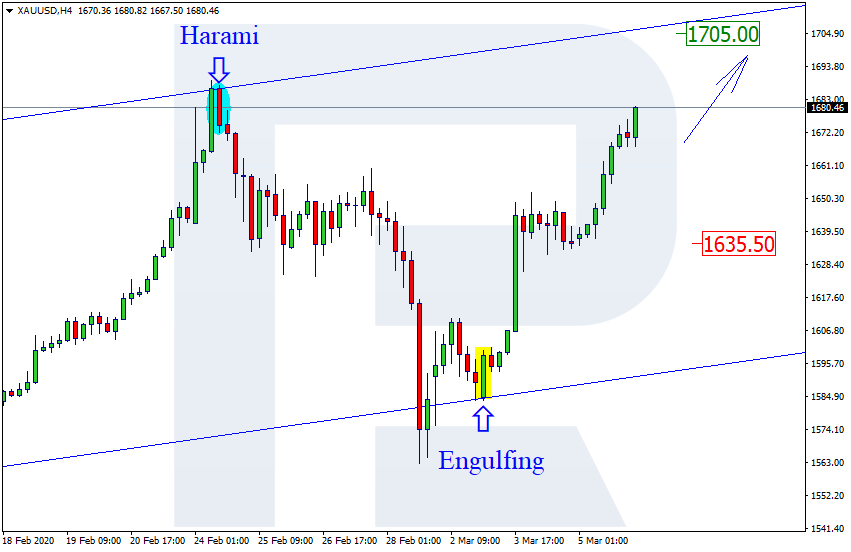
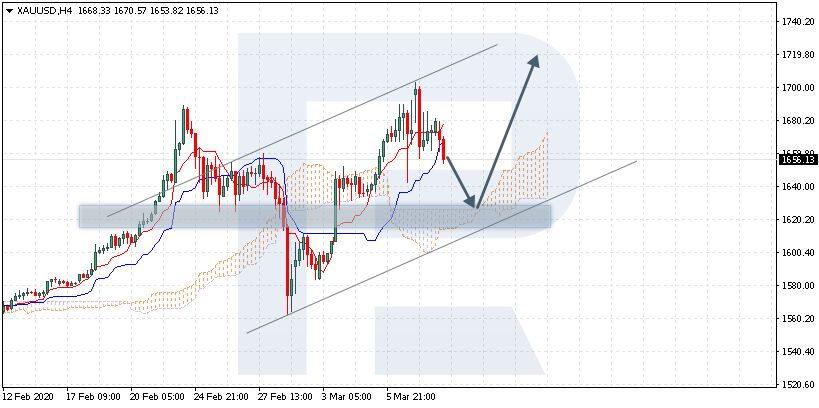
XAUUSD, “Gold vs US Dollar”
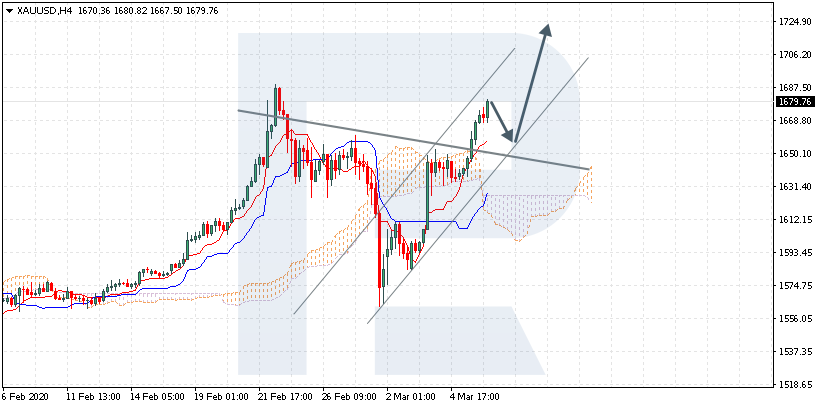
XAUUSD is trading at 1656.00; the instrument is moving above Ichimoku Cloud, thus indicating an ascending tendency. The markets could indicate that the price may test the cloud’s upside border at 1625.00 and then resume moving upwards to reach 1720.00. Another signal to confirm further ascending movement is the price’s rebounding from the rising channel’s downside border. However, the scenario that implies further growth may be canceled if the price breaks the cloud’s downside border and fixes below 1605.00. In this case, the pair may continue falling towards 1575.00.
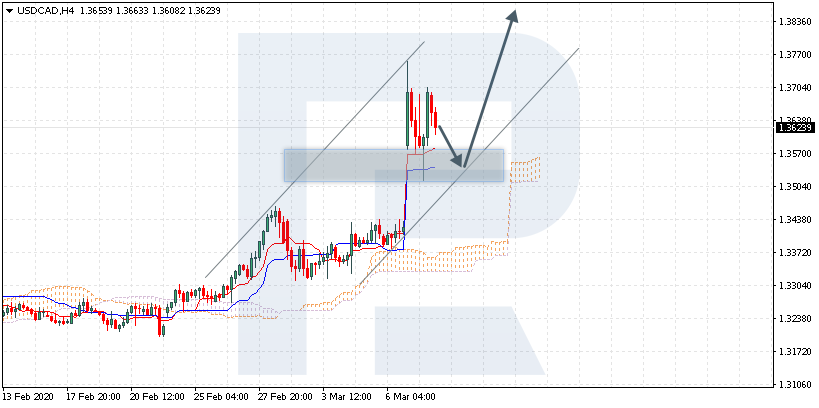
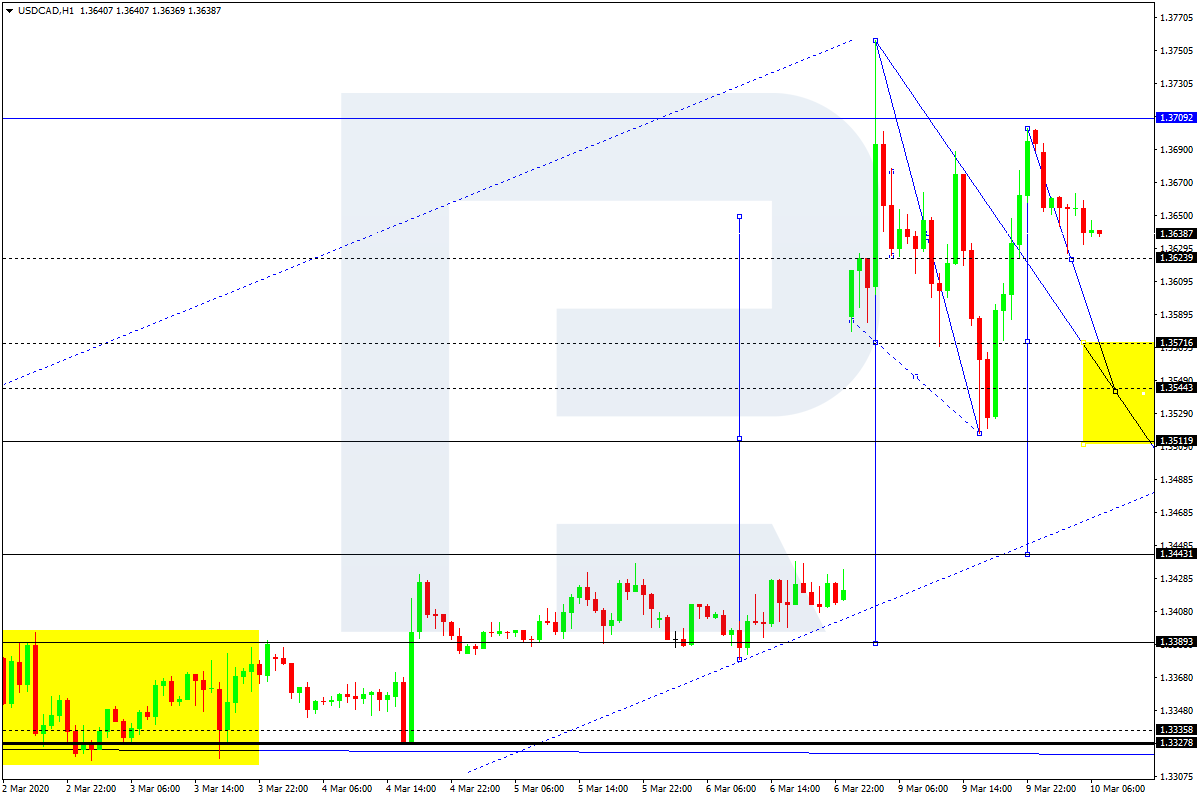
USDCAD, “US Dollar vs Canadian Dollar”
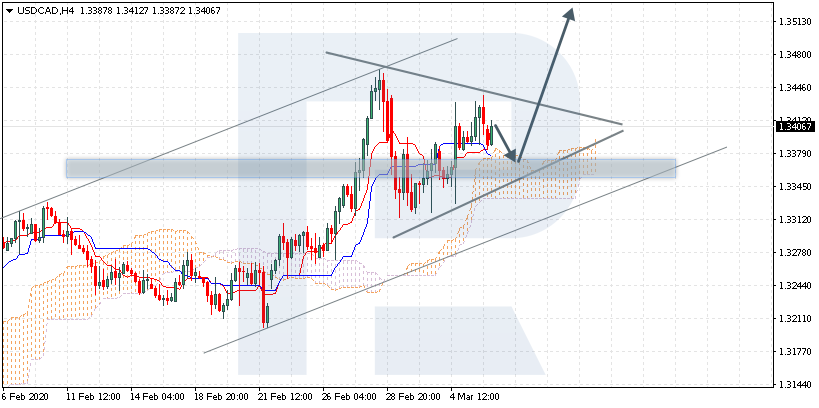
USDCAD is trading at 1.3623; the instrument is moving above Ichimoku Cloud, thus indicating an ascending tendency. The markets could indicate that the price may test Tenkan-Sen and Kijun-Sen at 1.3565 and then resume moving upwards to reach 1.3845. Another signal to confirm further ascending movement is the price’s rebounding from the rising channel’s downside border. However, the scenario that implies further growth may be canceled if the price breaks the cloud’s downside border and fixes below 1.3305. In this case, the pair may continue falling towards 1.3210.