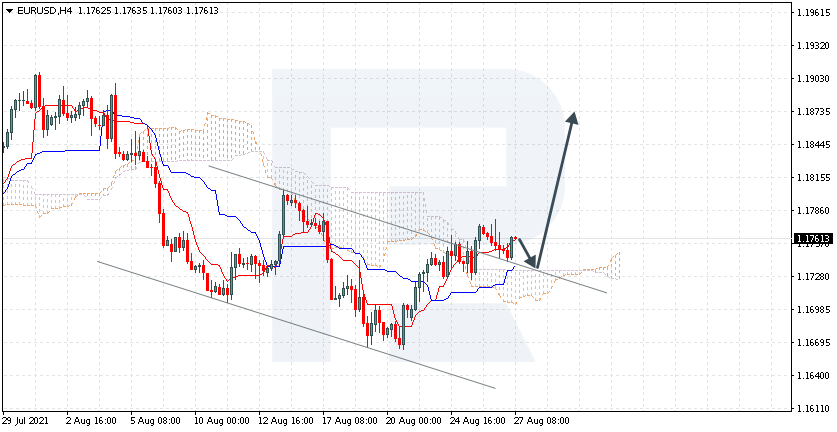
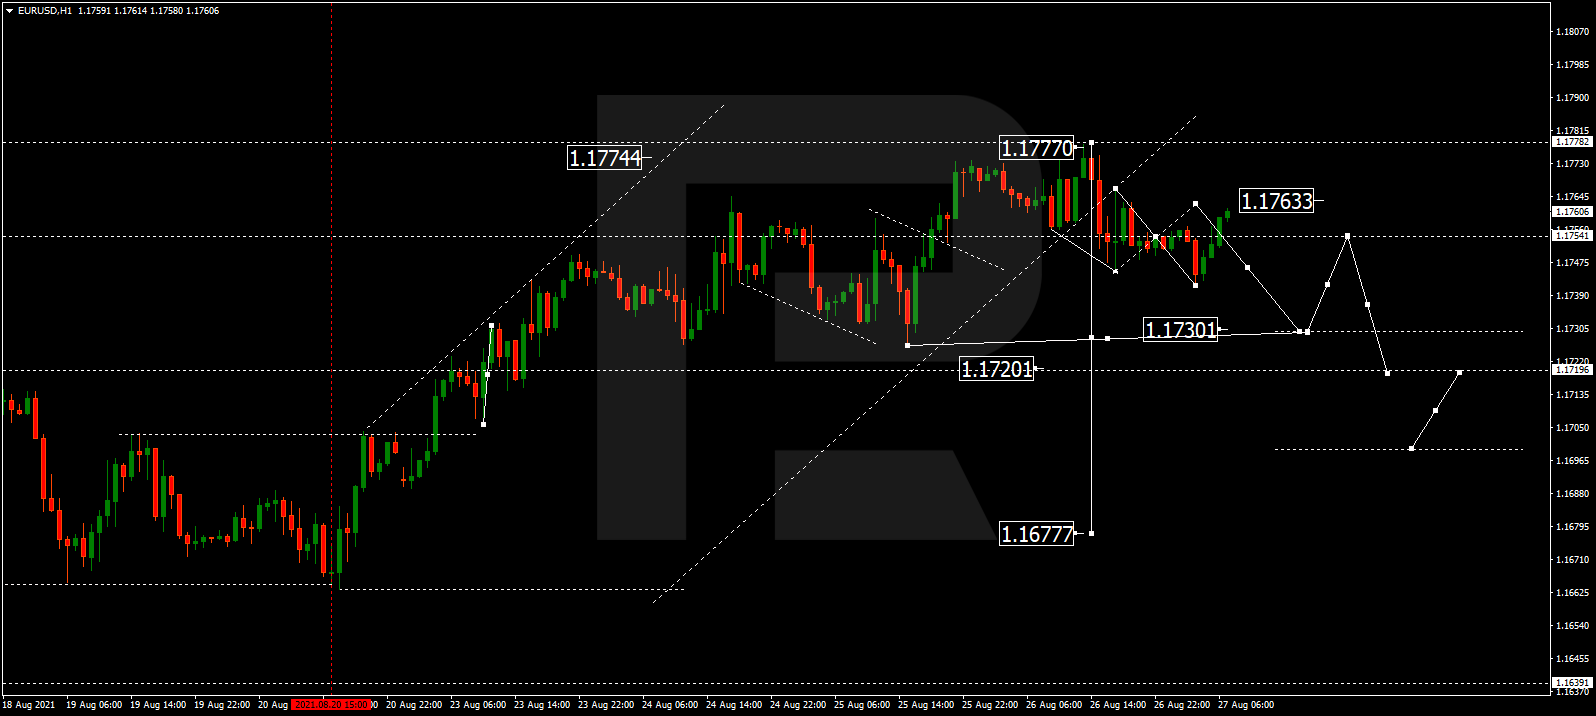
EURUSD, “Euro vs US Dollar”
After rebounding from 1.1777 and finishing the first descending impulse at 1.1741, EURUSD is correcting to the upside to reach 1.1763, thus forming a new consolidation range around 1.1754. If later the price breaks this range to the downside, the market may resume trading downwards with the target at 1.1720; if to the upside – form one more ascending structure towards 1.1788 and then start a new decline to reach the above-mentioned target.

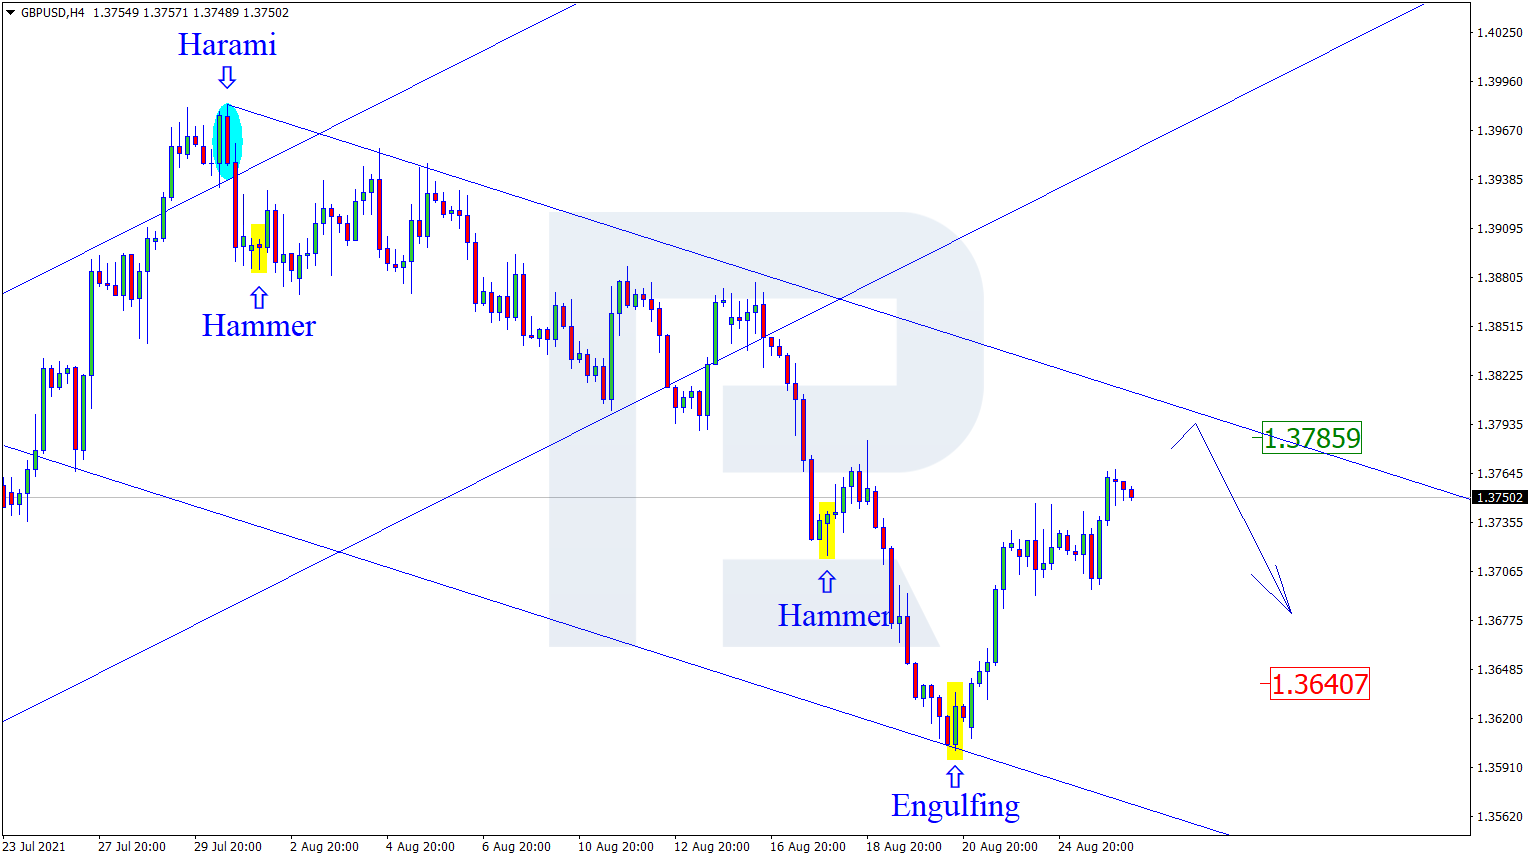
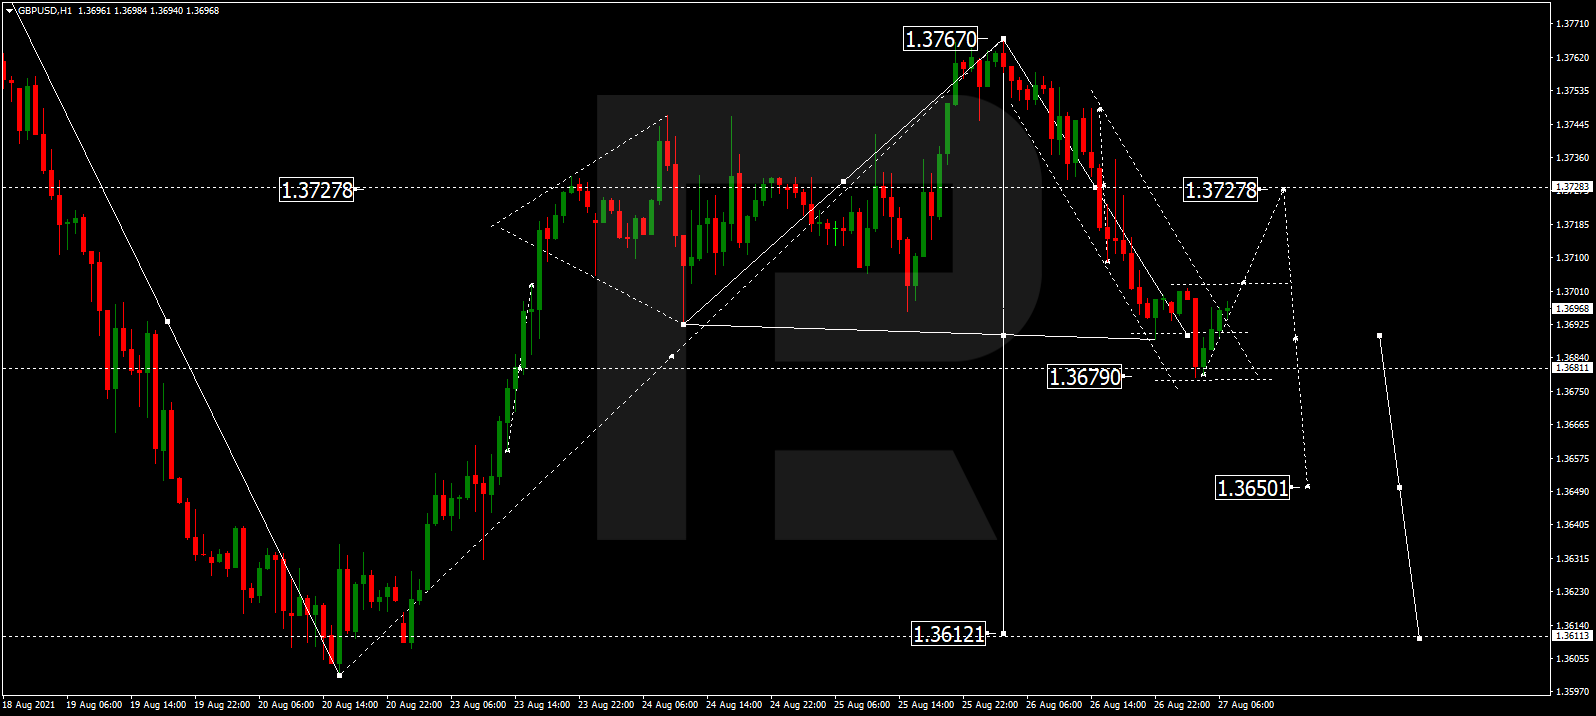
GBPUSD, “Great Britain Pound vs US Dollar”
After rebounding from 1.3767 and completing the descending impulse at 1.3680, GBPUSD is forming a new consolidation range around 1.3690. If later the price breaks this range to the downside, the market may fall to reach 1.3650; if to the upside – correct to test 1.3727 from below and then resume trading within the downtrend with the target at 1.3600.
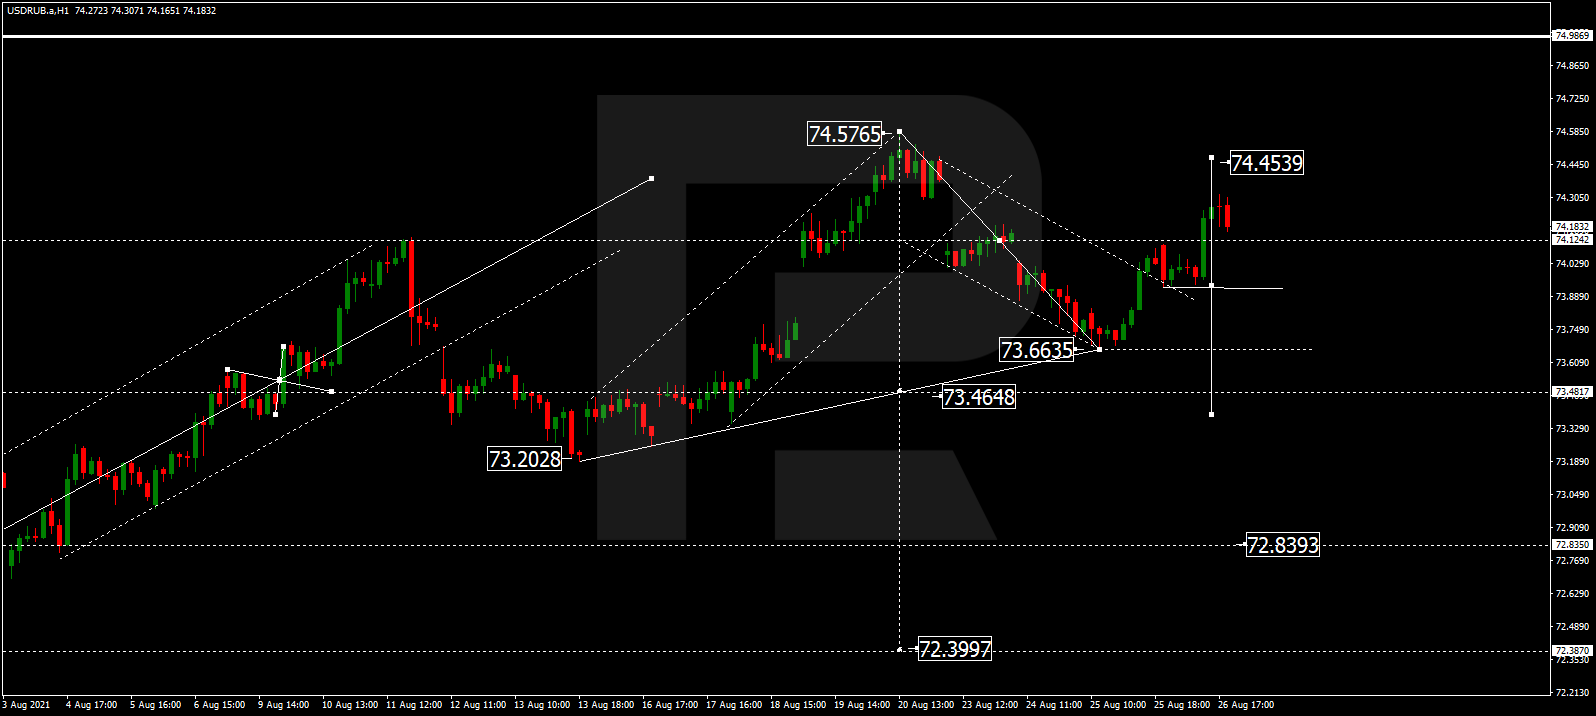
USDRUB, “US Dollar vs Russian Ruble”
USDRUB has finished another ascending structure at 74.45; right now, it is consolidating below this level. Possibly, today the pair may break this range to the downside and resume trading downwards to break 73.80. After that, the instrument may continue falling with the target at 72.88.
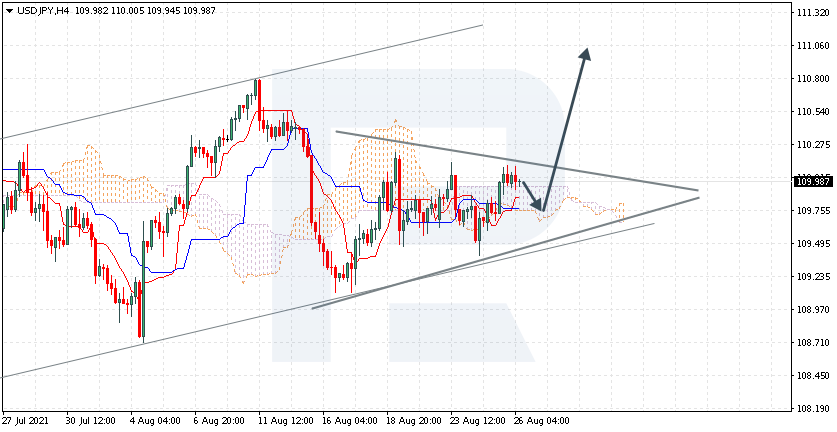
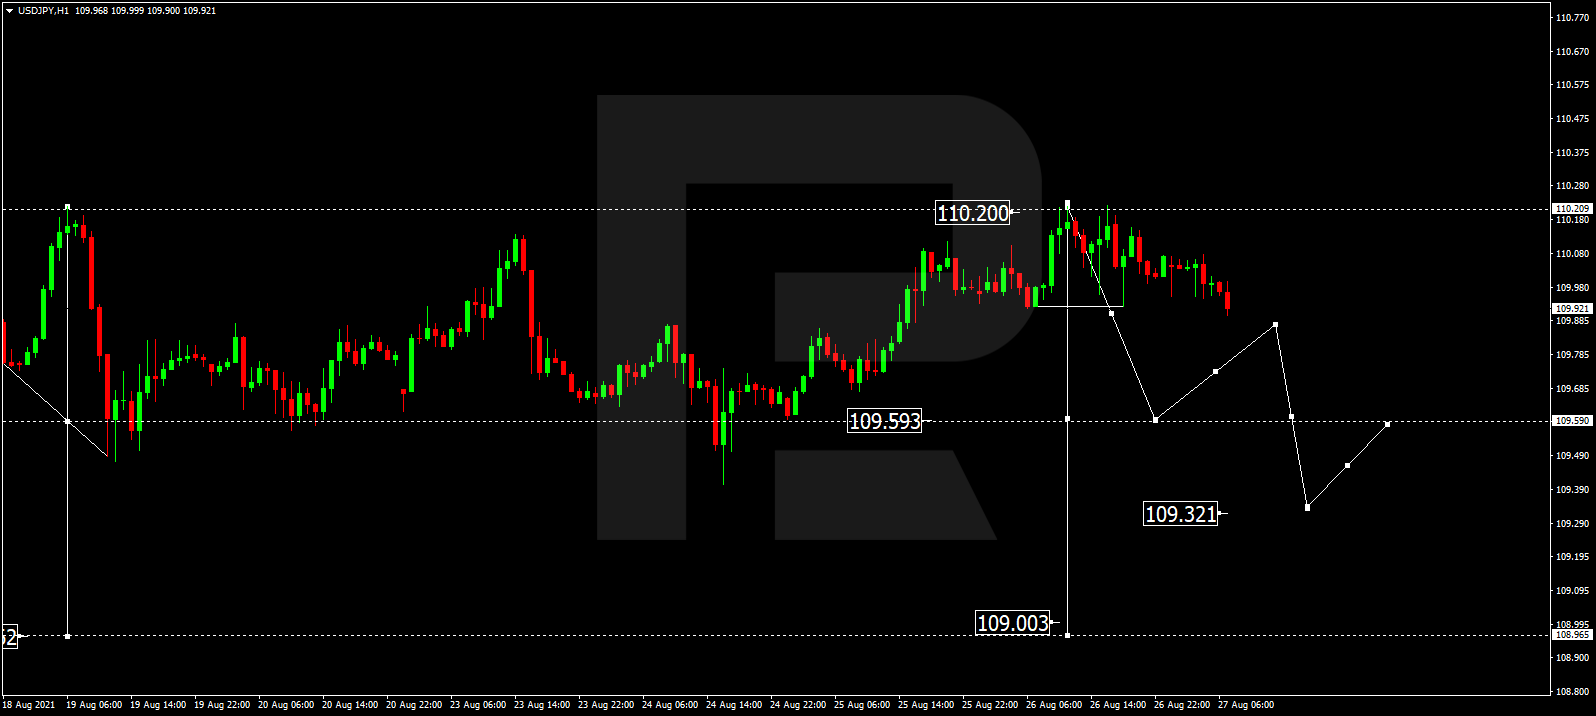
USDJPY, “US Dollar vs Japanese Yen”
After rebounding from 110.20, USDJPY is trading downwards to reach 109.50. Possibly, the pair may break the latter level and then continue moving within the downtrend with the short-term target at 108.96.
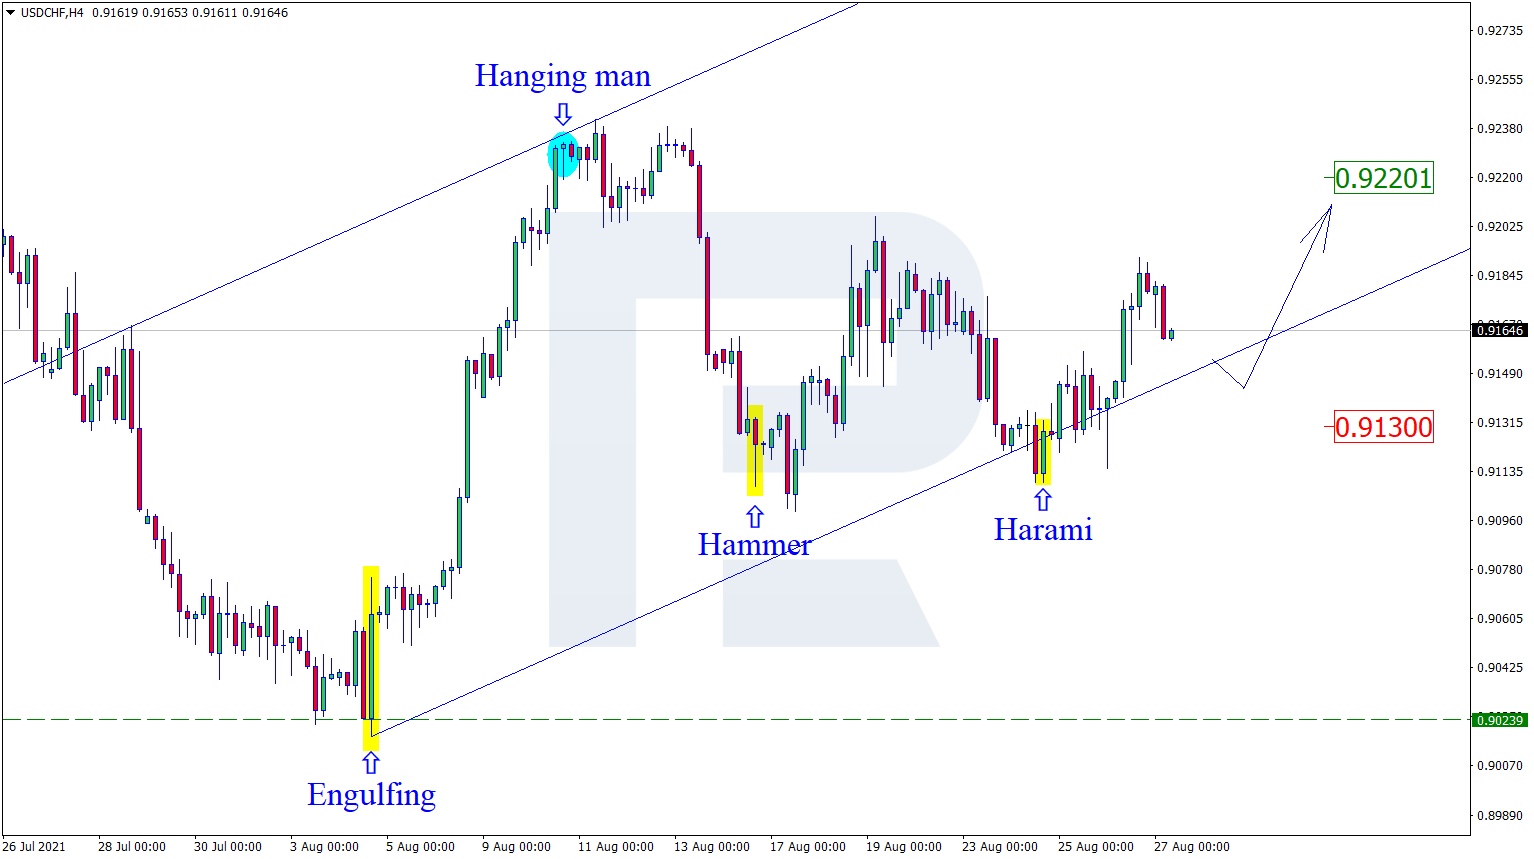
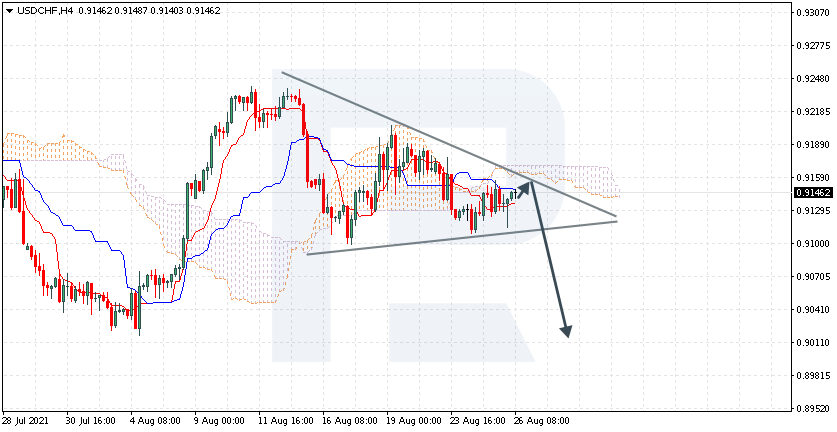
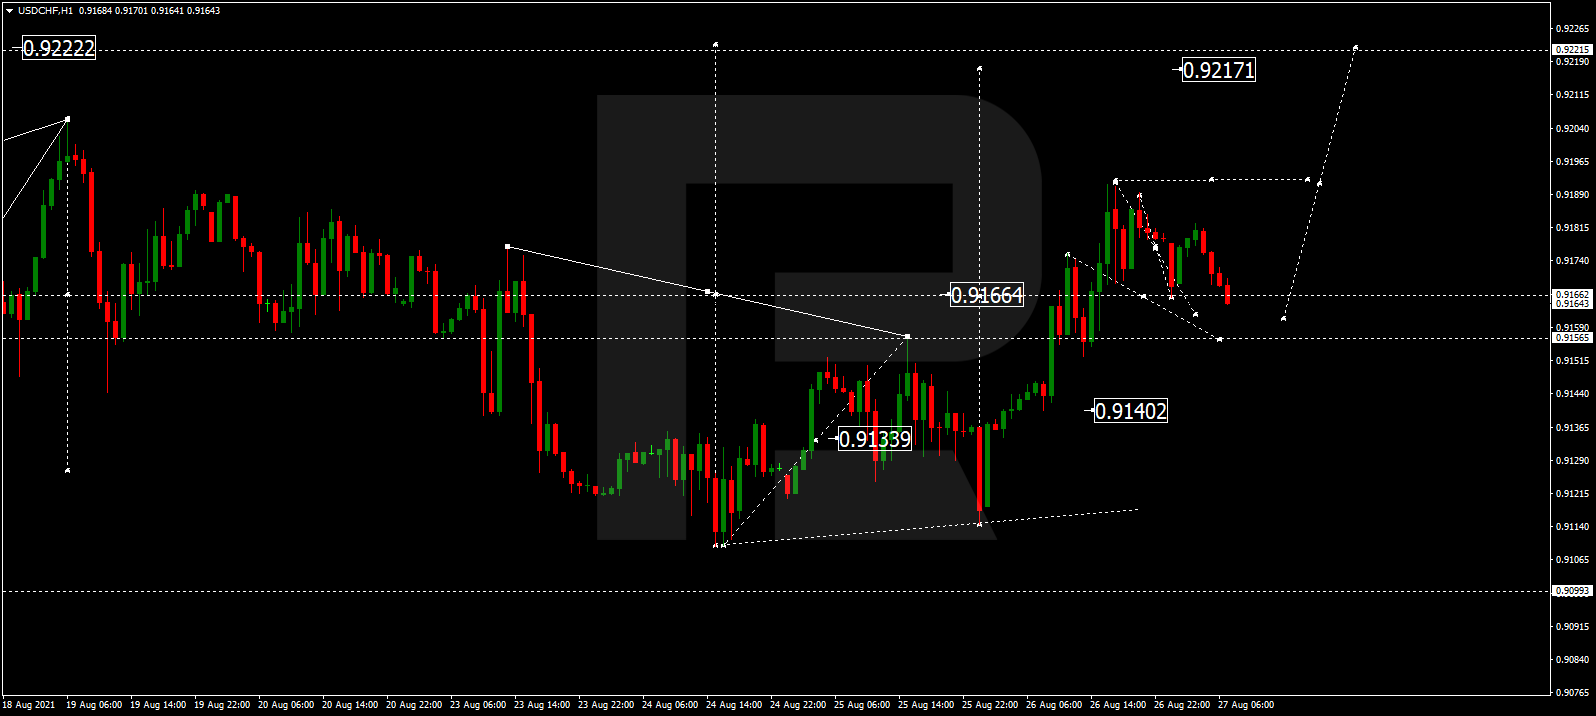
USDCHF, “US Dollar vs Swiss Franc”
USDCHF has finished the ascending structure at 0.9166; right now, it is consolidating around this level. Today, the pair may fall towards 0.9161 and then resume growing to break 0.9191. After that, the instrument may continue trading upwards with the short-term target at 0.9222.
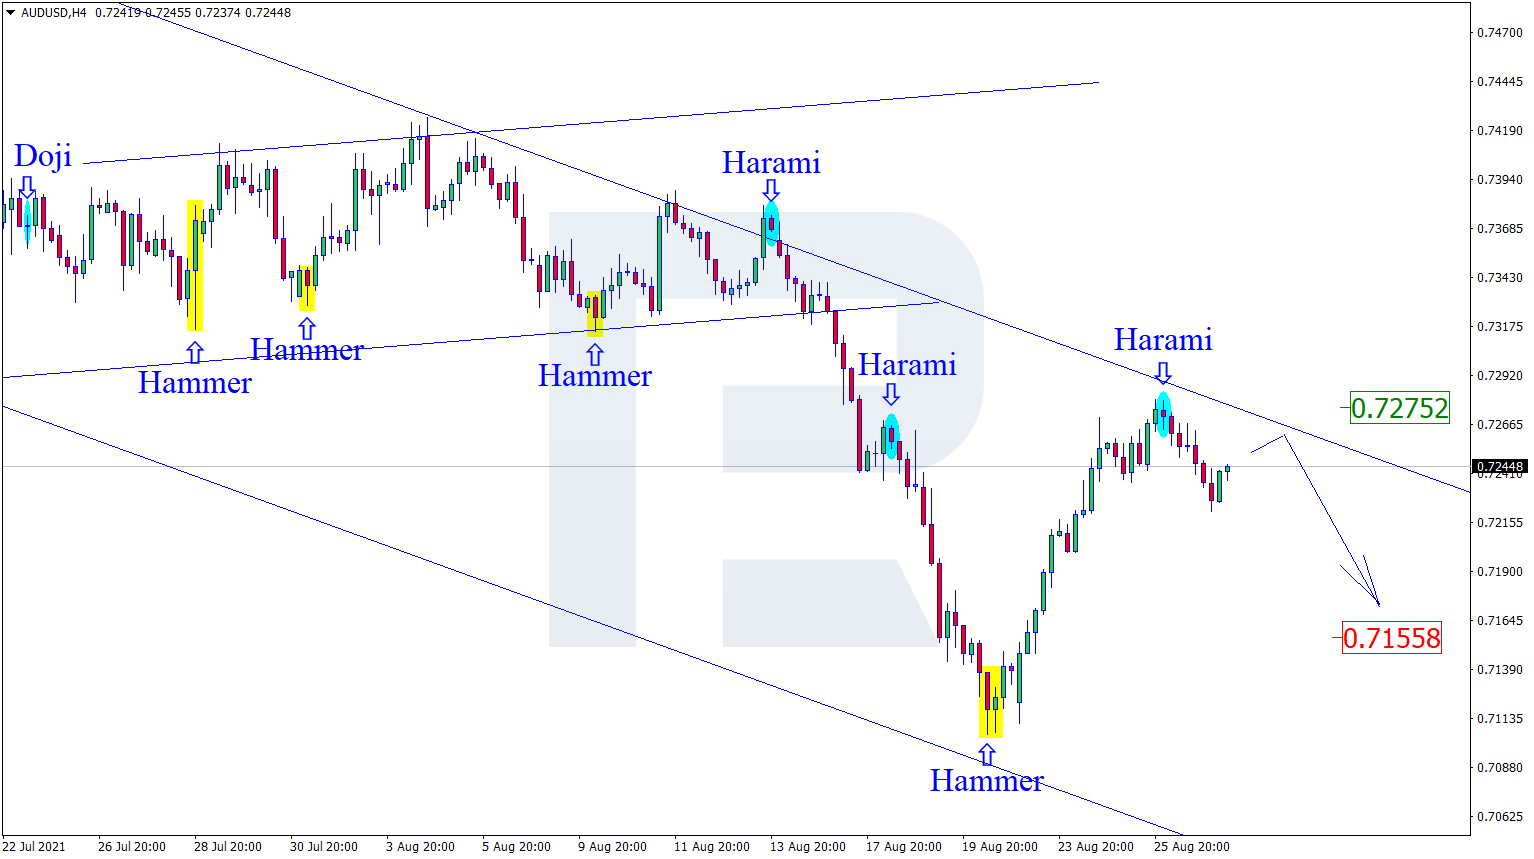
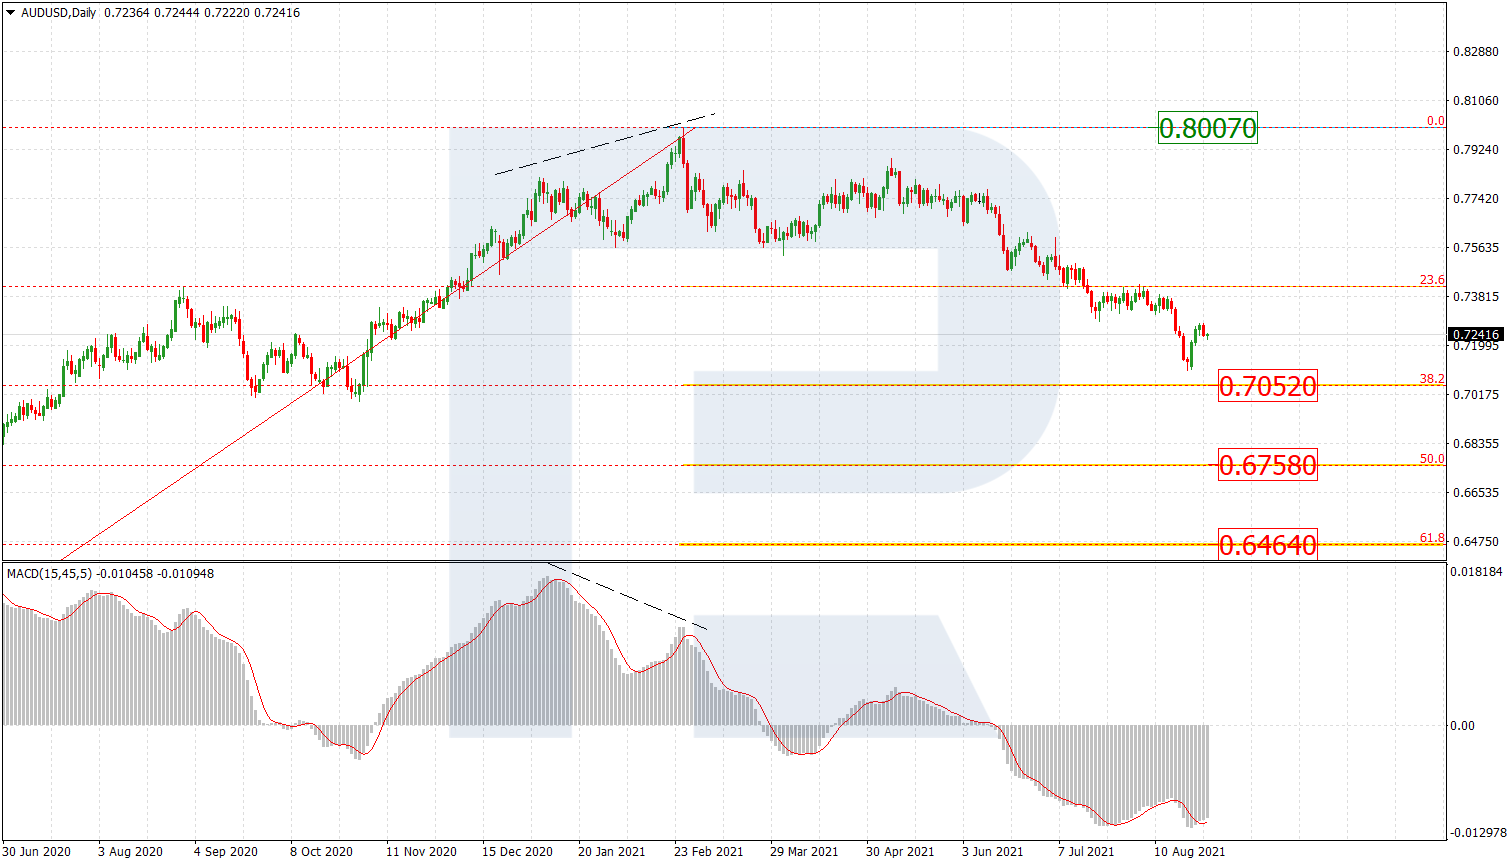
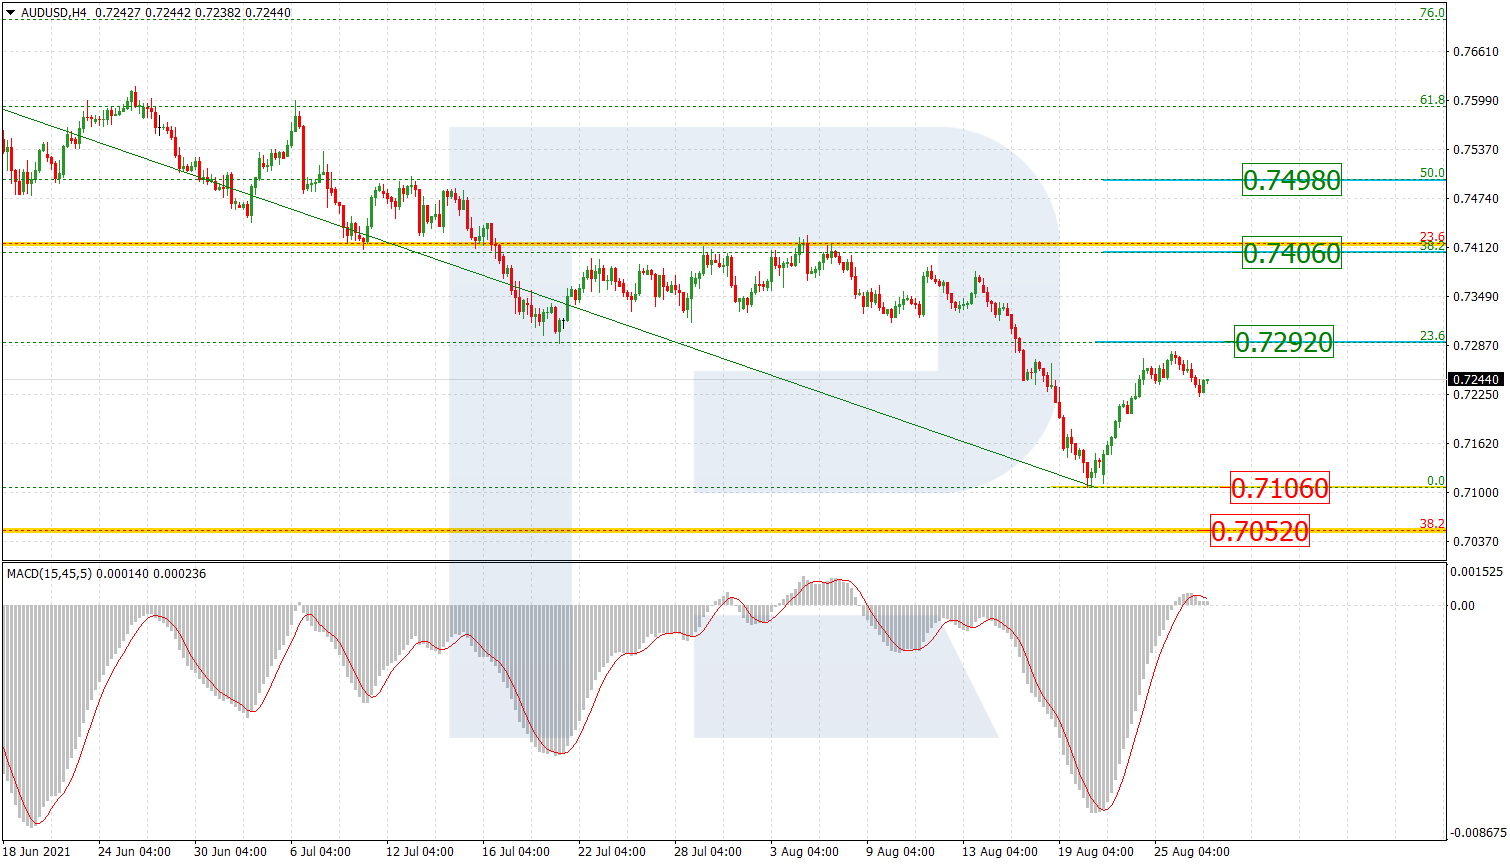
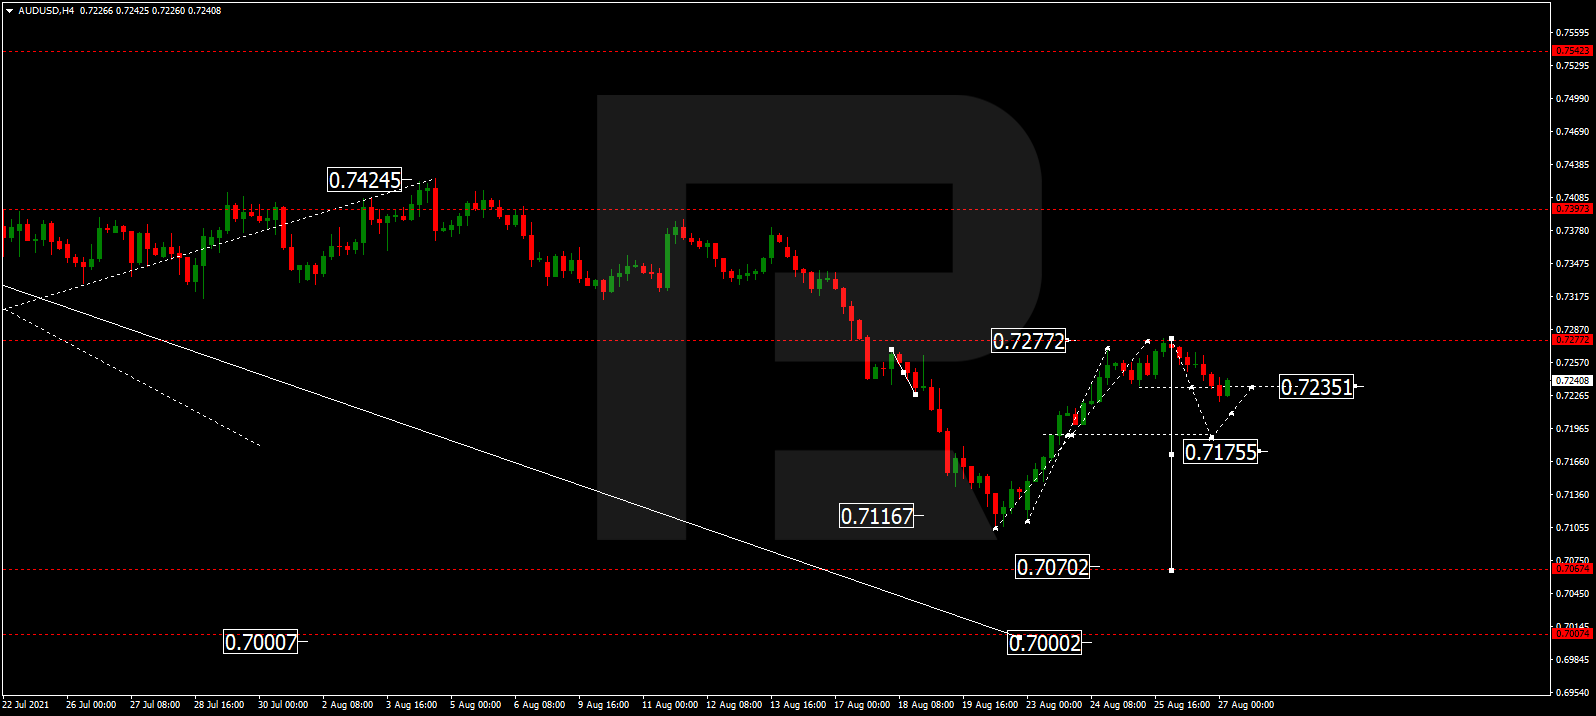
AUDUSD, “Australian Dollar vs US Dollar”
After rebounding from 0.7277, AUDUSD continues falling towards 0.7207. Later, the market may grow to reach 0.7234 and then resume trading within the downtrend with the target at 0.7070.
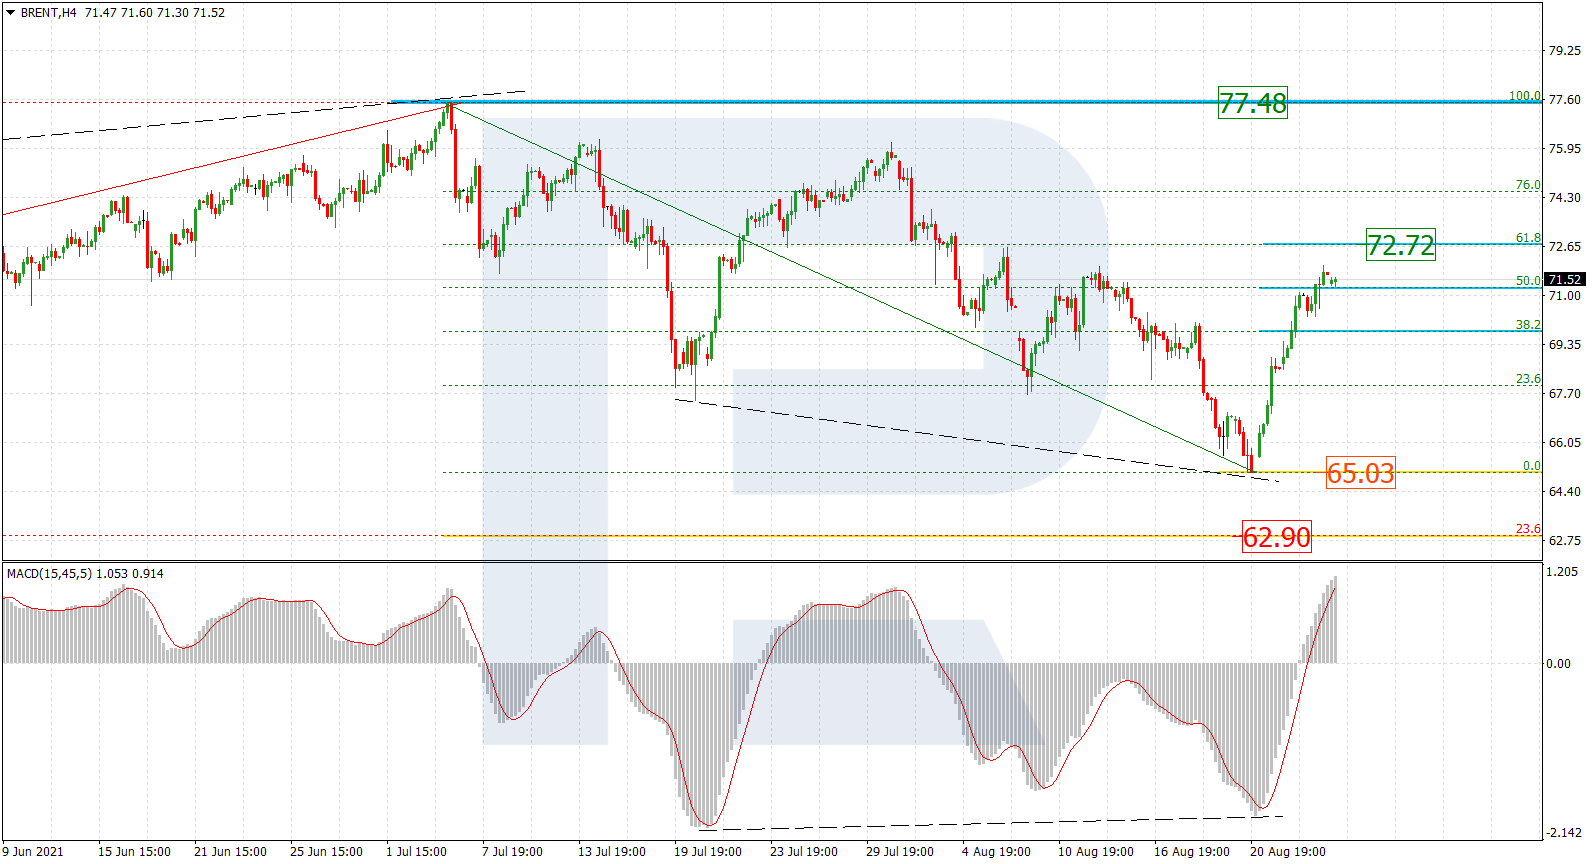
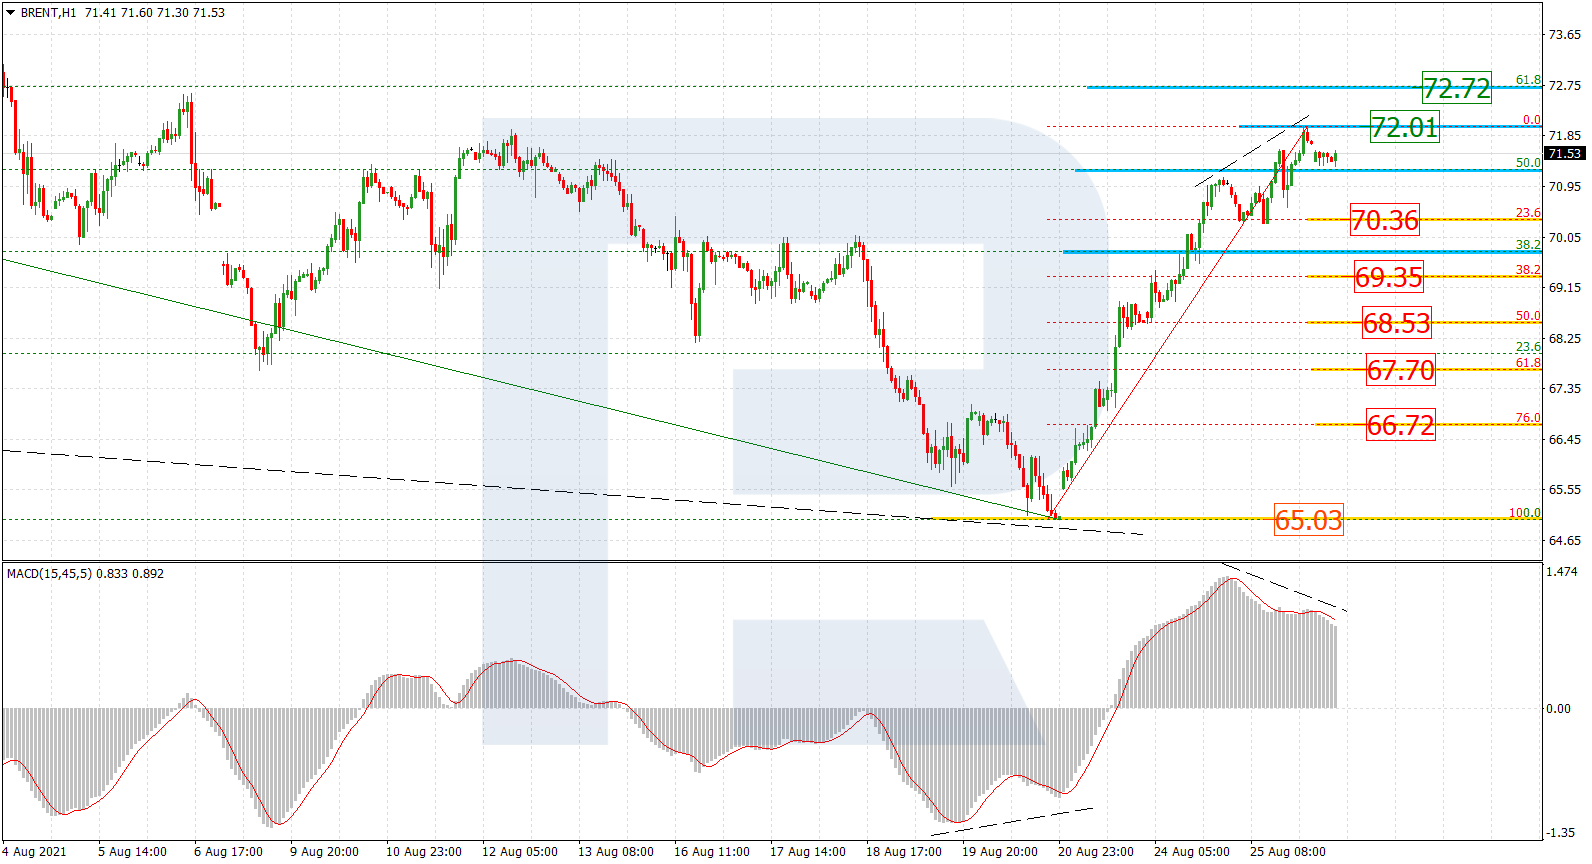
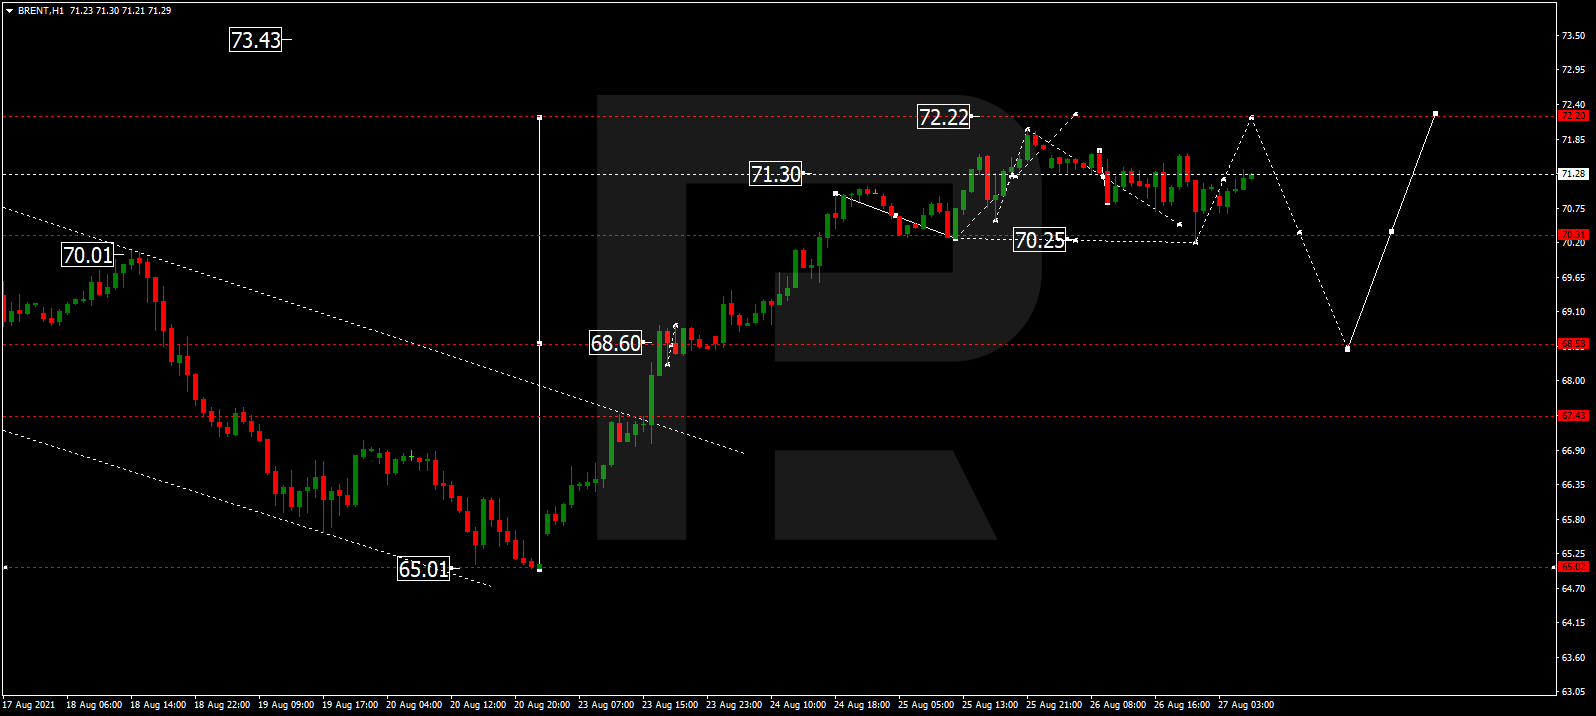
BRENT
After rebounding from 72.00 and finishing the correctional structure at 70.25, Brent is growing towards 72.22 and may later start a new correction to return to 70.25. If the price breaks the latter level to the downside, the market may resume trading downwards to reach 68.60 and then form one more ascending structure with the target at 75.00. On the other hand, the asset may grow to break 72.22 and then continue moving upwards to reach the above-mentioned target.
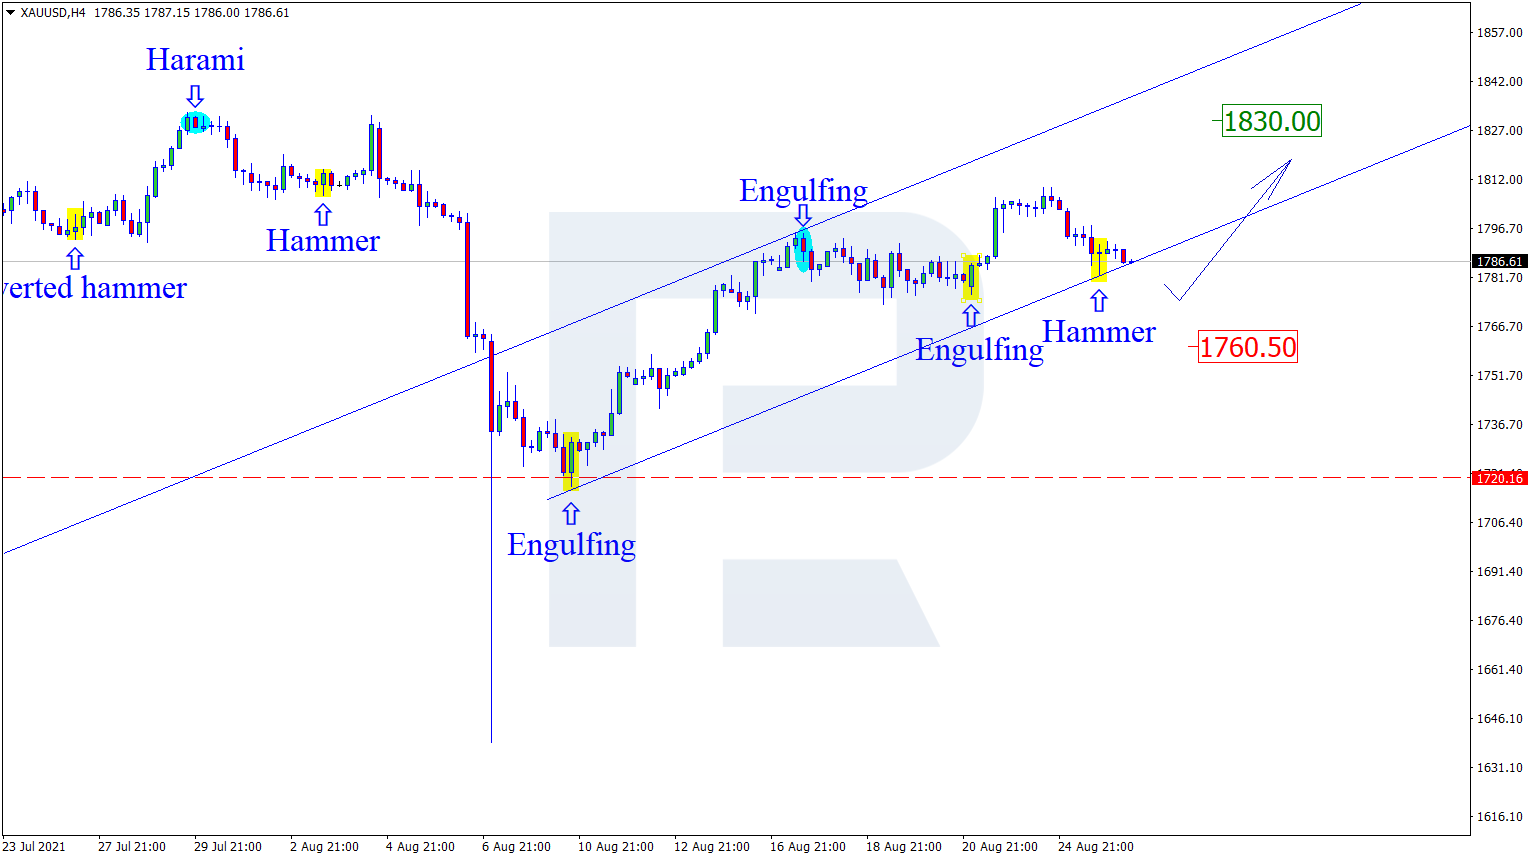
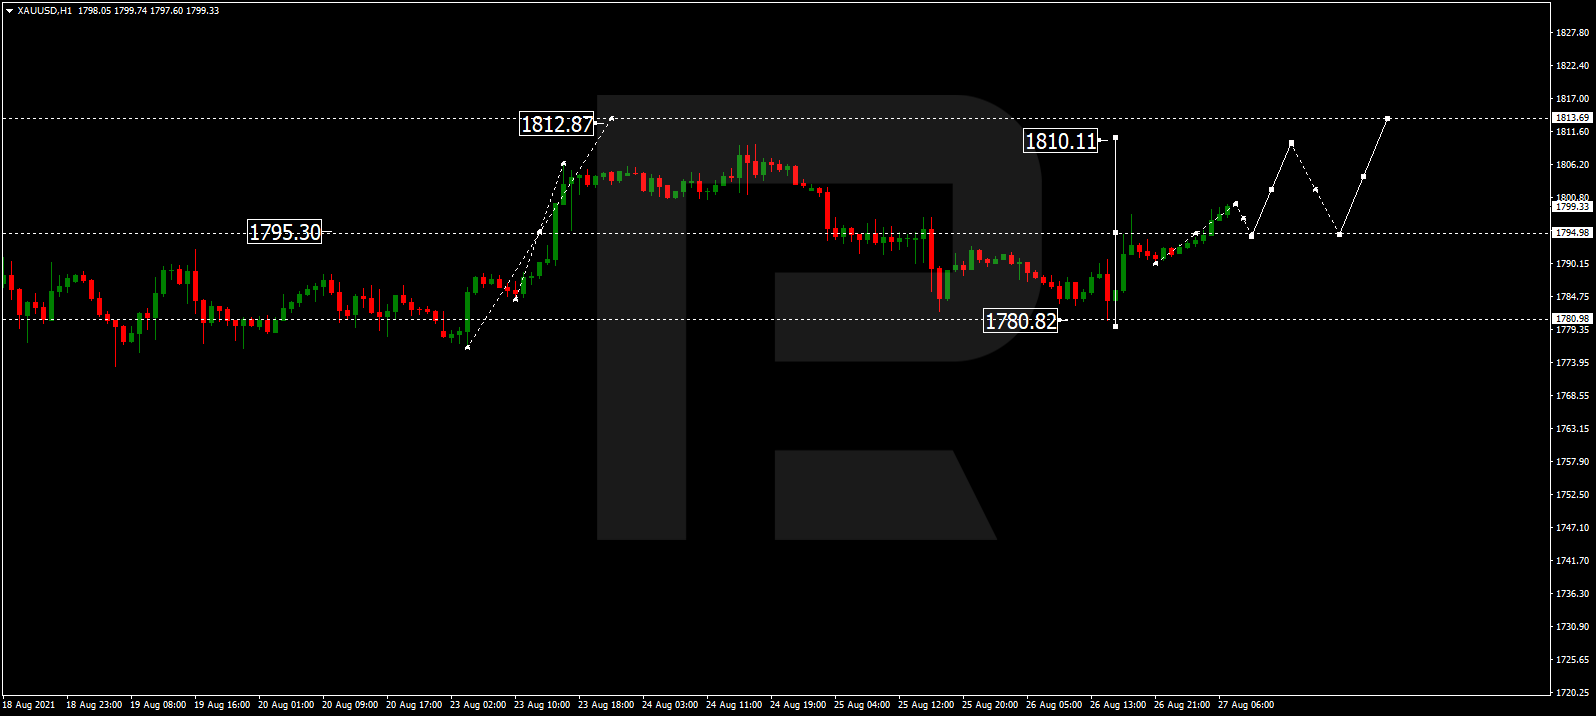
XAUUSD, “Gold vs US Dollar”
After completing the correction at 1780.80 and rebounding from this level, Gold is still moving upwards to reach 1812.82. Later, the market may start a new correction with the target at 1750.00.
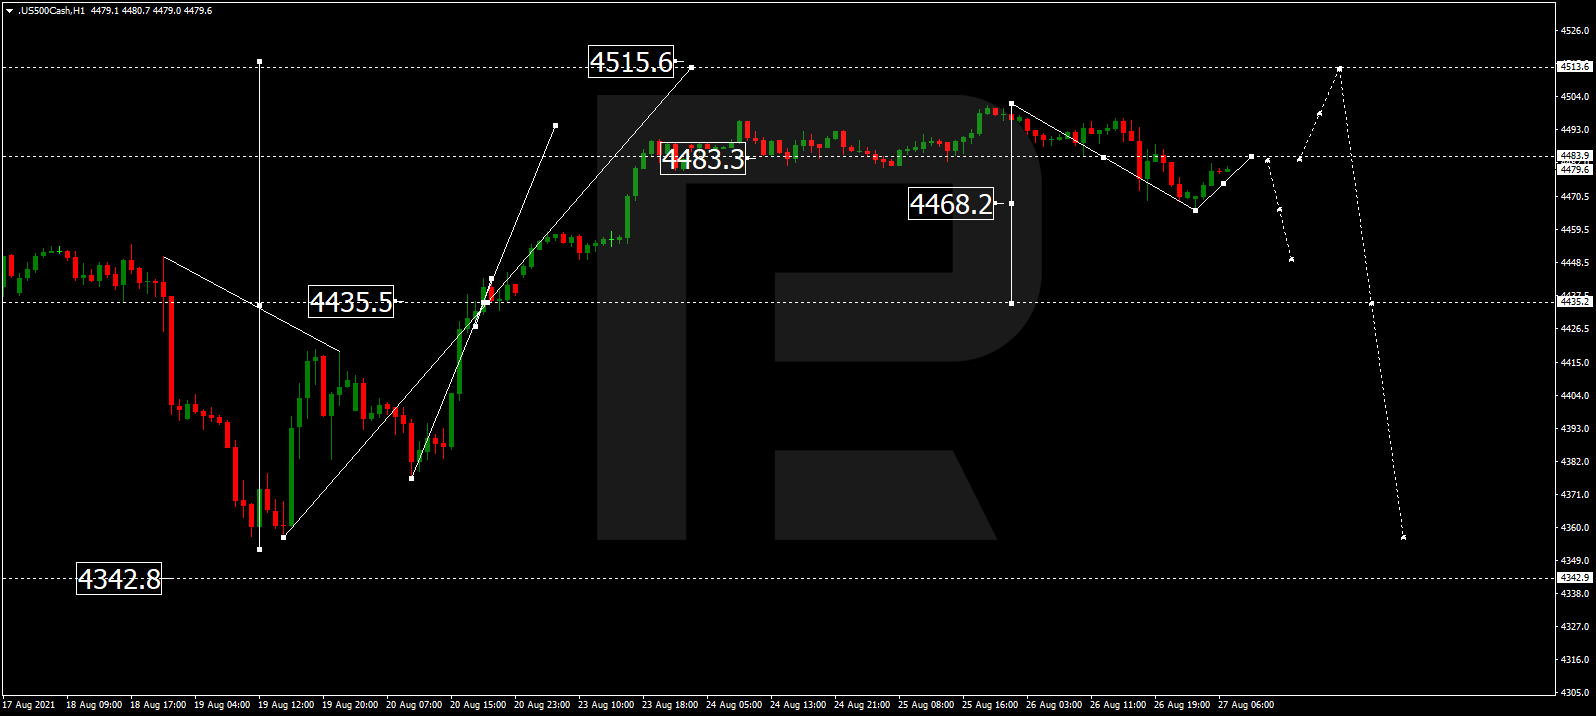
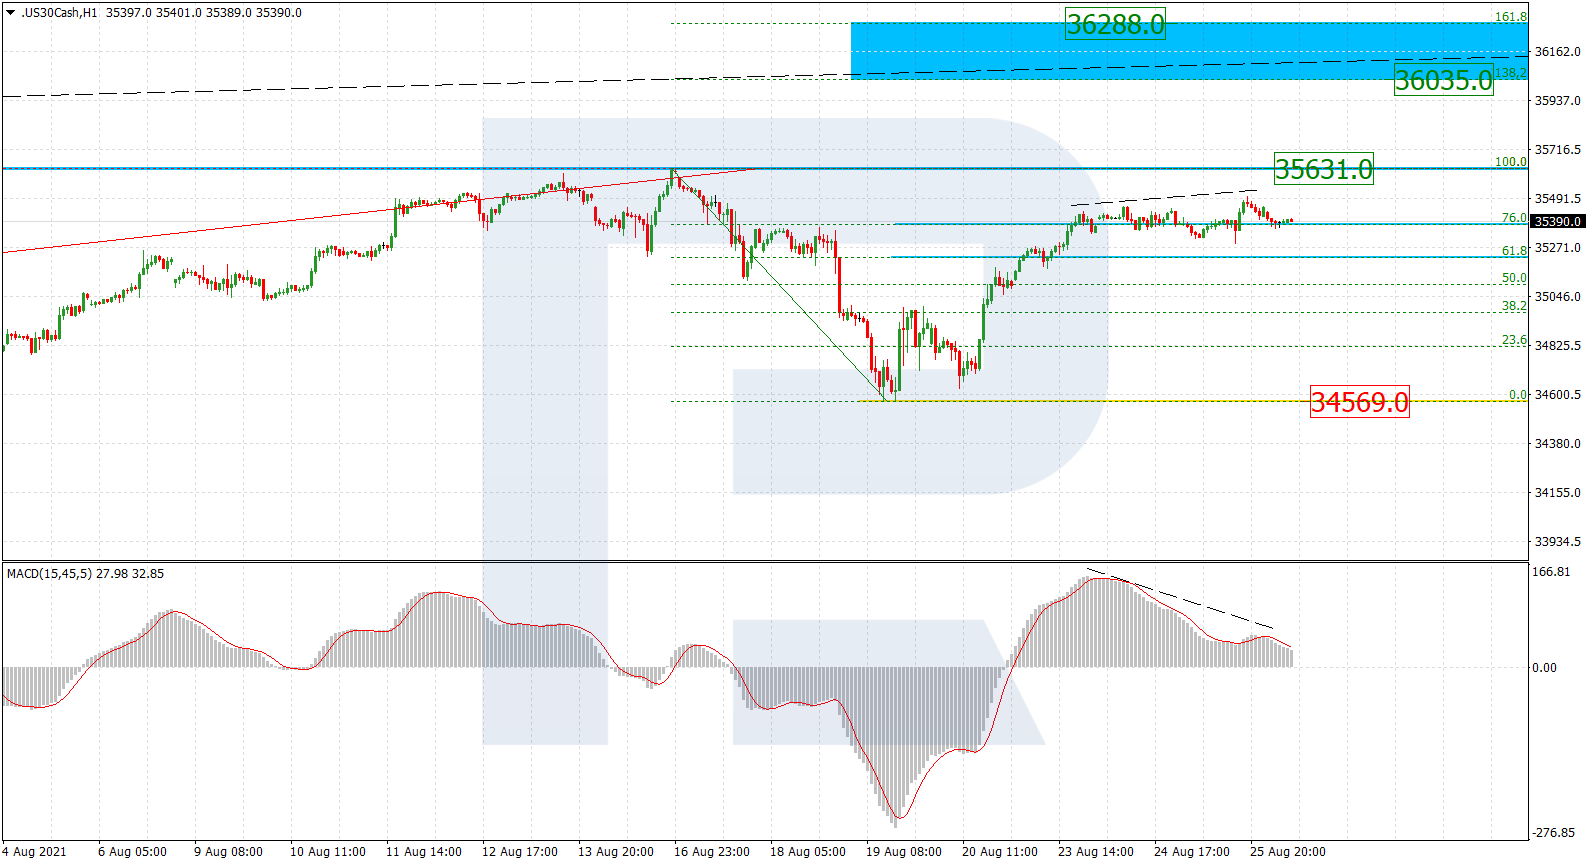
S&P 500
After finishing the descending structure at 4468.2, the S&P index is moving upwards to reach 4484.0. if later the price breaks the latter level to the upside, the market may continue trading upwards to reach 4515.5. On the other hand, if the asset falls and breaks 4468.0, the instrument may form one more descending structure with the target at 4380.0.