The new year will no doubt bring reflection on our past year of outcomes and results as traders. This is as an opportunity to create fresh goals to both improve and excel during the new trading year ahead in 2020.
For those of you who struggled in 2019, this is your chance to press the ‘reset button’ and commit to completely changing your mindset and views on trading. This will include removing the bad habits that you know keep holding you back, and changing how you approach each and every trade throughout the new year ahead.
For those who excelled and made genuine improvements, this is your chance to dissect every aspect of your trading and remove more of those bad habits that you know keep holding you back and of course to keep fine-tuning the good habits that have led to your growth and success over the past year.
No matter if you’re a complete newbie to trading or a veteran trader with 10 years + experience, it’s important you write down your goals, and commit to them at the start of the year and throughout the entire year. Your knowledge and skills would have increased during the past year, so your existing trading plan will also need to be modified. Editing a trading plan each year is something I do personally and strongly I suggest start working on this as well.
This is my first lesson of the new 20’s decade, and the wisdom i’m sharing below was as valid during the last decade as it will be in the new decade ahead. The markets and human psychology of market participants will never change, so the application of the wisdom I am sharing with you here won’t change either.
Here’s my best advice and wisdom on dominating trading in 2020.
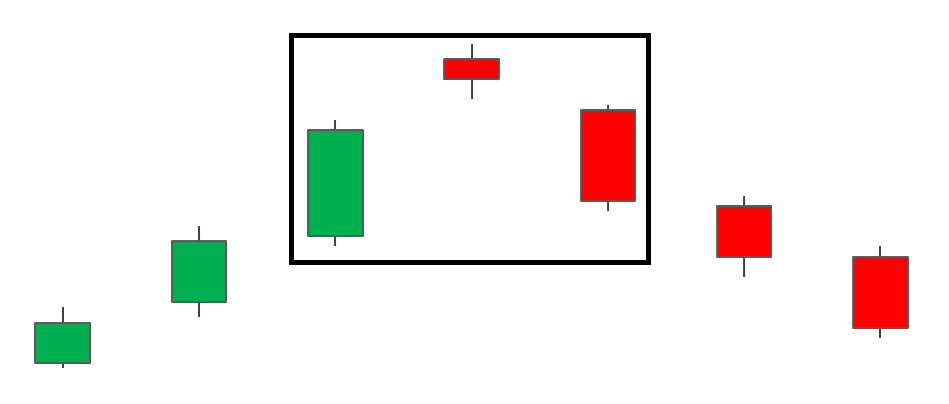
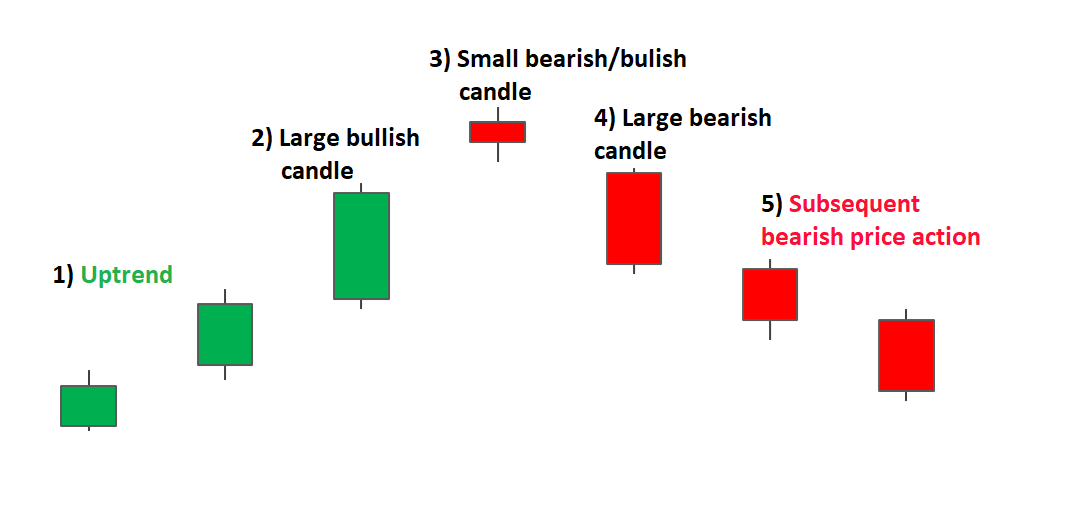
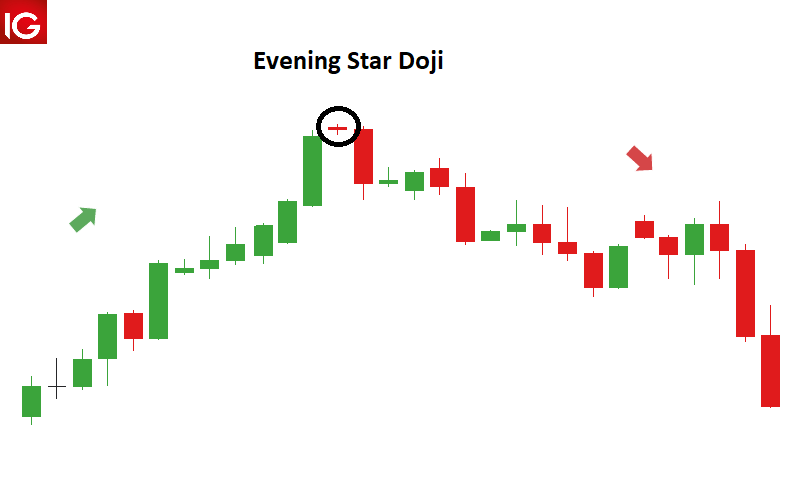
Focus on one single trading strategy or chart pattern until you completely master it.
Instead of focusing on a handful of trading strategies this year, instead, commit to focusing all your energy on studying and trading just ONE single price action signal/price action pattern.
You should aim to become a master of your chosen trading setup, own it, make it yours. Only after mastering your chosen trade setup and achieving great success over a larger series of trades should you move on to mastering another additional price action signal/price action pattern. You must fight the temptation to chop and change trading strategies at all costs. Commit to this one single idea, focus religiously on it and be sure to see it through.
Reduce the time you spend trading, and increase the time you learn about trading.
In my early days as a trader, I was so obsessed to the point where 14 hours of my day was spent watching the screens on my computer or phone, watching for trades, watching open trades, entering and exiting trades constantly. I had no control over my emotions whatsoever and neither do 95% of the traders reading this lesson.
Sadly most traders spend all day and night glued to trading screens or phone screens all day, similar to an addict roaming around a casino watching the cards and dice on the table games. Do not think for a moment that because your smart or educated or have achieved success elsewhere in life that you can’t become addicted to trading, it can happen to anybody. If you spend all your free time in front of the charts looking for the next best trade or watching your open trades tick by tick, you will destroy your trading career and your trading account balance.
It may surprise some of you to learn that I spend less than 1 hour a day analyzing the charts and thinking about what trades i’m going to take, what orders i’m going to place and managing my open trades. There is nothing I can achieve watching markets or trades, I have no control over what the market is doing or will do. Trading is often like watching paint dry most of the time. I suggest you don’t come to the market every day looking for excitement or action, it isn’t here.
Fix your personal confirmation bias about trades and the market in general.
You may not know this, but you look at the market with a different set of eyes depending on 2 things. 1. are you in a trade or 2. are you looking for a trade. This is a type of ‘confirmation’ bias that most humans can’t remove without serious practice and experience. Traders make mistakes because they are programmed to have a bias about everything that is happening or is about to happen.
An example of this bias would be the following:
You buy gold today, it goes up $20 in one day and you feel confident, you then see a news article the next say that says a war in Iran has broken out and that gold will probably go up, and you start feeling even more confident.
The second example would simply be the opposite of the above:
You buy gold today, it goes down $20, you don’t feel confident, you then see news that says war with Iran was averted and didn’t break out, and that gold will probably go down, and you start feeling even more worse.
Now I want you to ask yourself, did gold going up or down, or the news events about war starting or ending, have ANY impact on your original trade entry and the price action setup you used to confirm your entry ? The answer is obviously no, but yet 95% of traders will still develop a bias because of these ‘confirming factors’ that unfold.
What I want you to understand here is actually simple in theory and almost impossible to execute in the real world, and it will take a lot of practice to fix. You must approach every decision, be it a trade entry, a trade exit, or anything in between, with 100% neutrality, zero bias and zero attachment. So in a way, that means thinking and acting in an almost inhumane and robotic, unempathetic manner.
Humans are a natural organic creature with billions of years of evolution that has contributed to how we think and operate in general. Financial markets is game humans invented, it isn’t part of our organic evolution. We have to learn the rules of the game and completely master our emotions to play it.
The next time you’re in a trade or about to enter a trade, don’t listen to external influences like news articles or videos on YouTube, and don’t ever go searching for information to convince you that you have made the right or wrong decision about a trade. You are the only one who should determine this!
Be aware of and avoid Recency Bias.
Recency bias is when a person or group of people believe what is happening now or what has been happening in the recent past will continue happening in the future. Recency bias in trading would be best described when traders and investors see the stock market trending up for several years and are completely convinced the same upward trend will continue for the next several years. It is classic human behavior, we are in love with what is happening now and believe what is happening now will simply continue, without ever looking for contrarian evidence to our view or even considering another version of events may unfold.
For example, a trader may have a winning streak for 3 months and every day that winning streak lasts, they will become more and more confident and may actually start behaving like they are invincible. The end result is the trader increasing risk to unreasonable levels, becoming way too confident and completely forgetting his trading plan and predetermined rules of business.
The trader who is blinded by recency bias, starts trading in a completely different manner to what brought them this string of recent success and it is ultimately this overconfident and greedy state of mind leads to this trader giving up all the gains they just made and maybe even more. Don’t become drunk on recent success, instead always make it day 1 and treat every trade as a unique situation, sticking to the rules and processes you have in place! You can read an expanded article I wrote about recency bias here.
Write out your big goals as affirmations and read them once every few days to yourself out loud.
Old school affirmations taught by the great success and business authors of our time like Napoleon Hill / Carnegie, 100% still work and have worked for me for 16 + years in trading, business and life.
If you want to change something or achieve something, you should immediately write it down on paper as well as cue cards, and read them to yourself out loud every few days, or better yet, every single morning and evening.
Goal setting with affirmations is a little more complex than simply wring down “I want to be rich” or “I want to be a good trader”. Here are a few of my own affirmations from the past to get you started on how these statements should look on paper. The goals can be forward-looking e.g: “I will” or they can be positively assumptive of a future outcome e.g: “I am”, or they can be ‘self commanding” e.g: “I must”
“I will become a profitable trader by consistently managing my risk and managing my emotions”
“I am a professional trader
“I must trade like a business”
“I do not know what trade setup will win or lose, therefore I must take every trade that matches my trading plan without question”
Slow it all down.
I have said this in 50% of the lessons on this blog so I won’t go into much detail here again about the virtues of being patient and waiting for the best trades to find you.
To experience the big moves and the big risk reward trades, you really have to hold your trades way longer, to the point where you will feel uncomfortable and stressed.
Avoid living in a state of hindsight and frustration, let your trades play out and mature and bear fruit for you. Don’t harvest the fruit before it’s ready and don’t panic because of a spell of short term bad weather.
Would you watch a fruit tree grow and the fruit grow on it’s branches repetitively? The market is so much slower than you imagine, so give it space to breathe and time to move.
The other benefit of slowing down your trading is:
- You avoid Churning your account
- There is less chance of trading during a period of sideways whipsawing choppy price action and ultimately bleeding your account.
- There is less chance of becoming addicted to trading
A few solid trades a month is sufficient to build a substantial trading account and lifestyle over the long run. You may even find there won’t be anything to do for days and weeks, this is a good thing and it means your moving closer to a professional trader’s mindset.
Don’t miss trades.
We all miss those big trades, but it’s how many of those big trades you miss in a year that defines you as a trader. Most of you will likely experience the deer in headlight syndrome where you freeze in the face of great trade setup or you second guess yourself after analyzing a chart to death and eventually convince yourself out of a perfectly good trade setup. As you may already know, a lot of these missed trades will often turn into great winning trades, and almost every time it happens you’re NOT in the trade.
Because the outcomes of each trade are randomly distributed over time, nobody has the skill to ever know for certain what trades will be winners and what ones will be losers. Use this unavoidable statistical reality to build your confidence to start taking more trades that match your trading plan conditions, and keep subjecting yourself to the edge you have identified and profit from it. If you keep deviating from your plan and avoiding trade setups because you ‘think yourself out of them‘, you will destroy whatever edge you have/had in the market.
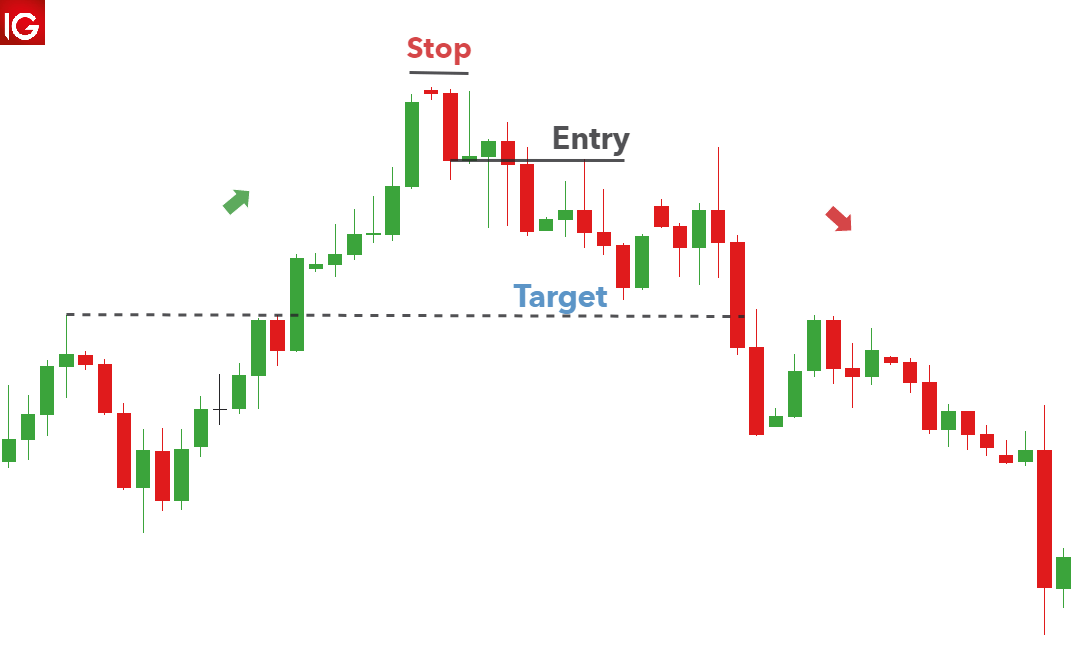
Exit trades if they are near your target.
Apart from missing good trades for no reason, the other big problem I constantly hear about on the email support line is traders missing out on profit targets being hit OR winners turning into losers because their profit target was missed and the trade reversed soon after.
There are 3 possible solutions for this problem:
Exit the trade a few pips before your planned profit target level every time. That way you’re not sitting there for hours panicking about the market getting close to your exit point but not yet reaching the level perfectly.
Every time you pick a profit target in the future, try not to be so perfect and instead make it 10 pips less than the original level you identified to exit the trade. That way you might start seeing more profit target orders filled and completed as planned.
You could also look for lower R multiple rewards to build confidence. Instead of always looking for 2 to 1 or 3 to 1, perhaps look for 1 to 1 or 1.5 to 1 for the next 20 trades and see if you can build your confidence by hitting some winners consistently.Be sure to monitor each trade to see how far they went after your exit, as this will give you insight as to how much you can increase your multiple targets in the future. Taking profits that are smaller like this isn’t sustainable forever, but you will surely build more confidence and learn a lot during this period, so it’s well worth the exercise.
Risk the same amount per trade.
The single biggest reason traders fail is poor capital management, particularly how much they risk per trade. It’s a boring topic but it’s an essential topic that will save your butt over the long run.
It’s crucial you pick a fixed $ risk per trade and stick to it until you reach somewhere around 50 R to 100 R in total R profit units during a 12 month period. Why would anybody risk more money on the next trade if they can’t prove to themselves they can make money over a long period of time?
Think about this long and hard next time you randomly decide to go full tilt and risk more money on the next trade than you did on the previous trade. Until you have built your own record of profitability and have absolute confidence in what you’re doing, do yourself and your bank balance a favor and stick to a fixed $ amount you predetermine in your trading plan and don’t deviate from that amount.
Avoid trading markets you shouldn’t be.
There are 1000’s of markets and they are all available to trade with the click of a button. However, not all markets are created equal due to liquidity and size, and this changes the odds.
There is simply no need to deviate away from the most liquid and most widely followed markets such as Major FX, Major Stock Indices, Gold, and Oil etc. The professionals almost exclusively trade these markets and so should you. Do you really think trading the Turkish Lira is better for you over the long run than say trading the Euro Dollar ? I strongly suggest you avoid being tempted by exotic markets, simply delete them from your watch list. For your own reference, the markets I trade most frequently include. EURUSD, GBPUSD, USDJPY, AUDUSD, NZDUSD, EURJPY, GBPJPY, CRUDE OIL, GOLD, S&P 500, HANG SENG, SPI 200 and DAX.
Take stock of what you did right and what you did wrong.
Recap what you did well:
I’m sure 2019 had ups as well as downs, and there is always something positive to take out of the year that was. It’s important to take note of the things you did well in your trading this year. Make notes of what you did right and pat yourself on the back for those things. Staying disciplined in your trading over the course of a full year is very difficult. So, if you did stay disciplined, even with only certain aspects of your trading approach, make sure you continue to do it in the new year.
Recap what you did wrong:
What did you do wrong in your trading over the last year and how do you intend to fix that in 2020?
A fellow professional trader once told me, “Focus little on your losers and even less on your winners”. It wasn’t until some years later that I began to understand what he really meant. He meant that each moment in the market is unique and no two trades are ever ‘exactly’ the same. Every time you see a similar looking trade setup, the result will be different and the trades that win or lose will be random over time.
Traders usually fail from making the same mistakes over and over and not learning from them. So you have to decide to make the change for the new year ahead. Are you making emotional decisions to enter and exit trades based on fear and greed? Are you risking too much per trade ? Are you changing trading strategies constantly and not respecting the rules in your trading plan for trade entries ?
A lot of getting on the right track with trading is about just making a ‘decision to change’. Most of the trading errors that lead to losses can be avoided by controlling yourself and sticking to your plan and rules. That is, running everything like a business.
Devise a plan to improve.
You need to be progressing forward in both trading and life. Commit to ending repetitive trading mistakes that you know you can fix; errors like trading with no valid trade signal present, risking way more than you know you should, entering and exiting trades because of fear or greed and complete lack of emotional and self-control. It’s these common errors that typically cause a trader to crash and burn.
The only way to make money trading is by having a trading strategy, making a trading plan from it and having the discipline and mental strength to stick to it over a long enough period of time to let your winning trades offset your losers.
If you you know you’ve faltered in 2019, right now at the start of 2020 is the best time to take stock of what you did right, what you did wrong and try to figure out how you can improve. You don’t want to be sitting here in the same position a year from now do you ? If not, then take action now.
Conclusion.
I hope today’s lesson will give you some inspiration to start the process of analyzing what you did right and wrong over this last year so that you can create a list of goals and affirmations for the 2020 New Year ahead. This exercise will hopefully be what you need to get your trading on the right track this year.
- What’s your biggest ongoing problem in the market?
- What’s something you know you need to improve in your trading over the next year?
- What is your main goal to achieve in 2020 ?
- Do you have any affirmations you plan on reading to yourself each day ?
Please share your answer in the comments below! By doing so, you not only help yourself by being accountable, but you also help your fellow traders by letting them know they are not alone with what problems they are facing and what goals they have.