Japanese Candlesticks Analysis 31.03.2020 (EURUSD, USDJPY, EURGBP)

Japanese Candlesticks Analysis 31.03.2020 (EURUSD, USDJPY, EURGBP)

31.03.2020

EURUSD, “Euro vs. US Dollar”

As we can see in the H4 chart, after returning to the rising channel’s downside border, EURUSD has formed a Harami reversal pattern there. At the moment, the pair is reversing. We may assume that later the price may correct to reach 1.0930 and then resume the ascending tendency. In this case, the upside target may be at 1.1320.

EURUSD
Risk Warning: the result of previous trading operations do not guarantee the same results in the future

USDJPY, “US Dollar vs. Japanese Yen”

As we can see in the H4 chart, USDJPY is still recovering after the fall. Right now, the pair is testing the support level, where it has formed several reversal patterns, such as Harami and Hammer. Possibly, the price may reverse and reach 110.80. The current situation implies that the instrument may yet resume falling towards 105.72 but this scenario is rather unlikely.

USDJPY
Risk Warning: the result of previous trading operations do not guarantee the same results in the future

EURGBP, “Euro vs. Great Britain Pound”

As we can see in the H4 chart, after reaching the support level, EURGBP has formed a Hammer reversal pattern there. At the moment, the pair started reversing. We may assume that later the market may rebound towards 0.9300 and continue the descending tendency. However, one shouldn’t exclude an opposite scenario, which implies that the instrument may continue falling towards 0.9030 without any pullbacks. In this case, the target may be at 0.8745.

EURGBP
Risk Warning: the result of previous trading operations do not guarantee the same results in the future

Forex Technical Analysis & Forecast 31.03.2020

Forex Technical Analysis & Forecast 31.03.2020

31.03.2020

EURUSD, “Euro vs US Dollar”

After forming a correctional continuation pattern at 1.1053 and breaking it downwards, EURUSD is trading to reach the short-term target at 1.0980. Later, the market may form one more ascending structure to return to 1.1053 and then resume falling towards 1.0970.

EURUSD
Risk Warning: the result of previous trading operations do not guarantee the same results in the future

GBPUSD, “Great Britain Pound vs US Dollar”

After completing two descending impulses along with the correction at 1.2343, GBPUSD is expected to start the third impulse to reach 1.2185. After that, the instrument may form one more ascending structure with the target at 1.2345.

GBPUSD
Risk Warning: the result of previous trading operations do not guarantee the same results in the future

USDCHF, “US Dollar vs Swiss Franc”

After breaking the descending channel, USDCHF is still trading upwards. Possibly, the pair may reach 0.9685 and then resume trading downwards with the target at 0.9595.

USDCHF
Risk Warning: the result of previous trading operations do not guarantee the same results in the future

USDJPY, “US Dollar vs Japanese Yen”

USDJPY is moving upwards. Possibly, today the pair may correct to reach 109.45 and then resume trading inside the downtrend with the target at 108.35.

USDJPY
Risk Warning: the result of previous trading operations do not guarantee the same results in the future

AUDUSD, “Australian Dollar vs US Dollar”

AUDUSD is forming a wide consolidation range above 0.6070. After breaking this level to the downside, the instrument may continue trading downwards to reach 0.5920 and then start another growth to return to 0.6070.

AUDUSD
Risk Warning: the result of previous trading operations do not guarantee the same results in the future

USDRUB, “US Dollar vs Russian Ruble”

USDRUB is consolidating around 79.75. If later the price breaks this range to the upside, the market may form one more ascending structure towards 82.25; if to the downside – resume trading downwards with the target at 75.95.

USDRUB
Risk Warning: the result of previous trading operations do not guarantee the same results in the future

USDCAD, “US Dollar vs Canadian Dollar”

USDCAD is trading upwards. Today, the pair may reach 1.4300 and then form a new descending structure towards 1.4160. Later, the market may start another growth with the target at 1.4404.

USDCAD
Risk Warning: the result of previous trading operations do not guarantee the same results in the future

XAUUSD, “Gold vs US Dollar”

Gold is still consolidating around 1617.67. Possibly, today the pair may fall to break 1609.00. After that, the instrument may continue trading downwards with the target at 1597.66.

GOLD
Risk Warning: the result of previous trading operations do not guarantee the same results in the future

BRENT

Brent has updated 22.33. Possibly, today the pair may grow towards 24.62 and then form a new descending structure to reach 23.50, thus forming a new consolidation range between these two levels. If later the price breaks this range to the upside, the market may form one more ascending structure towards 28.50; if to the downside – resume trading downwards with the target at 22.00.

BRENT
Risk Warning: the result of previous trading operations do not guarantee the same results in the future

BTCUSD, “Bitcoin vs US Dollar”

BTCUSD is still trading around 6150.00. The main scenario implies that the instrument may fall towards the downside border of this range at 5700.00 and then start a new growth to break 6600.00. Later, the market may continue trading upwards with the target at 7600.00.

BTCUSD
Risk Warning: the result of previous trading operations do not guarantee the same results in the future

Ichimoku Cloud Analysis 31.03.2020 (BTCUSD, XAUUSD, AUDUSD)

Ichimoku Cloud Analysis 31.03.2020 (BTCUSD, XAUUSD, AUDUSD)

31.03.2020

BTCUSD, “Bitcoin vs US Dollar”

BTCUSD is trading at 6372.00; the instrument is moving inside Ichimoku Cloud, thus indicating a sideways tendency. The markets could indicate that the price may test the cloud’s upside border at 6555.00 and then resume moving downwards to reach 4365.00. Another signal to confirm further descending movement is the price’s rebounding from the rising channel’s downside border. However, the scenario that implies further decline may be canceled if the price breaks the cloud’s upside border and fixes above 6955.00. In this case, the pair may continue growing towards 7805.00. After breaking the support area and fixing below 5665.00, the price may resume moving downwards and finish a Head & Shoulders pattern.

BITCOIN
Risk Warning: the result of previous trading operations do not guarantee the same results in the future

XAUUSD, “Gold vs US Dollar”

XAUUSD is trading at 1615.00; the instrument is moving above Ichimoku Cloud, thus indicating an ascending tendency. The markets could indicate that the price may test Tenkan-Sen and Kijun-Sen at 1605.00 and then resume moving upwards to reach 1715.00. Another signal to confirm further ascending movement is the price’s rebounding from the downside border of a Triangle pattern. However, the scenario that implies further growth may be canceled if the price breaks the cloud’s downside border and fixes below 1525.00. In this case, the pair may continue falling towards 1495.00.

GOLD
Risk Warning: the result of previous trading operations do not guarantee the same results in the future

AUDUSD, “Australian Dollar vs US Dollar”

AUDUSD is trading at 0.6206; the instrument is moving above Ichimoku Cloud, thus indicating a bullish tendency. The markets could indicate that the price may test Tenkan-Sen and Kijun-Sen at 0.6135 and then resume moving upwards to reach 0.6545. Another signal to confirm further ascending movement is the price’s rebounding from the rising channel’s downside border. However, the scenario that implies further growth may be canceled if the price breaks the cloud’s downside border and fixes below 0.5805. In this case, the pair may continue falling towards 0.5720.

AUDUSD

Murrey Math Lines 31.03.2020 (AUDUSD, NZDUSD)

Murrey Math Lines 31.03.2020 (AUDUSD, NZDUSD)

31.03.2020

AUDUSD, “Australian Dollar vs US Dollar”

As we can see in the H4 chart, AUDUSD is moving above 1/8. In this case, the pair is expected to continue growing to reach the resistance at 3/8. However, this scenario may be canceled if the price breaks 1/8 to the downside. After that, the instrument may continue falling towards the support at 0/8.

AUDUSD_H4
Risk Warning: the result of previous trading operations do not guarantee the same results in the future

In the M15 chart, the pair may break the upside line of the VoltyChannel indicator and, as a result, continue trading upwards.

AUDUSD_M15
Risk Warning: the result of previous trading operations do not guarantee the same results in the future

NZDUSD, “New Zealand Dollar vs US Dollar”

As we can see in the H4 chart, NZDUSD is no longer moving inside the “oversold area” after breaking 0/8. In this case, the pair is expected to continue growing to reach the resistance at 2/8. However, this scenario may no longer be valid if the price breaks 0/8. After that, the instrument may continue falling towards 1/8.

NZDUSD_H4
Risk Warning: the result of previous trading operations do not guarantee the same results in the future

In the M15 chart, the pair may break the upside line of the VoltyChannel indicator and, as a result, continue moving upwards.

NZDUSD_M15
Risk Warning: the result of previous trading operations do not guarantee the same results in the future

Fibonacci Retracements Analysis 31.03.2020 (EURUSD, USDJPY)

Fibonacci Retracements Analysis 31.03.2020 (EURUSD, USDJPY)

31.03.2020

EURUSD, “Euro vs US Dollar”

In the daily chart, the convergence on MACD made the pair complete a strong descending impulse and start a new correctional uptrend, which has already reached 23.6% fibo and may later continue towards 38.2% and 50.0% fibo at 1.1370 and 1.1595 respectively, thus reversing the long-term trend. Still, onу shouldn’t exclude the possibility of another descending impulse. If EURUSD breaks the low at 1.0635, the instrument may continue falling to reach the post-correctional extension area between 138.2% and 161.8% fibo between 1.0503 and 1.0336 respectively.

EURUSD_D1
Risk Warning: the result of previous trading operations do not guarantee the same results in the future

As we can see in the H1 chart, the divergence forced the pair reverse after reaching 61.8% fibo at 1.1167 and start a new short-term pullback, which has already reached 23.6% fibo. In the future, the price may continue falling towards 38.2%, 50.0%, 61.8%, and 76.0% fibo at 1.0951, 1.0852, 1.0830, and 1.0758 respectively. If later the instrument breaks the latter level, it may continue falling to reach the low at 1.0635. However, if the pair breaks the high at 1.1147, the price may continue trading upwards.

EURUSD_H1
Risk Warning: the result of previous trading operations do not guarantee the same results in the future

USDJPY, “US Dollar vs. Japanese Yen”

As we can see in the H4 chart, the divergence made the pair reverse after reaching the high at 112.23 and start a new decline. The current technical picture indicates that this decline may continue down to the low at 101.18 or even lower, the post-correctional extension area between 138.2% and 161.8% fibo between 101.48 and 99.66. To throw light on a future trend, it’s better to check changes on shorter timeframes.

USDJPY_H4
Risk Warning: the result of previous trading operations do not guarantee the same results in the future

In the H1 chart, the convergence made the price start a new rising tendency after reaching 61.8% fibo. The short-term upside targets may be the high at 111.71.

USDJPY_H1
Risk Warning: the result of previous trading operations do not guarantee the same results in the future

rfxsignals March 31, 2020 No Comments

DAILY FREE FOREX SIGNALS – 31-03-2020

EURGBP BUY: 0.89269
SL: 0.88727
TP1: 0.89476
TP2: 0.89692
#mt4 #forex #forextrader #trading #forextrading #bitcoin #trader
#cryptocurrency #forexlifestyle #entrepreneur
#crypto #forexsignal #investment #business
#binaryoption #passiveincome #daytrader #btc

EURJPY BUY: 119.376
SL: 118.543
TP1: 119.591
TP2: 119.845
#mt4 #forex #forextrader #trading #forextrading #bitcoin #trader
#cryptocurrency #forexlifestyle #entrepreneur
#crypto #forexsignal #investment #business
#binaryoption #passiveincome #daytrader #btc

GBPCAD SELL: 1.74651
SL: 1.76267
TP1: 1.74407
TP2: 1.74151
#mt4 #forex #forextrader #trading #forextrading #bitcoin #trader
#cryptocurrency #forexlifestyle #entrepreneur
#crypto #forexsignal #investment #business
#binaryoption #passiveincome #daytrader #btc

CADJPY BUY: 76.528
SL: 75.925
TP1: 76.799
TP2: 77.098
#mt4 #forex #forextrader #trading #forextrading #bitcoin #trader
#cryptocurrency #forexlifestyle #entrepreneur
#crypto #forexsignal #investment #business
#binaryoption #passiveincome #daytrader #btc

GBPJPY SELL: 133.496
SL: 134.222
TP1: 133.277
TP2: 133.040
#mt4 #forex #forextrader #trading #forextrading #bitcoin #trader
#cryptocurrency #forexlifestyle #entrepreneur
#crypto #forexsignal #investment #business
#binaryoption #passiveincome #daytrader #btc

NZDUSD BUY: 0.60293
SL: 0.59386
TP1: 0.60556
TP2: 0.60830
#mt4 #forex #forextrader #trading #forextrading #bitcoin #trader
#cryptocurrency #forexlifestyle #entrepreneur
#crypto #forexsignal #investment #business
#binaryoption #passiveincome #daytrader #btc

USDCAD BUY: 1.42204
SL: 1.39635
TP1: 1.42508
TP2: 1.42847
#mt4 #forex #forextrader #trading #forextrading #bitcoin #trader
#cryptocurrency #forexlifestyle #entrepreneur
#crypto #forexsignal #investment #business
#binaryoption #passiveincome #daytrader #btc

AUDUSD BUY: 0.61715
SL: 0.60554
TP1: 0.61920
TP2: 0.62132
#mt4 #forex #forextrader #trading #forextrading #bitcoin #trader
#cryptocurrency #forexlifestyle #entrepreneur
#crypto #forexsignal #investment #business
#binaryoption #passiveincome #daytrader #btc

EURCHF SELL: 1.05804
SL: 1.06040
TP1: 1.05588
TP2: 1.05379
#mt4 #forex #forextrader #trading #forextrading #bitcoin #trader
#cryptocurrency #forexlifestyle #entrepreneur
#crypto #forexsignal #investment #business
#binaryoption #passiveincome #daytrader #btc

EURCAD SELL: 1.55882
SL: 1.56646
TP1: 1.55643
TP2: 1.55407
#mt4 #forex #forextrader #trading #forextrading #bitcoin #trader
#cryptocurrency #forexlifestyle #entrepreneur
#crypto #forexsignal #investment #business
#binaryoption #passiveincome #daytrader #btc

AUDJPY SELL-66.844
SL-67.497
TP1-66.580
TP2-66.225

EURUSD SELL-1.09849
SL-1.11326
TP1-1.09305
TP2-1.08727

GBPCHF SELL -1.18345
SL-1.19062
TP1-1.18172
TP2-1.17999

EURAUD SELL-1.77343
SL-1.80845
TP1-1.75525
TP2-1.73235

EURGBP BUY -0.89421
SL0.88674
TP1-0.89634
TP2-0.89856

GBPUSD SELL-1.22104
SL-1.25990
TP1-1.20757
TP2-1.19514

EURGBP BUY -0.89809
SL-0.87390
TP1-0.90642
TP2-0.91935

USDCAD BUY -1.41739
SL-1.38506
TP1-1.43315
TP2-1.45719

GBPCHF SELL -1.17613
SL-1.20070
TP1-1.16535
TP2-1.15031

GBPCAD SELL-1.73639
SL-1.76790
TP1-1.71940
TP2-1.70735

GBPAUD BUY -1.99671
SL-1.98215
TP1-2.00281
TP2-2.00941

USDJPY BUY -108.844
SL-107.104
TP1-109.559
TP2-110.406

AUDUSD SELL-0.61456
SL-0.62172
TP1-0.61255
TP2-0.60762

EURAUD BUY -1.78846
SL-1.77134
TP1-1.79532
TP2-1.80927

NZDUSD SELL-0.59792
SL-0.60398
TP1-0.59595
TP2-0.59378

AUDUSD SELL-0.61591
SL-0.62173
TP1-0.61361
TP2-0.61135

EURJPY SELL-119.070
SL-119.740
TP1-118.862
TP2-118.488

NZDCHF SELL-0.57661
SL-0.58053
TP1-0.57478
TP2-0.57293

NZDCAD SELL-0.84941
SL-0.85586
TP1-0.84666
TP2-0.84431

CADCHF BUY -0.67950
SL-0.67479
TP1-0.68190
TP2-0.68383
#mt4 #forex #forextrader #trading #forextrading #bitcoin #trader
#cryptocurrency #forexlifestyle #entrepreneur
#crypto #forexsignal #investment #business
#binaryoption #passiveincome #daytrader #btc


RESULT

Yesterday AUDJPY SELL SIGNAL REACHES TARGET 2 AND WE GOT IT 58 PIPS PROFIT NOW 🙂

Yesterday EURUSD SELL SIGNAL REACHES TARGET 1 AND WE GOT IT 55 PIPS PROFIT NOW 🙂

Yesterday PREMIUM USDCAD BUY SIGNAL REACHES TARGET 1 AND WE GOT IT 165 PIPS PROFIT NOW 🙂

Yesterday PREMIUM GBPAUD BUY SIGNAL REACHES TARGET 2 AND WE GOT IT 115 PIPS PROFIT NOW 🙂

Yesterday PREMIUM AUDUSD SELL SIGNAL REACHES TARGET 2 AND WE GOT IT 67 PIPS PROFIT NOW 🙂

Yesterday PREMIUM EURAUD BUY SIGNAL REACHES TARGET 2 AND WE GOT IT 210 PIPS PROFIT NOW 🙂

Yesterday NZDUSD SELL SIGNAL REACHES TARGET 2 AND WE GOT IT 40 PIPS PROFIT NOW 🙂

Yesterday AUDUSD SELL SIGNAL REACHES TARGET 2 AND WE GOT IT 40 PIPS PROFIT NOW 🙂

Yesterday EURJPY SELL SIGNAL REACHES TARGET 2 AND WE GOT IT 50 PIPS PROFIT NOW 🙂

Yesterday NZDCHF SELL SIGNAL REACHES TARGET 2 AND WE GOT IT 35 PIPS PROFIT NOW 🙂

Yesterday NZDCAD SELL SIGNAL REACHES TARGET 2 AND WE GOT IT 44 PIPS PROFIT NOW 🙂

Yesterday CADCHF BUY SIGNAL REACHES TARGET 2 AND WE GOT IT 44 PIPS PROFIT NOW 🙂

How to Choose the Best Forex Platform

How to Choose the Best Forex Platform

How much do you know about the foreign exchange trading world? Do you know just enough to check the current exchange rate? Or do you know a lot more, and maybe you are a trader with years of experience in tow? If you are, then what do you think about the growing technology, are they have been helping your business? Or are you expecting more? Well, lucky for you, right now I’m going to share some essential points on how to choose a trading platform to enhance your performance.

As you know, there are a lot of brokers out there. Weeding brokers are easy, but how to get the right trading platform and make it looks like your own.

Understanding Your Tool

There are a lot of tips and comparison table on large brokers. The purpose is to help you weed out sketchy ones and can start trading in peace. You can always choose based on availability in your country, or based on your preferred currency. Anyhow, you should know that getting the right platform is almost as important as finding the right broker. To some people, the trading platform is nothing more than just a tool. But in reality, a different platform offered by different broker could make a huge difference in terms of profit making. You sure have compared several brokers before start trading. Any small difference could affect your decision, and the same goes with the platforms. You may need something that promotes versatility or none at all. It is more than about knowing what your platform can do for you. But also, how far can you go with that platform. A trading company often has several types of platforms based on the trader’s membership. Each platform caters different need as they have some specific functions that put one on top of another.

Why It’s Important

Having the correct platform in hand, won’t only help you doing the trades. But it also could help you on making important decisions. Some platforms are available in various OS, from Linux to Mac. It means that your personal OS preference is not an issue here. You can still be a geek by day and gain passive income from trading. There are more and more companies that trying to reach out by having their trading platform available for almost all OS. Some even went as far as authorized old-fashioned java app. Just so their traders could work at ease. Your personal preference could affect the company’s performance in the long run. Keeping up with the technology is just as important as facilitating their traders.

Keeping Your Network Alive

Nowadays, being a trader doesn’t necessarily require you to stay and cooped up in one place. You can always do your business while doing some other things. If you feel like you’re a mobile type of person, then you should look out for trading platforms that have mobile support. Obviously, your skill is the most important component. How much of a risk taker you are, as well as how witty and able to predict the trend would matter much. But your personal comfort is also important. There’s no point of forcing yourself to have a lot of gadgets in hand when you prefer to stay in a cubicle and do your work in silence. Networking is important, and while you can always have a direct meeting with clients or potential clients, you can always use the technology to help you. Again, it’s all about your personal preference on trading. Each trader has their own style, you’ll be fine when you have found yours.

Now that you know how much you want to be in the water. The rest will be a case of smooth sailing for you. However, you still need to remember some important things. Such as, you shouldn’t let anything get in the way of your personal preference. Most platforms are available for windows-based computer, and some other are even available for mobiles. Still, it doesn’t mean you need to give up your comfort to gain profit as much as you can. Profit will come by itself when you have done everything right. Don’t worry about the loss, it happens once in a while. Once you got the hang of it, you’ll do just fine.

A Simple Yet Profitable Strategy

trade management
A simple yet profitable strategy and a plan is the ultimate key to consistent long-term profitability because it allows traders to capitalize on their edge without emotions day in and day out. Today’s post is presenting you with a profitable and solid trading swing strategy on the 4-hour chart. So it is vital to follow along carefully and make sure that all the steps are understood.

Note: there is one important task we would like to ask you to complete in return for access to this profitable strategy. We want you to tweak and test it with your own ideas. That way we can perhaps build a better strategy with more profits or less volatility. Also, read How Currency Pairs Work in Forex.

If you are looking for a strategy which uses intraday tactics instead, make sure to read this article on the best trading strategies here.

Statistics of setup for this simple yet profitable strategy:

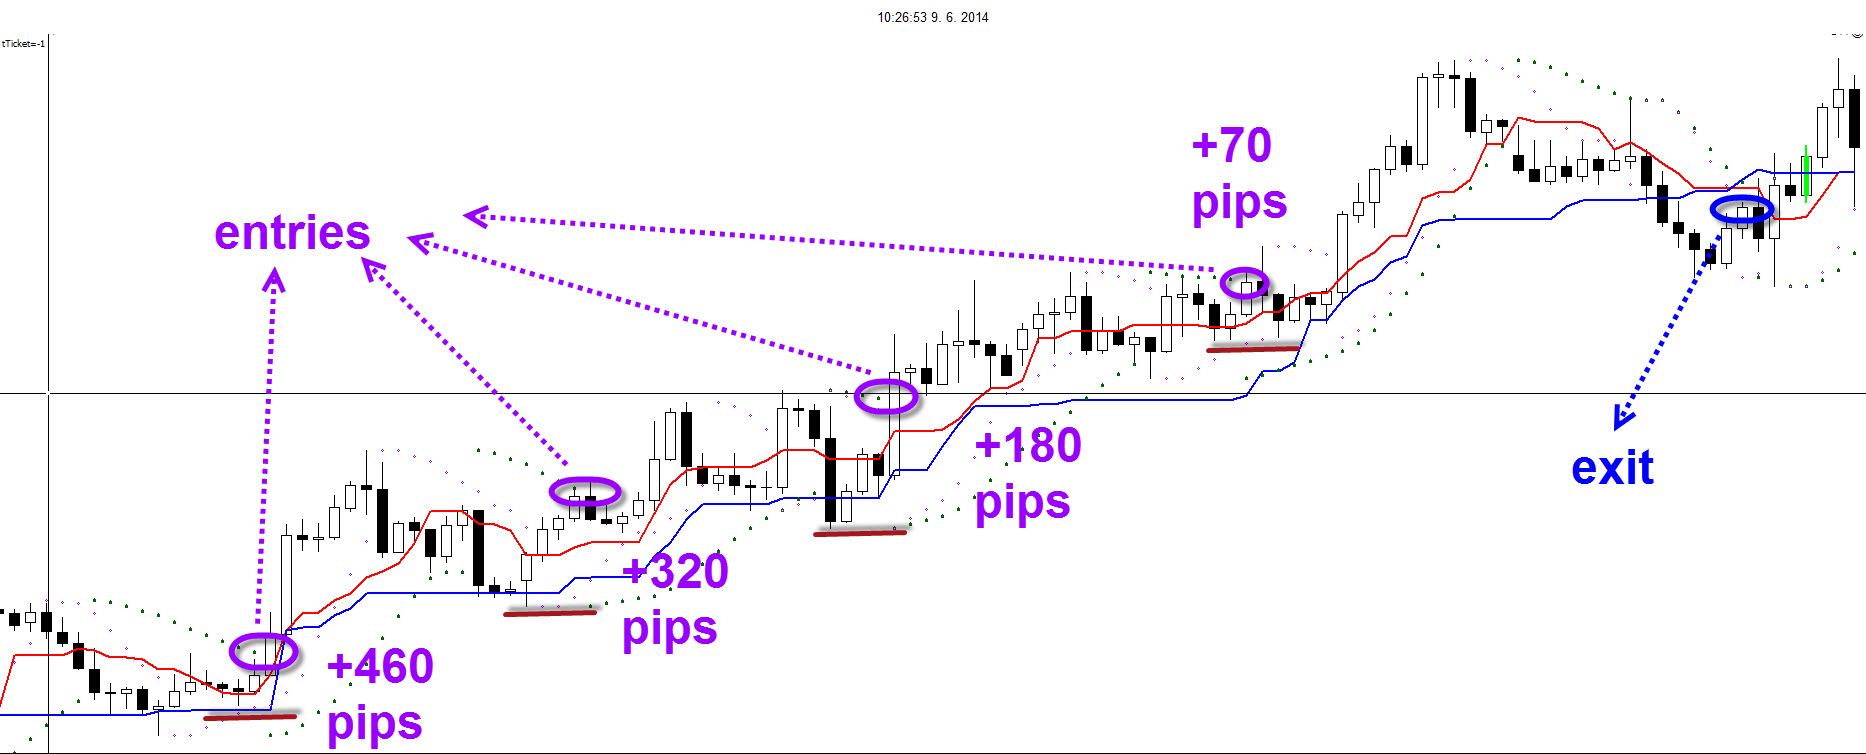
The first thing we want to share with you is the performance details of the strategy. We need to make sure that you are taking this setup seriously and are appreciating the value provided in this article. Therefore, let us review the stats of the EURAUD backtest in the entire 2013:

1) Trail stop Parabolic: +13.8 units of risk / +0.39 per trade.
2) Trail stop Tenkan: +43.9 units of risk / +1.25 per trade.
3) The average reward (half Parabolic and half via Tenkan) is +28.86 units of risk / +0.82 per trade.
4) That means if a trader is risking 1% per trade, the profit is +28.86%.
5) 35 trades taken.
simple yet profitable strategy
I am sure we have your attention now. We advise paying close attention because the stats get even better… The remaining stats are calculated on the basis of scenario 3:

a) 17 wins and 18 losses for roughly 50% – 50%.
b) The average win was +3.2 and the average loss was -0.58.
c) The profit factor therefore was 3.2 / 0.58 = 5.55 (!).
d) There were 10 trades out of the 17 that made 1 unit of reward or more.
e) There were only 4 trades out of 18 that closed for a full loss.

When each unit of loss was compensated by 5.5 units of reward and approximately 50% of the trades are won, then obviously the strategy is going to pull into profit.
The strategy is uniquely able to capture long runs and big wins.
Not only does the performance show stellar stability, but there are other advantages as well:

1) Simplicity – simple rules that are not demanding to implement.
2) The strategy can really ride long on momentum.

Enough has been said on the performance details of this strategy, so it is time to move on and explain the rules and ideas behind this concept.

STRATEGY 201

Here are the basic details connected to the strategy:

Our goal was to create a swing strategy that can be actively traded by all types of traders from beginners to very experienced ones.
As always, our only focus is on technical analysis. The discretionary element is limited to ensure that our rules are crystal clear for all traders.

The main strength of our strategy will be to capitalize on trending breakouts. Therefore, the strategy is focused on trading with the trend but it will only use one-time frame: the 4-hour chart.

Our tools and indicators are simple:
a) Parabolic settings 2 = green dots.
b) Parabolic settings 5 = purple dots.
c) Ichimoku indicator: Tenkan-sen / Tenkan= red line.
d) Ichimoku indicator: Kijun-sen / Kijun = blue line’.

swing strategy
As a roadmap and building block for constructing any strategy, we highly recommend reading Forex Chart Patterns and How to Find Opportunity in Forex.

TOFTEM MODEL

This model is a checklist of the 5 steps prior to and during the entry.
T = Trend
O = Opportunity
F = Filters
T = Trigger
EM = Entry Method

All of these steps will be reviewed here one by one for this swing strategy. The 4-hour chart is used for all of the 5 steps, besides the filter chart which uses the daily time frame.

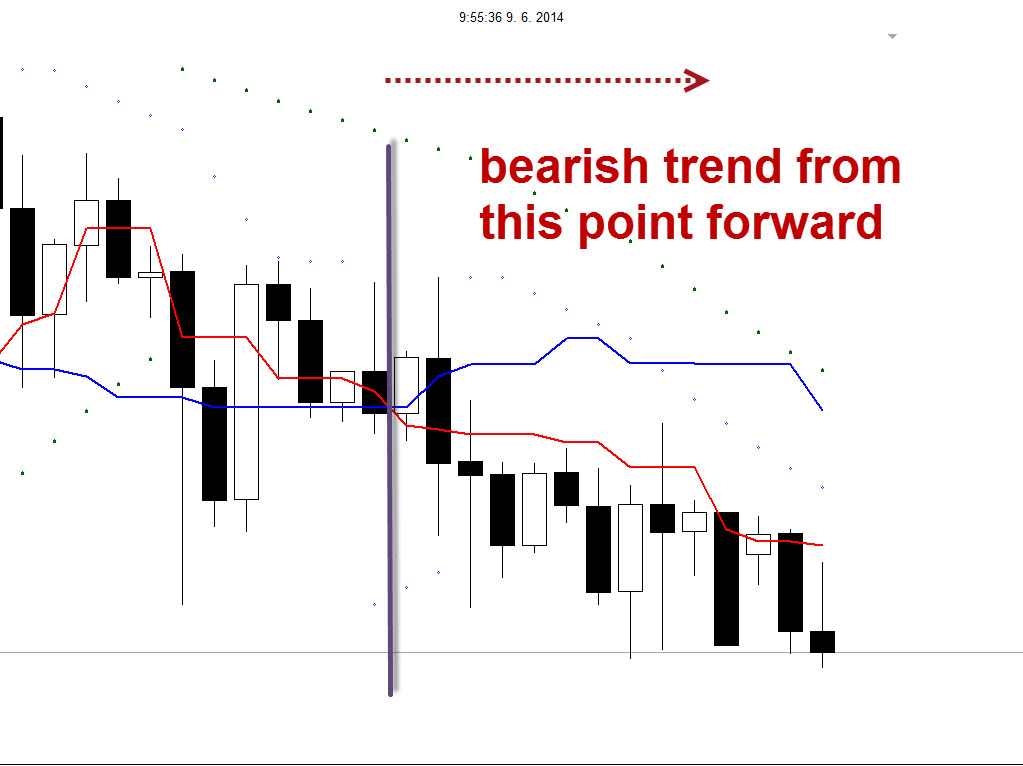
PART 1 DEFINING TREND

This strategy uses the Tenkan and the Kijun lines for trend definition purposes. The Tenkan and Kijun lines are part of the Ichimoku indicator, but the remaining 3 parts of the indicator were removed (please read more here about the Ichimoku indicator).
The strategy needs Tenkan and the Kijun to be aligned to one side:
a. When the Tenkan is above the Kijun – bullish bias.
b. When the Tenkan is below the Kijun – bearish bias.
c. When the Tenkan equals the Kijun -range.
This is a sweet, simple and effective way of measuring the trend. Trading must not be complicated or high level mathematical to be profitable.
swing strategy

PART 2 OPPORTUNITY

The opportunity is valid when the Tenkan has an angle:
a. An upward sloping angle means upward momentum.
b. A downward sloping angle means downward momentum.
c. A flat angle means no trend/range environment and no momentum.

The trend and opportunity have to be aligned to the same side before a trader can continue with the next step. This could be either:
A) Bullish trend and bullish opportunity.
B) OR bearish trend and bearish opportunity.

In the screenshot below is an example of when a currency has momentum to the upside, downside or no side (flat).

Again the opportunity is very intuitive and has an internal logic to it. Nothing fancy yet effective.
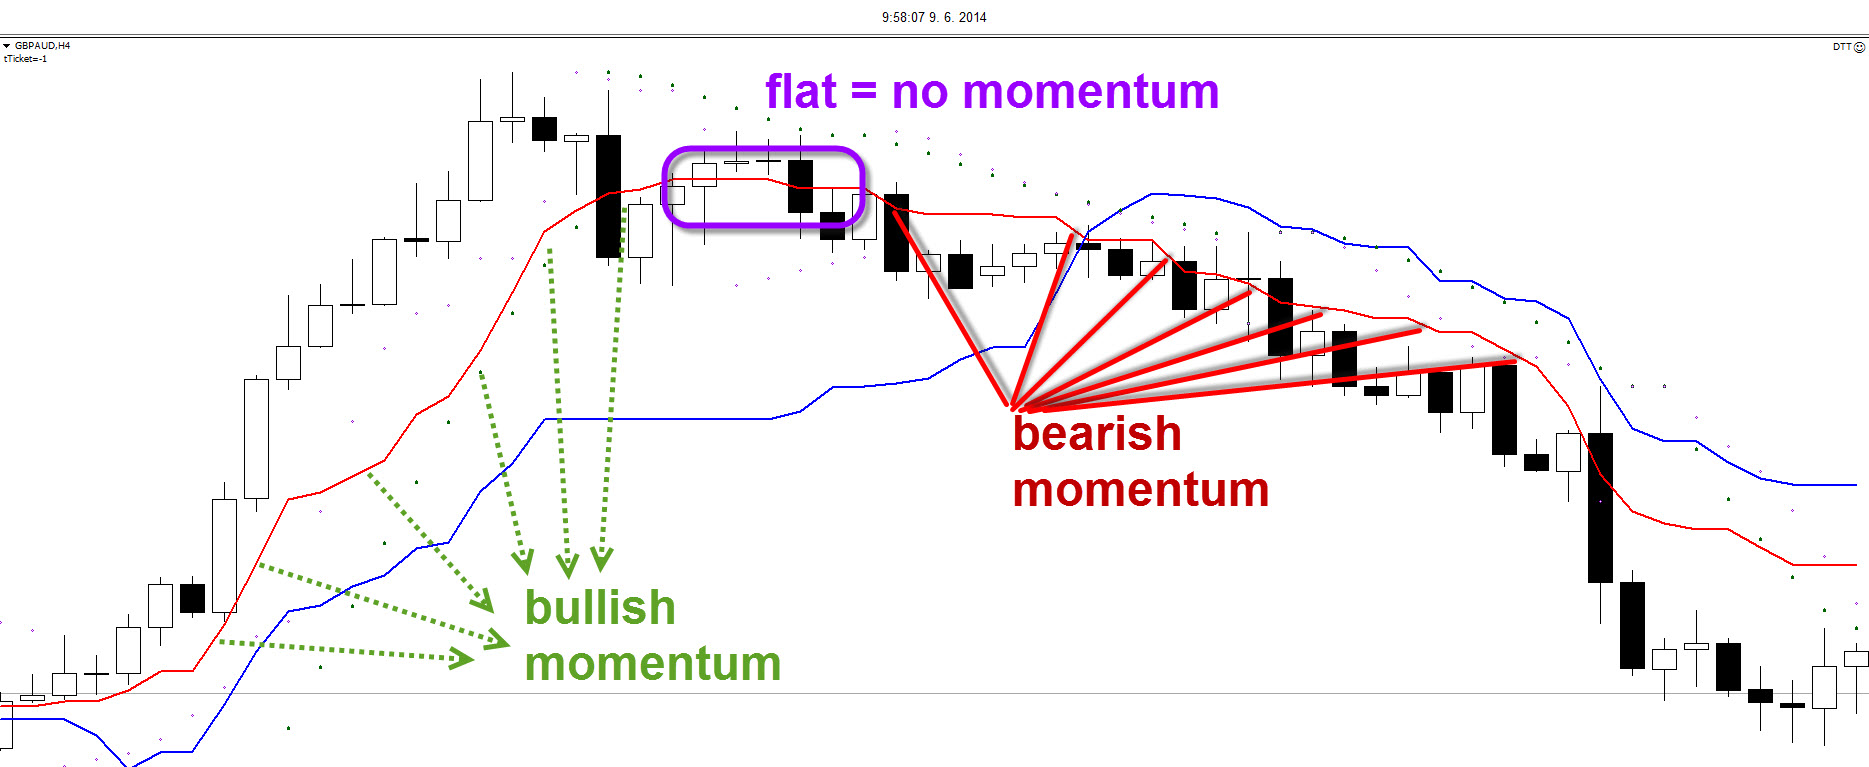
swing strategy 3

PART 3 FILTERS

The filter uses the daily chart to check if any trend and momentum face major obstacles such as daily tops and bottoms. If yes, and the price is too close (sufficient space towards S&R) then that pair and potential trade setup would be filtered out and ignored. When testing the strategy, no filters were used, which means that the statistics are showing the “gross” performance. The results can potentially be improved with filters.

The filter steps keep our focus on valid setups and make sure our mind is not overtrading. Filters are very important for making your trading more profitable.

PART 4 TRIGGER

The trigger is the moment that the trader is waiting for: the price has confirmed its expected development and a trader is one step away from entering. The trade is not just a potential trade setup but it close to becoming an actual trade. This strategy uses the following triggers:

1) For a bullish trend and bullish opportunity: price needs to break through one of the two Parabolic levels to the upside (parabolic is above price).
2) For a bearish trend and bearish opportunity: price needs to break through one of the two Parabolic levels to the downside (parabolic is below the price).
swing strategy 4
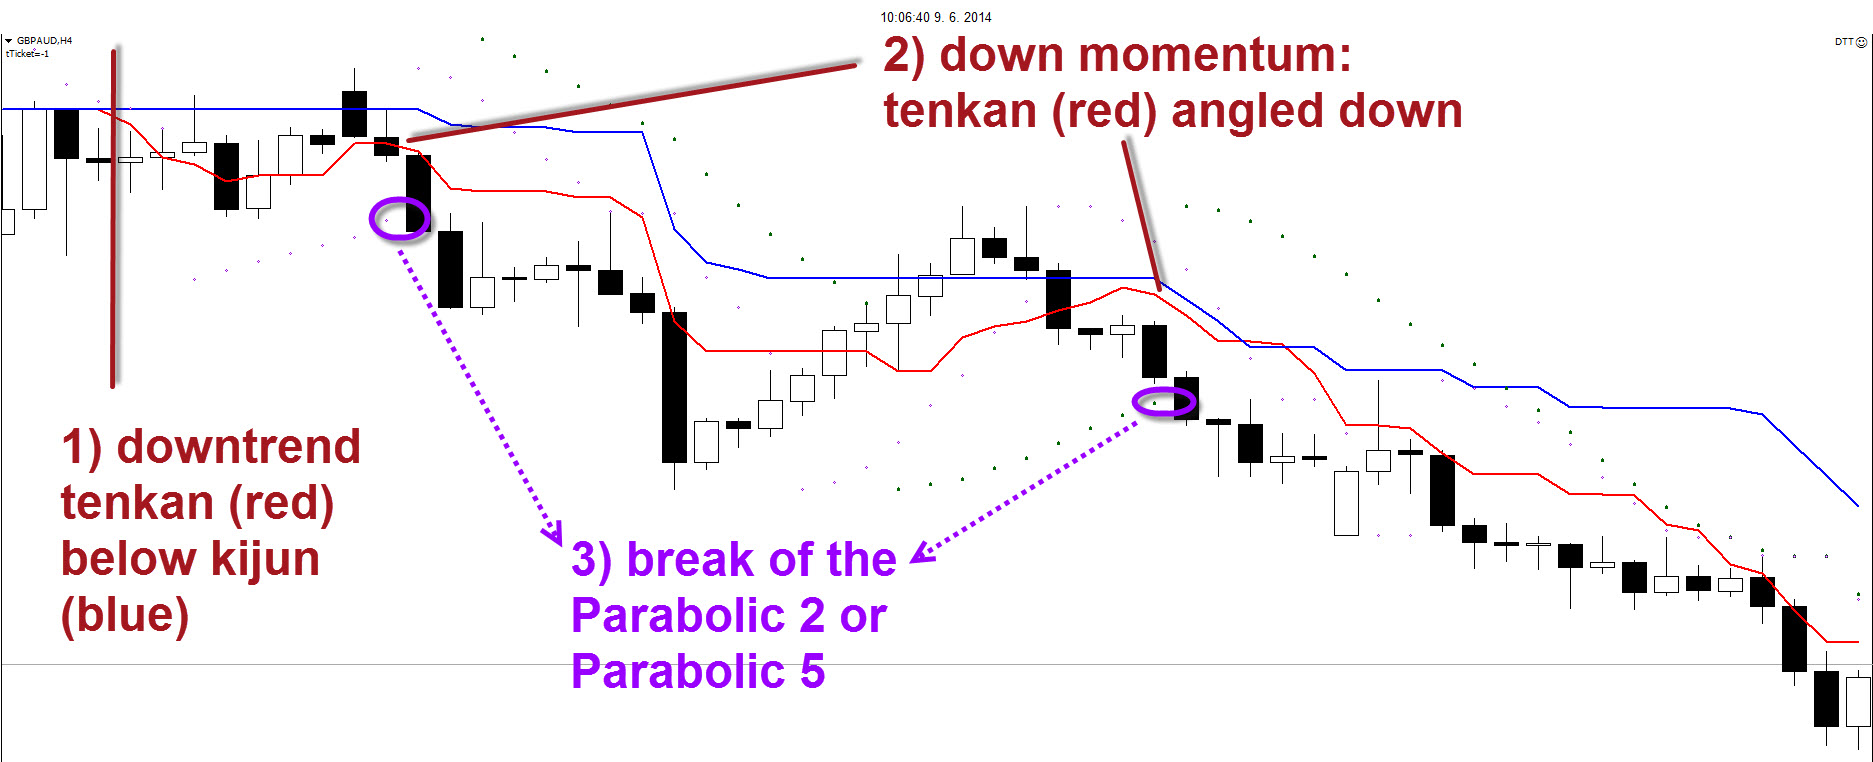
Green dots mean parabolic with a value 2, whereas purple dots mean parabolic with a value of 5.
The trigger means full alert for the trader as the moment of entry spirals closer…
Click to learn more about momentum trading.
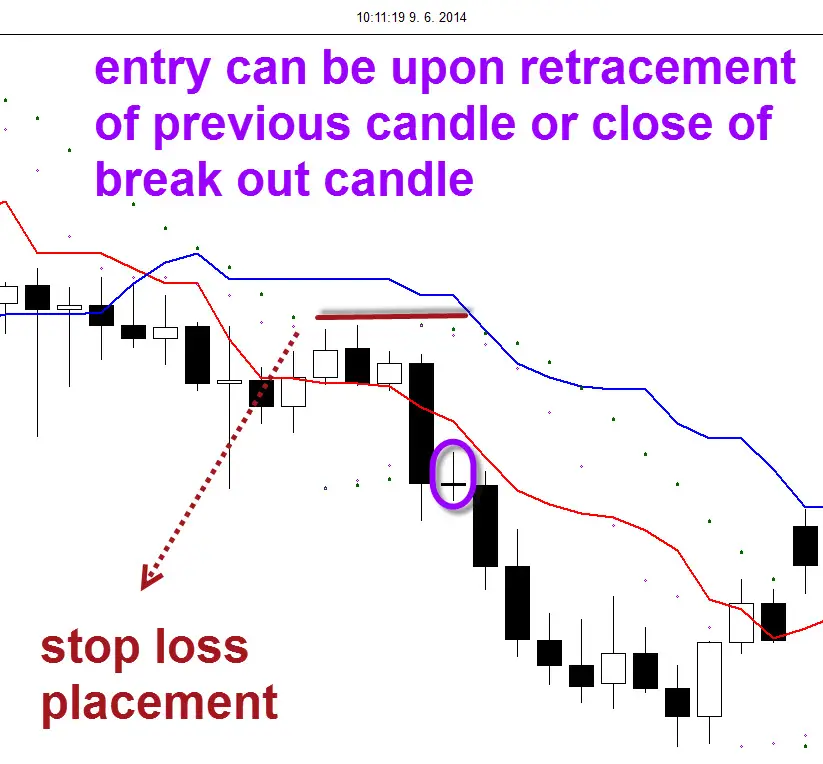
PART 5 ENTRY METHOD

The entry method is an immediate market order as soon as the candle closes. There is one important element that needs to be confirmed before an entry is taken: the close of the candle needs to be near (within 40%) the candle extreme (in the direction of the breakout), which means:

a) An upside breakout should be accompanied with a close near the high;
b) A downside breakout should be accompanied with a close near the low.

False breakouts often tend to have big-sized wicks upon a breakout. By waiting for the candle to close, the trader can avoid these potential false breakouts and stay in control of their trading plan.

The entry is the defining moment but it never hurts to be critical before opening the position.
swing strategy 5

TRADE MANAGEMENT

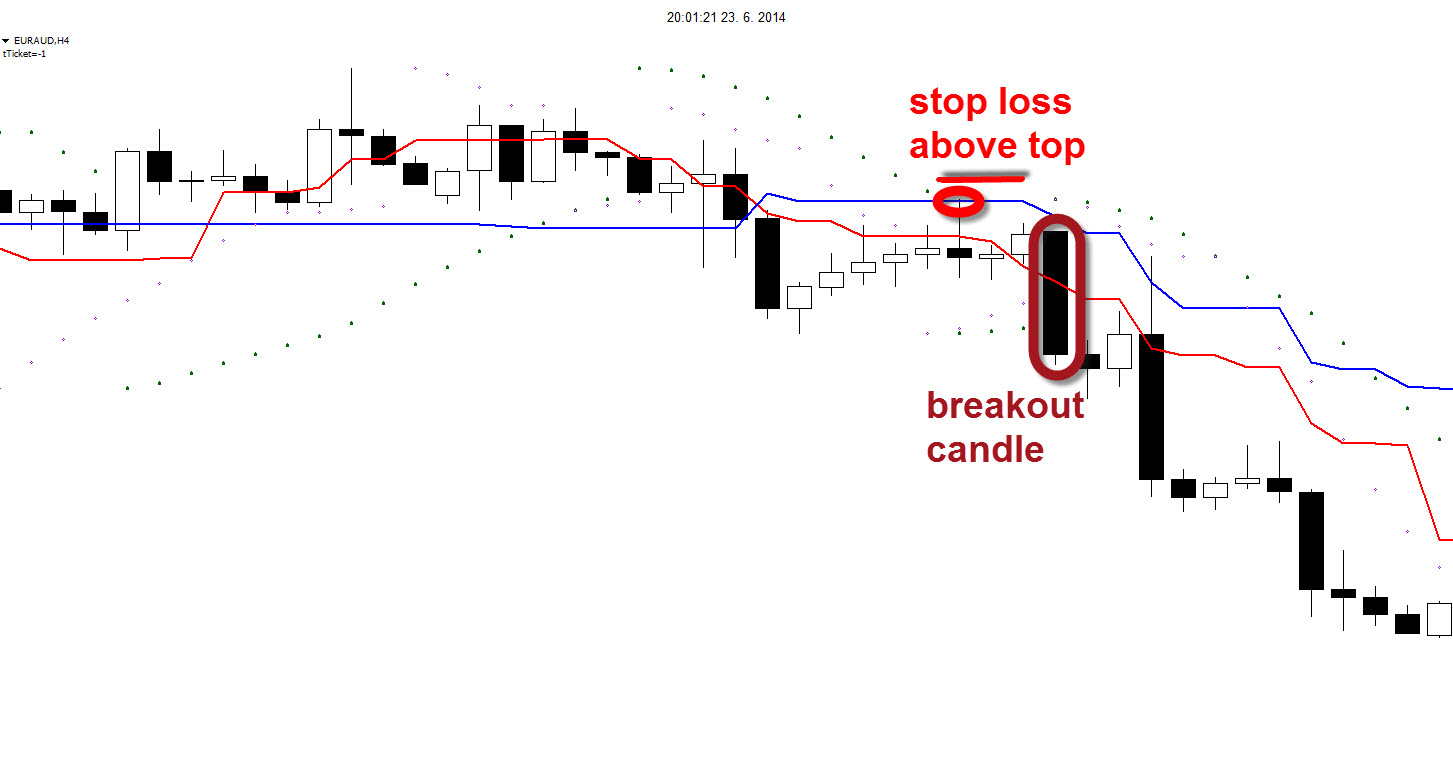
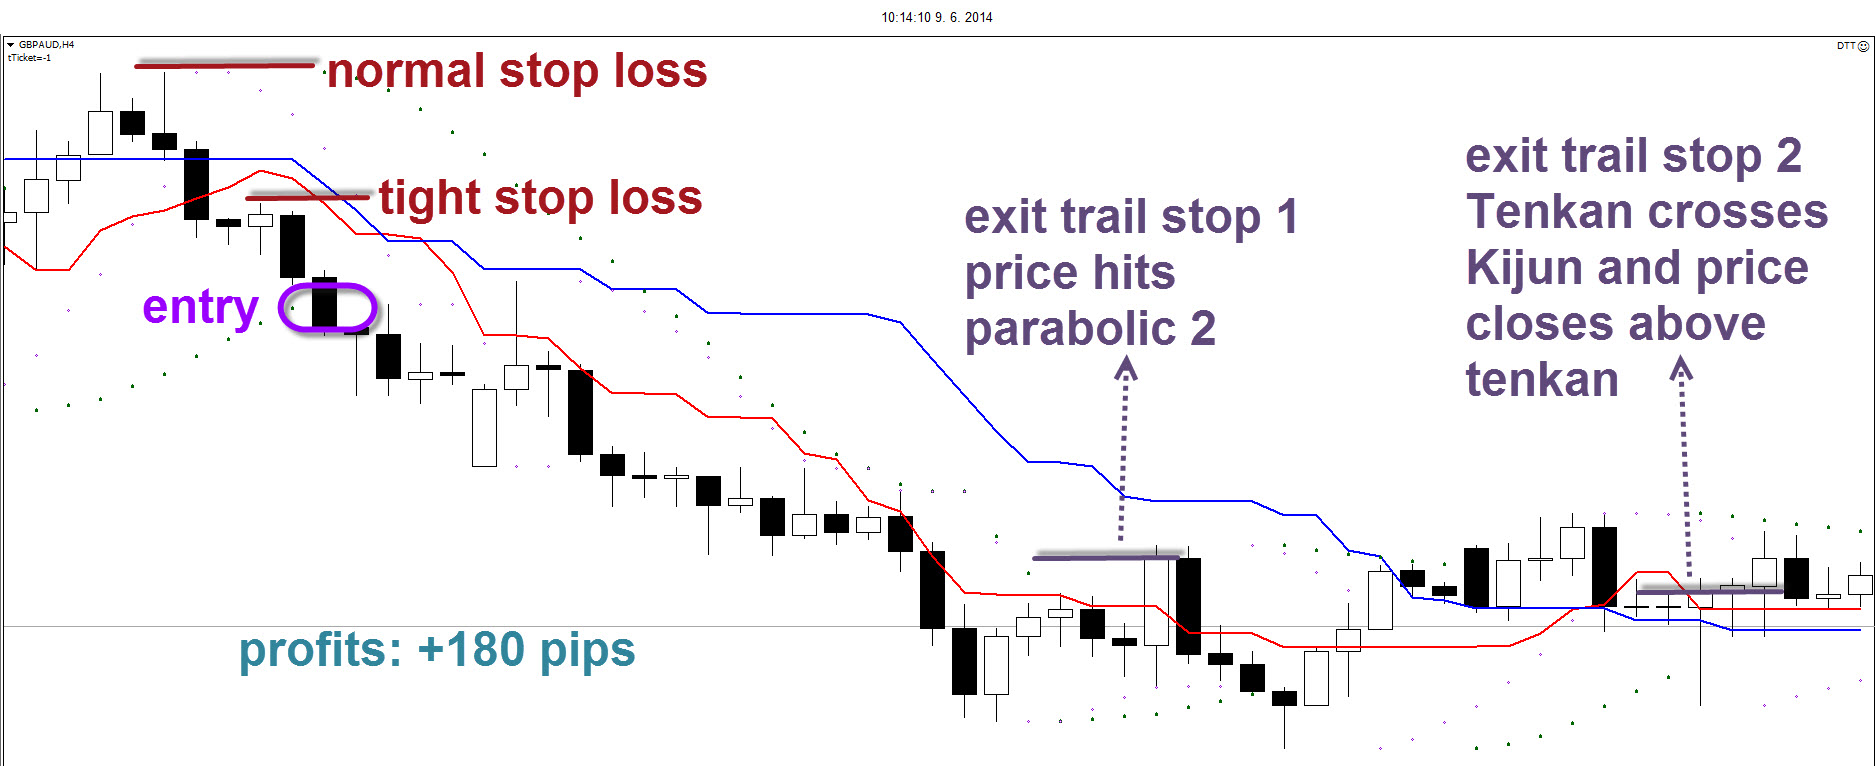
The stop loss uses the tops and bottoms from the 4-hour chart. The tops and bottoms are candles which are the highest or lowest candles within a group of a minimum of 5 candles.
SL
The take profit uses a trail stop loss. The main trail is an exit upon a crossover of the Tenkan and Kijun to the opposite side plus a candlestick close on the opposite side of the Tenkan line (for longs cross to the downside; for short cross to the upside). Another trail stop loss that could be used for discretionary purposes is the Parabolic value 2: as soon as the parabolic is placed on the opposite side of price then the trade is immediately closed. We also have training on Japanese Candlesticks and How to use them.
swing strategy 6
That concludes the rules and explanation of strategy 201. We hoped you enjoyed the ride!
But now… it’s YOUR turn!

We need your input on this strategy:
“What is the biggest edge of this strategy?”
“What is its weakest point?”
“What is its biggest improvement point”?
“Do you like the strategy?”

We hope you find that this simple yet profitable strategy can be a very profitable forex strategy. Let us know down below! Last but not least, make sure that the strategy rules match your own trading psychology to increase the chances that the rules are implemented effectively.

Thank you for taking the time to read our posts, and also for sharing this article with your acquaintances.

Please leave a comment below if you have any questions about this simple strategy!

Also, please give this strategy a 5 star if you enjoyed it!

1 Star2 Stars3 Stars4 Stars5 Stars (23 votes, average: 3.61 out of 5)
We wish you Happy Trading!
copy-of-930-x-180-top-banner-strike

Trading Strategy Guides

With over 50+ years of combined trading experience, Trading Strategy Guides offers trading guides and resources to educate traders in all walks of life and motivations. We specialize in teaching traders of all skill levels how to trade stocks, options, forex, cryptocurrencies, commodities, and more. We provide content for over 100,000+ active followers and over 2,500+ members. Our mission is to address the lack of good information for market traders and to simplify trading education by giving readers a detailed plan with step-by-step rules to follow.

The Most Popular Swing Trading Forex Strategy

The Most Popular Swing Trading Forex Strategy

When the strategy does not match your best interest, then it isn’t the perfect one for you. In that situation, you’re going to be tempted to trade the strategy within this marketplace. After the strategy was built you ought to optimize its variables. It’s the strategy of several scalping traders to trade a substantial number of currencies at the exact same time, holding them for a couple of minutes and selling them when a slight but favorable movement occurs. It is a good idea to follow an appropriate strategy regardless of any trading tip or angle. In such conditions, a trend-following strategy may be the better choice, since the trader can capture larger gains in the event the market moves in the appropriate direction. Creating a simple strategy which could make money is something anyone can do with a couple of weeks of study.

Don’t forget, you’re trading all 500 stocks” at the identical time. Many stocks find it impossible to trade off hours, and should they do, it is quite a light trading. There are plenty of unique approaches to trading stocks.

The very best swing trading way is easy and can be employed by anyone. Trading with the trend means you’re trading with the intelligent money. While there are numerous people interested in trading for the very first time, this doesn’t signify that it’s an activity for everybody. Online trading differs in lots of things from traditional trading practices and unique strategies are required for profiting from the industry. Scalping trading takes a huge understanding of the marketplace. Depending upon the right time of day, there’s heavy trading on the e-mini.

Learning how to trade Forex isn’t a simple undertaking, but by no signifies is it difficult either. Forex, for instance, is less prone to fakeouts because the marketplace is so huge that it’s nearly impossible for any person or institution to manipulate false breakouts. Learning how to trade Forex does not need a good intellect or a college degree. Forex is among those methods and with a lot of potentials. Forex For Profits teaches 4 distinct strategies that can be utilized in various trend conditions.

Fibonacci Trading is an immense and popular strategy amongst Forex traders and basic knowledge of this strategy is critical if you would like to succeed in the Forex market. If you’re involved in currency trading, you have probably already heard about forex scalping. An increasing number of people are becoming involved in internet currency trading.

When you wish to be prosperous in swing trading, then you might have to present your actions with no sentiments. Swing trading is a special kind of trading and investment. It is a type of stock marketing. It is a simple stock marketing process. Forex swing trading has turned into a favorite strategy with a fantastic selection of forex investors during recent times that have many banks, brokerages, company firms, and other smaller traders all implementing this approach to a high level.

Forex trading can be carried out with trusted brokers that are regulated by specific nations. It is all about discipline, once you choose your trading system stick with it. If you would like to succeed at forex trading then using forex charts and technical analysis is a remarkable method to do it. Forex trading can become your ticket to a severe income. While it may be an exciting proposition, it is not without reasonable risks. Scalping forex trading is among the more recent methods getting ever more popular among traders

How much can a trader gain?

How much can a trader gain?

Forex traders deal to make money. We’re often asked exactly how much you can make. Here is our considered answer.

Forex can be profitable

Many forex traders make good profits, but the results vary:

  • Some say that doubling your money in a short time is achievable
  • Some are satisfied with 5% to 10% returns
  • Others keep on losing money – these traders don’t stay in the market for long

The amount of money you make in the forex market depends on your skills, dedication and attention to detail. To be a successful trader, you need to do the following:

  • Learn everything you can about how the market works
  • Develop a strategy that gives consistent results
  • Pay attention to analyses from market experts
  • Carry out you own detailed analysis before making a trade
  • Know when to lock in your profits and to cut your losses
  • Be patient and dedicated
  • Don’t let your emotions overwhelm your common sense

An example

Consider the following situation:

  • A trader opens an Forex account and deposits $1,000
  • They work 22 days in a month
  • They make a daily return of 1.5% on their initial investment
  • This is 33% per month – or $333
  • Their annual profit is approximately $4,000 – a 400% return

This may not be representative of your own trading performance. You may make more or less, depending on your skills and the market conditions. Don’t forget that by increasing your capital and leverage, you can increase your profits (while increasing your risk at the same time).

Look for opportunities

Experienced traders often make consistent profits. However, there are some situations where most traders make money. When you’re starting out, look for these opportunities; talk to other traders and identify obvious market trends. Your first profit is likely to come from this type of deal.

Manage your risk

Earning potential and actual earnings are not the same thing. As a forex trader, your earnings potential is unlimited, but how much you make depends on your ability. One key skill is knowing how to manage your risk:

  • Spread your investments across multiple deals
  • Do extensive analysis before opening a position
  • Don’t make too many high-risk trades
  • Set stop losses
  • Listen to experts – but make your own decisions

On the last point, keep in mind that experts have good track records, but they aren’t always right. If they were, they would be so rich that they wouldn’t be giving recommendations. Pay attention to experts, but verify what they are saying before you make a trading decision.

Develop your own strategy

Traders often share their strategies, and you can learn from these if they are successful. However, their strategies may not work for you. When you’re trading, there are a number of psychological factors that come into play, and these can affect your trading performance. It’s important that you develop a strategy that makes you feel comfortable, otherwise you’re likely to make mistakes.

Keep in mind the benefits

When you start out, it can take a while before you start making a profit. Don’t get discouraged and quit! If you do, you’ll lose the benefit of everything you have learned. Keep in mind the advantages of being a forex trader:

  • You can make your own decisions
  • You aren’t tied to an office
  • You choose when you want to work
  • Your earnings potential is unlimited
  • Forex trading is interesting and fulfilling