BRENT
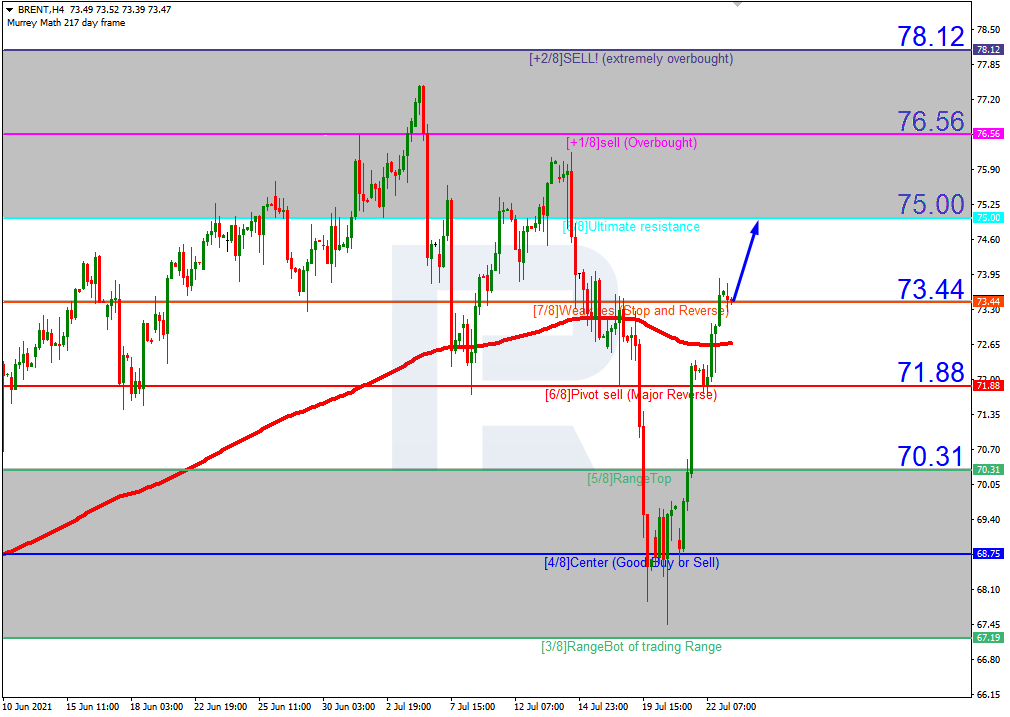
In the H4 chart, after breaking the 200-day Moving Average, Brent is trading above it, thus indicating an ascending tendency. In this case, the price is expected to continue growing towards the resistance at 8/8. However, this scenario may no longer be valid if the asset breaks 6/8 to the downside. After that, the instrument may move downwards and reach the support at 5/8.

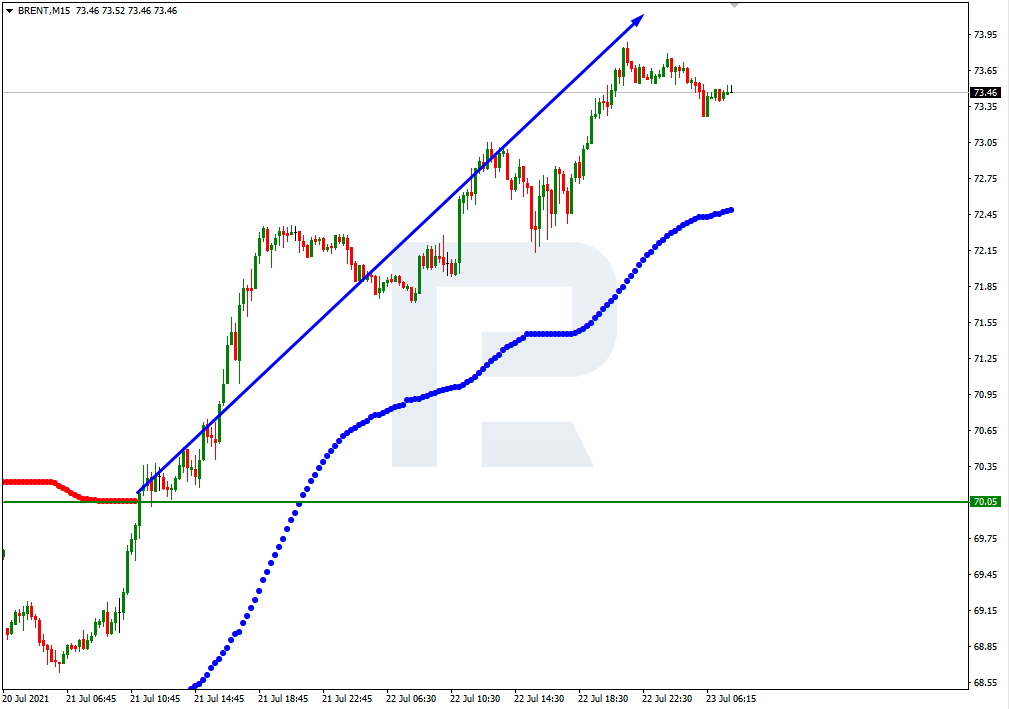
As we can see in the M15 chart, the pair has broken the upside line of the VoltyChannel indicator and, as a result, may continue its growth.
S&P 500
In the H4 chart, the S&P Index is trading above the 200-day Moving Average, thus indicating an ascending tendency. In this case, the price is expected to continue growing towards the resistance at +1/8. However, this scenario may no longer be valid if the asset breaks 8/8 to the downside. After that, the instrument may fall to reach the support at 7/8.
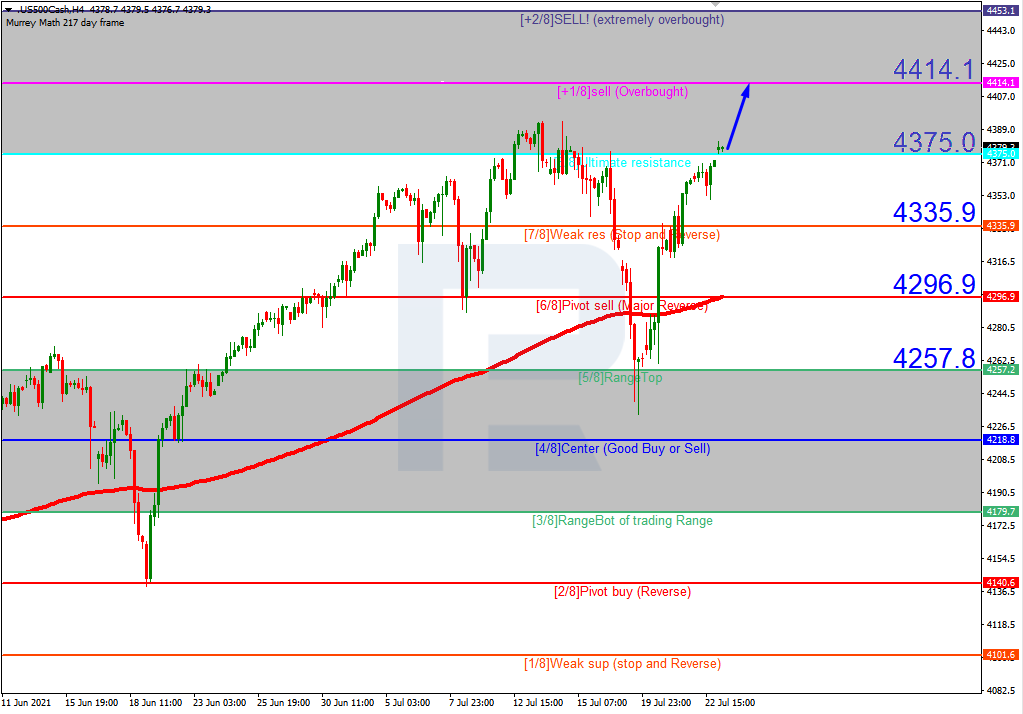
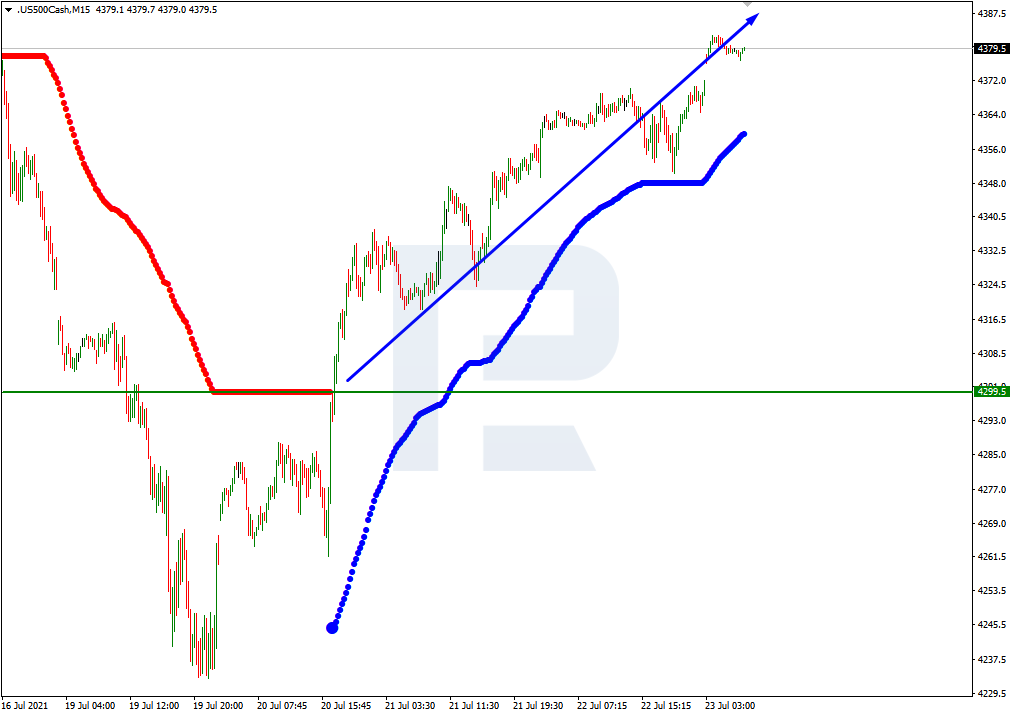
As we can see in the M15 chart, the pair has broken the upside line of the VoltyChannel indicator and, as a result, may continue trading upwards.