31.10.2019
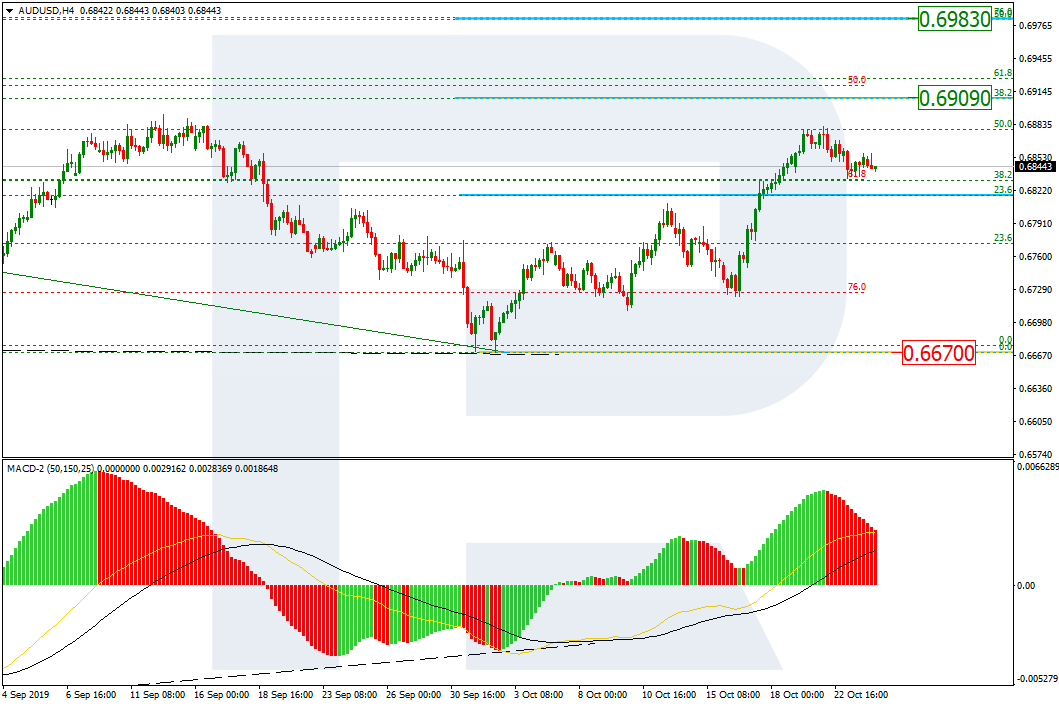
AUDUSD, “Australian Dollar vs US Dollar”
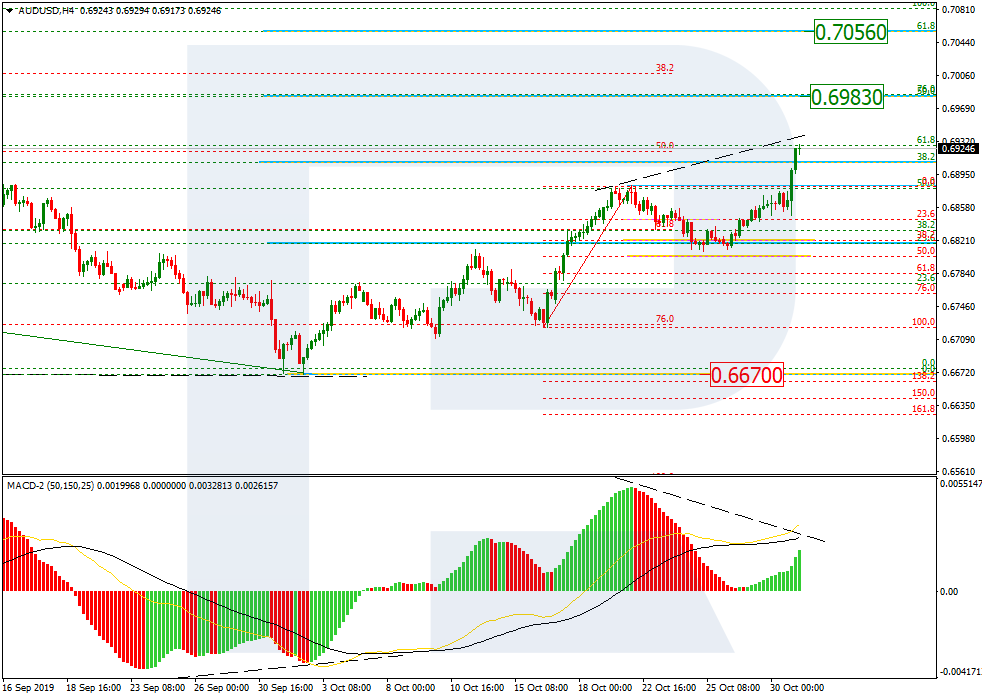
As we can see in the H4 chart, after completing a short-term pullback, the pair continues its ascending tendency and has already broken 38.2% fibo. The next targets may be 50.0% and 61.8% fibo at 0.6983 and 0.7956 respectively. At the same time, one should pay attention to the divergence on MACD, which may indicate a reverse after the instrument reaches the closest targets.

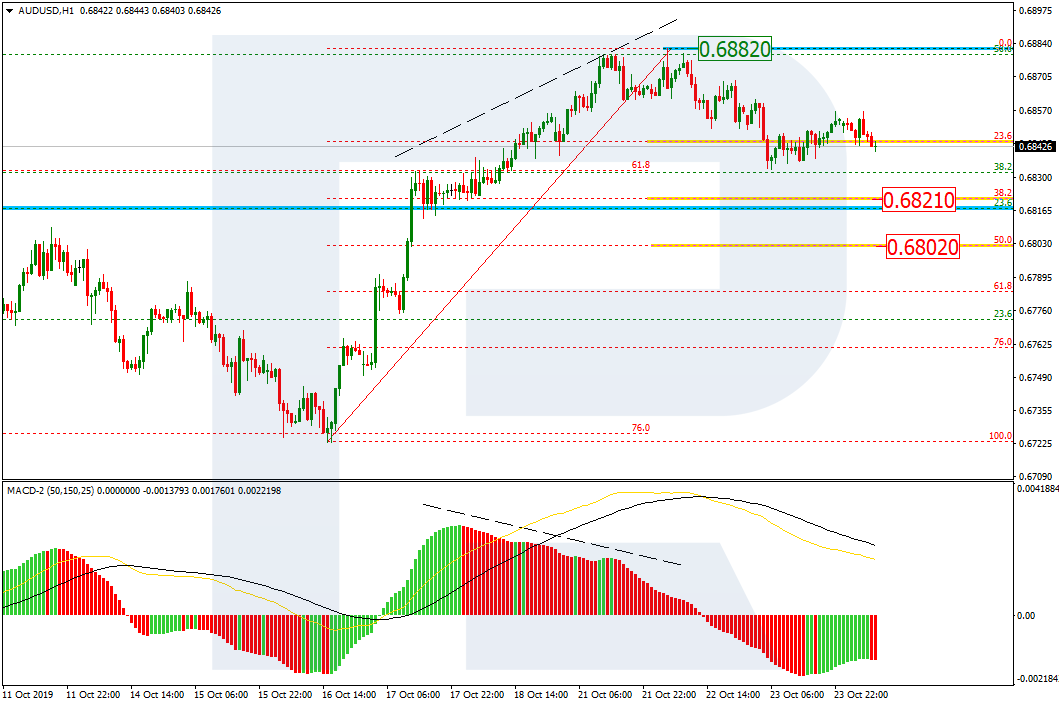
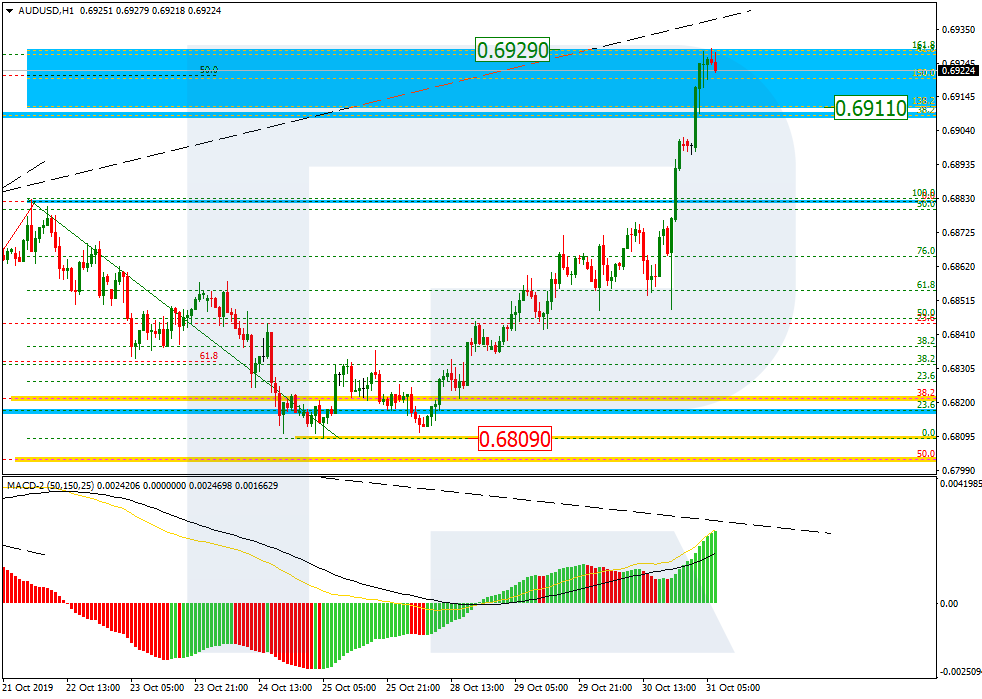
In the H1 chart, after finishing a quick rising impulse, AUDUSD has entered the post-correctional extension area between 138.2% and 161.8% fibo at 0.6911 and 0.6929 respectively. in the short-term, the price4 may start a new pullback, which may later be followed by further growth towards mid-term targets. The support is at 0.6809.
USDCAD, “US Dollar vs Canadian Dollar”
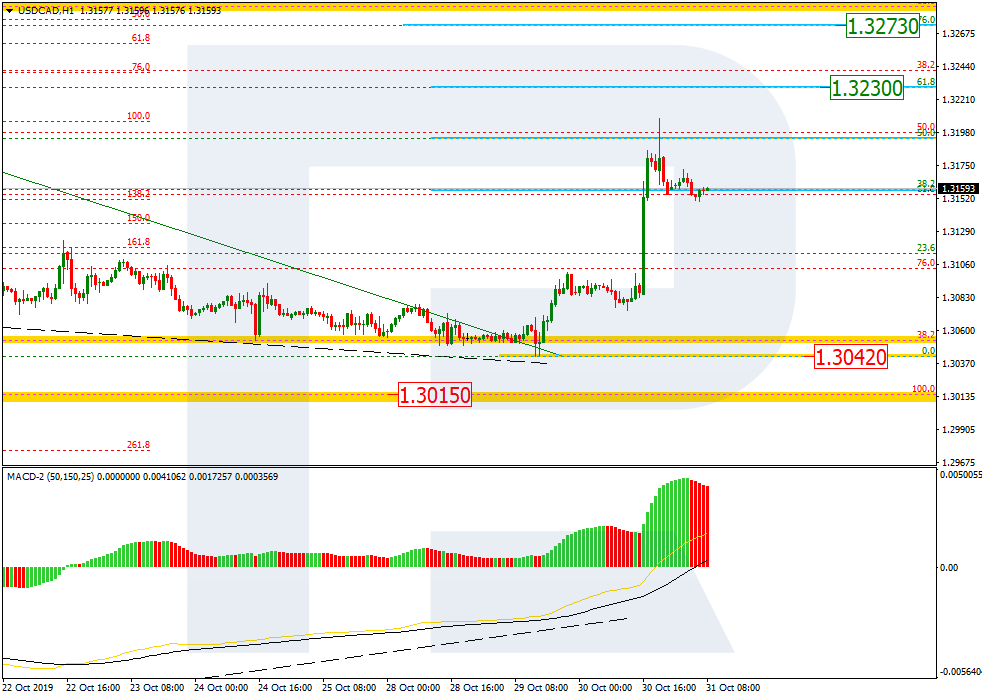
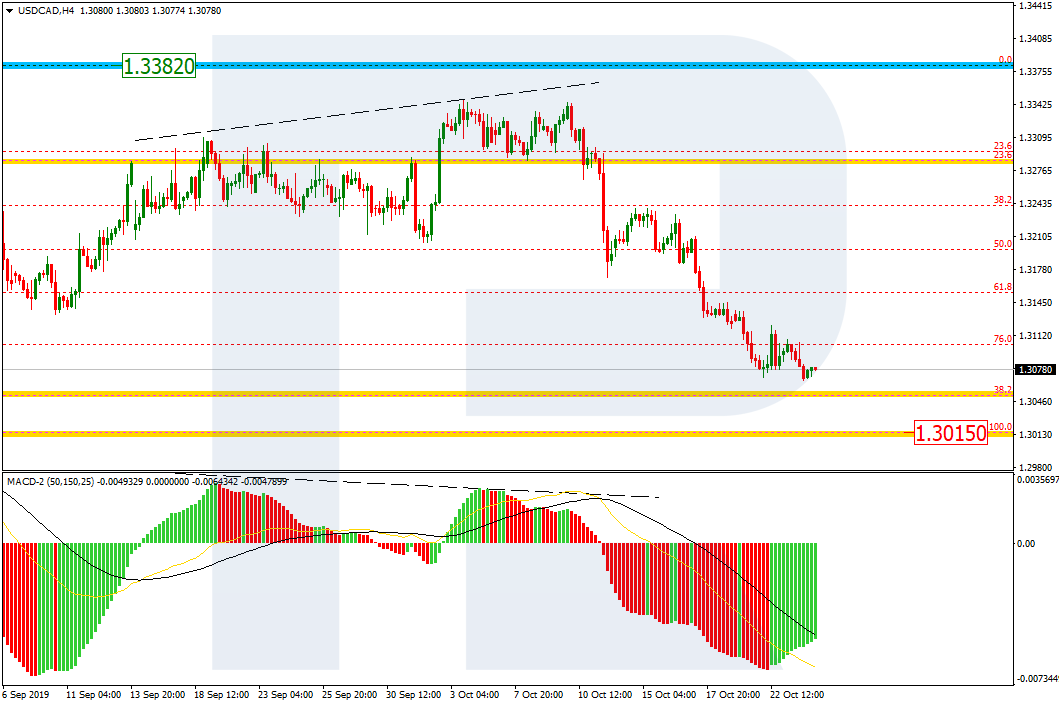
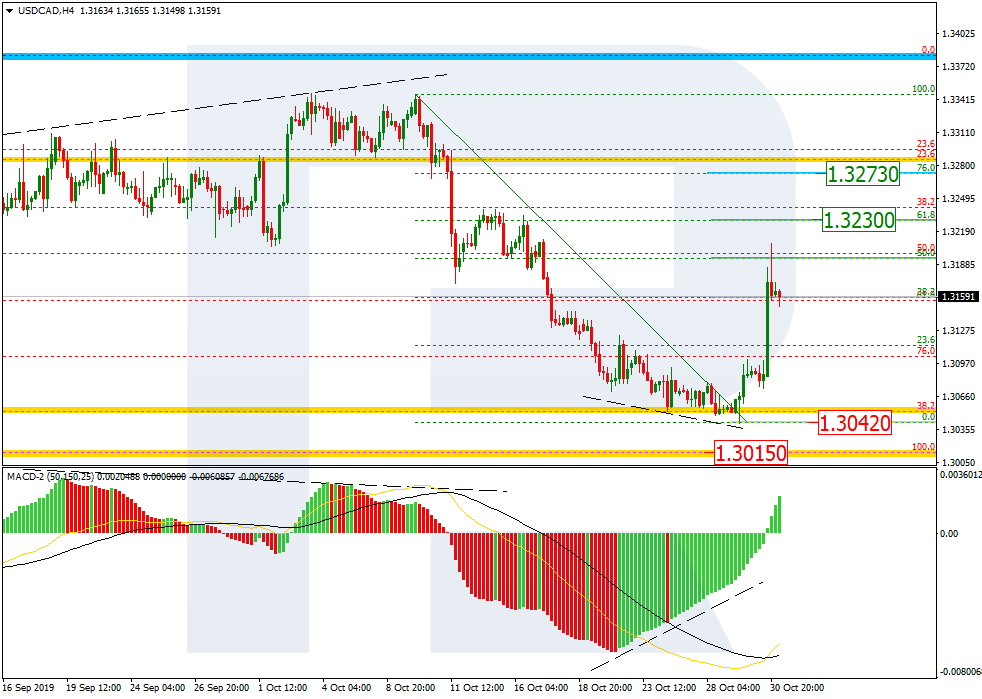
As we can see in the H4 chart, USDCAD has corrected the previous descending wave with a quick ascending impulse. After reaching 50.0% fibo, the pair is forming a pullback. Possibly, the next rising impulse may reach 61.8% and 76.0% fibo at 1.3230 and 1.3273 respectively. If the price breaks the support at 1.3042, the instrument may continue the bearish trend towards the long-term low at 1.3015.
In the H1 chart, the pair is forming a pullback towards 38.2% fibo after finishing a quick ascending movement.