Elementor #6002

Daily Free Forex Signals For 20-10-2021

Daily Free Forex Signals For 12-05-2023

EURUSD BUY -1.09302 SL-1.08597 TP1-1.09707 TP2-1.10106 AUDUSD BUY-0.67008 SL-0.66659 TP1-0.67680 TP2-0.68115 GBPUSD BUY -1.25256 SL-1.24268 TP1-1.25791 TP2-1.26357 USDCAD SELL-1.34852 SL-1.35599 TP1-1.34431 TP2-1.33908

rfxsignals January 30, 2021 No Comments

Forex Kijun Fluction Indicator

Forex Kijun Fluction Indicator


About The System 

Forex Kijun Fluction Indicator is a manual trading strategy that you can use to generate profits from forex market every day. You don’t have to be an experienced trader to be able to use it. In fact, even if you have no trading experience at all you would still make a lot of money from it just like pro traders.
There are many people that sign up to trade Forex that don’t understand or take the time to learn how and why to trade Forex.
There are many risks involved in trading any kind of asset, whether it is stocks, bonds or currencies. If you are interested in trading, make sure you understand Forex risks. One of the biggest Forex risks is a leveraged buy. Some Forex brokerages allow you to hold a certain amount of money in your account but leverage that amount to up to 100 times its worth.
While this can be good if you are on the winning side of a trade, this can be devastating if you lose your entire accounts worth plus many times more. So please, before you start trading .. make sure that you understand and apply money management rules. No matter how powerful the trading system is, without money management .. it will become a time bomb! We recommend not to risk more than 2% of your initial capital per trade.


System Rules
Go Long:
The long signal occurs when Forex Kijun Fluction Indicator lineturns into green color.

Go Short:
The long signal occurs when Forex Kijun Fluction Indicator line
turns into red color.

Exit rules:
Exit trade when Forex Kijun Fluction Indicator turns against your trade direction!


Free Download

rfxsignals May 8, 2020 No Comments

Daily Free Forex Signals For 08/05/2020

Daily Free Forex Signals For 08/05/2020

Here your going to see Daily Free Forex Signals For 08/05/2020 to free forex signal alert from our kitkat trading system and other trading logic’s .we provide like this free forex signals from 2012 on wards with more than 50,000 traders around the world .The free forex signals have 70 to 85% quality always .we give for you a note as maximum focus take profit 1 as your target and must use stop loss values .if you have any other query’s please visit our live chat or email option

EURGBP SELL-0.87379
SL-0.87770
TP1-0.87198
TP2-0.87024

AUDJPY SELL – 69.241
SL-69.621
TP1-69.005
TP2-68.809

EURCHF SELL-1.05255
SL-1.05677
TP1-1.05081
TP2-1.04897

NZDCHF SELL-0.59400
SL-0.59733
TP1-0.59197
TP2-0.58993

AUDNZD SELL-1.06377
SL-1.06726
TP1-1.06191
TP2-1.06019

USDJPY BUY -106.396
SL-105.868
TP1-106.659
TP2-106.895

USDCAD SELL-1.39351
SL-1.40239
TP1-1.38988
TP2-1.38546

NZDUSD BUY-0.61302
SL-0.60548
TP1-0.61516
TP2-0.61769

AUDCHF SELL-0.63297
SL-0.63669
TP1-0.63083
TP2-0.62936

USDCHF SELL-0.97071
SL-0.97572
TP1-0.96858
TP2-0.96657

rfxsignals April 3, 2020 No Comments

4 Hour Chart Trend Following Strategy

With this strategy, the main goal is to exploit the popular saying in the trading world “the trend is your friend”. This swing trading strategy uses a combination of moving averages, support and resistance, volatility and a few other tools to maximize profits from the trends in the Forex market. At the same, the strategy aims to keep stop losses and drawdowns to a minimum.

Although this strategy can work well on all timeframes, it is best to be used on the 4h timeframe, which makes it highly suitable for swing traders.

Forex Trend Following

In this strategy, the 4h chart is used as the base chart (this is where we screen for potential places on the chart where trading signals may occur) and the 1h timeframe as the signal chart, or the trade chart (where we execute orders according to this strategy).

If you choose to use a different timeframe as the base chart remember that you go one timeframe lower for the signal chart (so if 1h is the base chart then the 30m timeframe is the signal chart).

The main cornerstones of this strategy are as follows:

We need to have a trend. This strategy rests on trend behavior and without one it basically can not be used.

To determine if there is a trend or not we are going to use a set of two moving averages, out of which one is a 34 period and the other a 55 period MA. You may notice that these numbers are part of the Fibonacci sequence.

We can judge if a trend is worth trading or not by observing how the moving averages relate to price action.

Note: For this strategy feel free to experiment with different types of moving averages (like simple, exponential and weighted).

For an uptrend, the trend should meet the following conditions:

  • Price action is above the two moving averages
  • Price stays above the moving averages
  • The 34 MA is above the 55 MA and stays above the 55 MA
  • The MAs are sloping upwards for most of the time as they follow the trend

​For a downtrend, the same applies just in the opposite direction:

  • ​Price action is below the two moving averages
  • Price stays below the moving averages
  • The 34 MA is below the 55 MA and stays below the 55 MA
  • The MAs are sloping downwards for most of the time as they trail behind the trend
​An example of a downtrend with the moving averages is shown on the following chart.

4 Hour Chart Trend Following Strategy

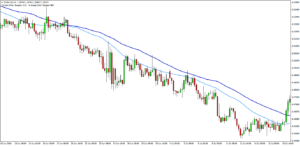
EURAUD 4h – A strong downtrend in 2016 provided several great opportunities for this strategy.

As can be seen from this EURAUD chart, the price tends to bounce off the two moving averages. Basically, the moving averages are a support zone during uptrends and a resistance zone in downtrends.

It is around and inside of this moving average zone that the best trading opportunities for this trend trading strategy are to be found.

We are trying to profit on the swings in the direction of the trend. So, for this reason, we want to join the trend on the retracements.

​Entry rules:

  1. There needs to be a trend on the 4h with the moving averages lined up as described earlier.
  2. We need to wait for a retracement to start and for the price to move towards the two moving averages.
  3. Once the retracement reaches the area around and between the moving averages we switch to the 1h timeframe to look for entries.
  4. There needs to be a retracement trendline (counter the direction of the trend) that has been touched at least 3 times (as shown in the example below). This will usually be a continuation chart pattern at the same time (on the 4h chart) like a triangle or a channel.
  5. On the 1h chart, wait for a breakout with a close of the retracement trendline in the direction of the larger trend (on the 4h timeframe).
  6. Enter on the breakout once price closes past the trendline (on 1h chart).

​An example of how an entry with this strategy would look like is shown below.

Forex Trend System

4 Hour Chart Trend Following Strategy

AUDUSD 1h chart – Example of an entry with using this trend trading strategy.

For this particular case, we would place the stop at 30% of the daily average true range below the entry point. On that day, the ATR was 72 pips for the AUDUSD pair, so 30% of 72 is 21.6 which means we would place the initial stop for this trade at 22 pips + the spread.

Stop loss rules are explained below.

​Initial stop loss placement:

  1. Place the ATR (average true range) indicator on the D1 chart.
  2. Set the stop loss to 30% of the daily ATR behind your entry level (which is the break of the trendline).
  3. Add the spread to the stop loss (for some more exotic currency pairs the spread can often be 15 or more pips which can make a big difference on the 1-hour timeframe in terms of when your stop loss will be triggered).

​For example:

Take the EURUSD pair which has about 100 pips usual daily range. If you entered a trade with this strategy on EURUSD, then your stop loss would be 30% of 100 which equals 30 pips plus the spread, which is usually around 1 – 2 pips for EURUSD. So, in total the stop loss, in this case, would be 32 pips.

​Risk management:

After you’ve entered the trade you need to manage that stop loss and trail it in order to be able to capture the maximum profit from the trend. Here is how this strategy works:

  • Once the price has moved 30% of the daily ATR in profit, move the stop loss to break even.
  • If at any point in time during the trade a counter-trend retracement trendline starts to form on the 1-hour chart then exit the trade.A counter-trend retracement trendline would be a trendline that is touched 3 times. Once this happens there is a higher probability that a new retracement or even a reversal has started. Hence it’s better to exit the trade and wait for a new opportunity.

​Take profit rules:

Because this is a trend trading strategy we will use a trailing stop for exiting the trade. This allows us to profit on a bigger part of the move.

There are some specific rules for this trailing stop order:

In an uptrend:

  1. ​As the price makes new higher highs, find the most recent highest high.
  2. Take the candle of that highest high.
  3. Find the low of this candle.
  4. Count backwards for 5 previous lows from the low of that candle.Note: Only lower lows count. Lows that are the same as or higher than the previous lows are to be omitted.
  5. Place the stop a few pips lower than the low of the fifth candle.

In a downtrend:

  1. As the price makes new lower lows, find the most recent lowest low.
  2. Take the candle of that lowest low.
  3. Find the high of this candle.
  4. Count backwards for 5 previous highs from the high of that candle.Note: Only higher highs count. Highs that are the same as or lower than the previous highs are to be omitted.
  5. Place the stop a few pips higher than the high of the fifth candle.

Here’s how this trailing stop looks on a chart.

The blue arrows are the starting point of the count and the line is the stop loss placement for that point in time. The numbers are an example of how to count the candles to determine the stop. You can see here how lower highs are left out until the next higher high backwards is found.

As the downtrend progresses with each new lower low, the counting for the trailing stop should re-done again and the stop moved lower.

Forex Trailing Stop Loss

4 Hour Chart Trend Following Strategy

EURUSD 1h chart. Notice how the manual trailing stop allowed the trader to capture almost the entire move on this chart. Trades are exited only when the price moves above the blue line which happened once on this chart in the first case on the left side.

Conclusion

​Finally, go on and practice this strategy on a demo account first so you can fully grasp everything before going live. If you find it helpful some backtesting on past price data is a good way to learn and master this trend following strategy as well.

DAILY FREE FOREX SIGNALS – 27-03-2020

EURAUD SELL 1.81068
SL:1.86055
TP1:1.80779
TP2:1.80470

CADJPY SEEL: 77.145
SL: 78.063
TP1: 76.875
TP2: 76.622

AUDCAD BUY: 0.85814
SL: 0.84394
TP1: 0.86083
TP2: 0.86353

AUDJPY BUY: 66.300
SL: 65.581
TP1: 66.511
TP2: 66.729

USDJPY SELL 108.256
SL:112.505
TP1:108.070
TP2:107.931

GBPNZD BUY: 2.05534
SL: 2.03073
TP1: 2.05811
TP2: 2.06101

EURCHF SELL: 1.06150
SL: 1.06413
TP1: 1.05940
TP2: 1.05731

EURCAD SELL 1.54905
SL:1.56198
TP1:1.54735
TP2:1.54539

EURAUD SELL: 1.80217
SL: 1.84396
TP1: 1.79959
TP2: 1.79659

EURCAD SELL: 1.54825
SL: 1.55703
TP1: 1.54623
TP2: 1.54438

EURJPY SELL: 119.891
SL: 121.216
TP1: 119.644
TP2: 119.403

NZDJPY SELL: 64.644
SL: 65.435
TP1: 64.419
TP2: 64.203

rfxsignals March 11, 2020 No Comments

DAILY FREE FOREX SIGNALS – 11-03-2020 | Форекс – Сообщество Трейдеров |إشارات الفوركس|외환 신호

DAILY FREE FOREX SIGNALS – 06-03-2020 | Форекс – Сообщество Трейдеров |إشارات الفوركس|외환 신호


USDJPY SELL – 104.086
SL-105.212
TP1-103.751
TP2-103.404

EURUSD BUY – 1.13551
SL-1.12828
TP1-1.13902
TP2-1.14282

CADJPY SELL-75.938
SL-76.598
TP1-75.656
TP2-75.408

EURCAD BUY – 1.55793
SL-1.54941
TP1-1.56105
TP2-1.56471

NZDUSD BUY -0.62963
SL-0.62554
TP1-0.63120
TP2-0.63292

CHFJPY SELL-111.621
SL-112.352
TP1-111.348
TP2-111.069

NZDJPY SELL-65.542
SL-66.159
TP1-65.320
TP2-65.063

GBPCAD BUY -1.77396
SL-1.76575
TP1-1.77673
TP2-1.78011

USDCHF SELL -0.93244
SL-0.93848
TP1-0.92968
TP2-0.92659

GBPCHF SELL – 1.20571
SL-1.21466
TP1-1.20264
TP2-1.19952

GBPJPY SELL -134.651
SL-136.077
TP1-134.305
TP2-133.974

GBPUSD SELL -1.28696
SL-1.29617
TP1-1.28327
TP2-1.27892

AUDCAD BUY -0.89427
SL-0.89025
TP1-0.89616
TP2-0.89805

GBPAUD SELL – 1.97703
SL-1.98647
TP1-1.97356
TP2-1.97024

The Australian Dollar is correcting. Overview for 02.03.2020

The Australian Dollar is correcting. Overview for 02.03.2020

02.03.2020

In the first trading session of this spring, AUDUSD is attempting to reverse the trend.

On Monday morning, the Aussie is correcting upwards against the USD. The current quote for the instrument is 0.6513.

The statistics published in the morning showed that the AIG Manufacturing Index in Australian dropped to 44.3 points in February after being 45.4 points in the previous month. The Index is calculated based on surveys of managers of the largest companies and enterprises and reflects their attitude to the country’s economy and market expectations. Every number that exceeds 50 pointы is good, but in this case, it is otherwise.

Earlier, China reported on the Caixin Manufacturing PMI, which plummeted down to 40.3 points in February after being 51.1 points the month before. The reason is pretty clear – the new coronavirus, and that’s just the top of the iceberg. Everything related to the virus outbreak is surely to affect the Chinese economy somehow.

The behavior of the Chinese economy is very important for the Aussie: China is Australia’s key trade and economic partner, that’s why slowdowns in China will be very hurtful to the Australian economy.

Fibonacci Retracements Analysis 13.11.2019 (GBPUSD, EURJPY)

13.11.2019

GBPUSD, “Great Britain Pound vs US Dollar”

As we can see in the H4 chart, the descending correction continues after reaching at 76.0% fibo at 1.3040 and the divergence on MACD. The support is at 1.2670. After completing the pullback, the instrument may start another rising impulse to break the previous high at 1.3012 and then reach the key one at 1.3381.

GBPUSD_H4
Risk Warning: the result of previous trading operations do not guarantee the same results in the future

In the H1 chart, after retesting 23.6% fibo, the pair was forced by the convergence to finish the previous descending wave and start moving upwards. It doesn’t necessarily mean that the price will continue growing to reach 1.3012, that’s why one should expect further decline with the possible targets at 38.2%, 50.0%, and 61.8% fibo at 1.2699, 1.2604, and 1.2508 respectively.

GBPUSD_H1
Risk Warning: the result of previous trading operations do not guarantee the same results in the future

EURJPY, “Euro vs. Japanese Yen”

As we can see in the H4 chart, after reaching 76.0% fibo at 121.55, the pair is correcting downwards to reach the local support at 38.2% fibo at 118.73. However, if EURJPY breaks the high at 121.47, the price may continue growing with the key target at 123.36.

EURJPY_H4
Risk Warning: the result of previous trading operations do not guarantee the same results in the future

In the H1 chart, the pair is getting closer to 38.2% fibo at 119.79. at the same time, there is s convergence on MACD, which may indicate either a reverse or a short-term pullback. Further decline may be heading towards 50.0% and 61.8% fibo at 119.27 and 118.75 respectively.

EURJPY_H1
Risk Warning: the result of previous trading operations do not guarantee the same results in the future

Fibonacci Retracements Analysis 23.10.2019 (GBPUSD, EURJPY)

23.10.2019

GBPUSD, “Great Britain Pound vs US Dollar”

As we can see in the H4 chart, there was a divergence on MACD, which made GBPUSD complete the rising wave at 76.0% fibo at 1.3040 and start a new pullback. The downside targets are 23.6%, 38.2%, 50.0%, and 61.8% fibo at 1.2819, 1.2700, 1.2600, and 1.2506 respectively.

GBPUSD_H4
Risk Warning: the result of previous trading operations do not guarantee the same results in the future

The H1 chart shows more detailed structure of the current descending correction after the divergence.

GBPUSD_H1
Risk Warning: the result of previous trading operations do not guarantee the same results in the future

EURJPY, “Euro vs. Japanese Yen”

As we can see in the H4 chart, there was a divergence on MACD, which made EURJPY finish the ascending wave at 76.0% fibo at 121.55 and start a new decline, which has already reached 23.6% fibo. The next downside targets are 38.2%, 50.0%, and 61.8% fibo at 119.79, 119.27, and 118.75 respectively. the resistance is the high at 121.47.

EURJPY_H4
Risk Warning: the result of previous trading operations do not guarantee the same results in the future

In the H1 chart, the pair is about to reach 23.6% fibo.

EURJPY_H1
Risk Warning: the result of previous trading operations do not guarantee the same results in the future