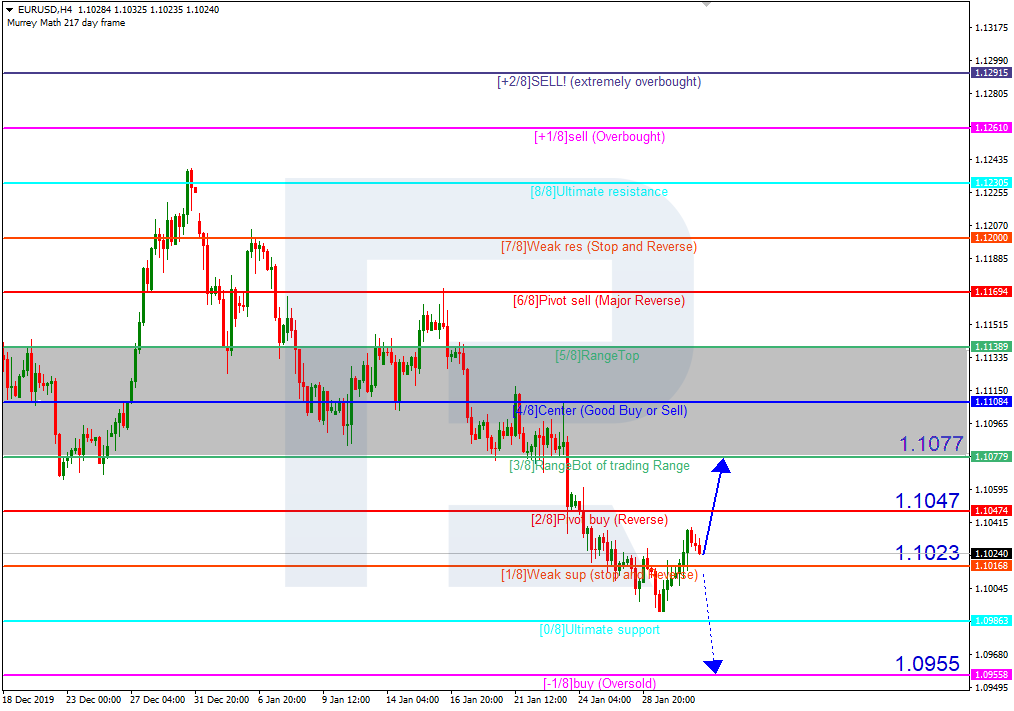
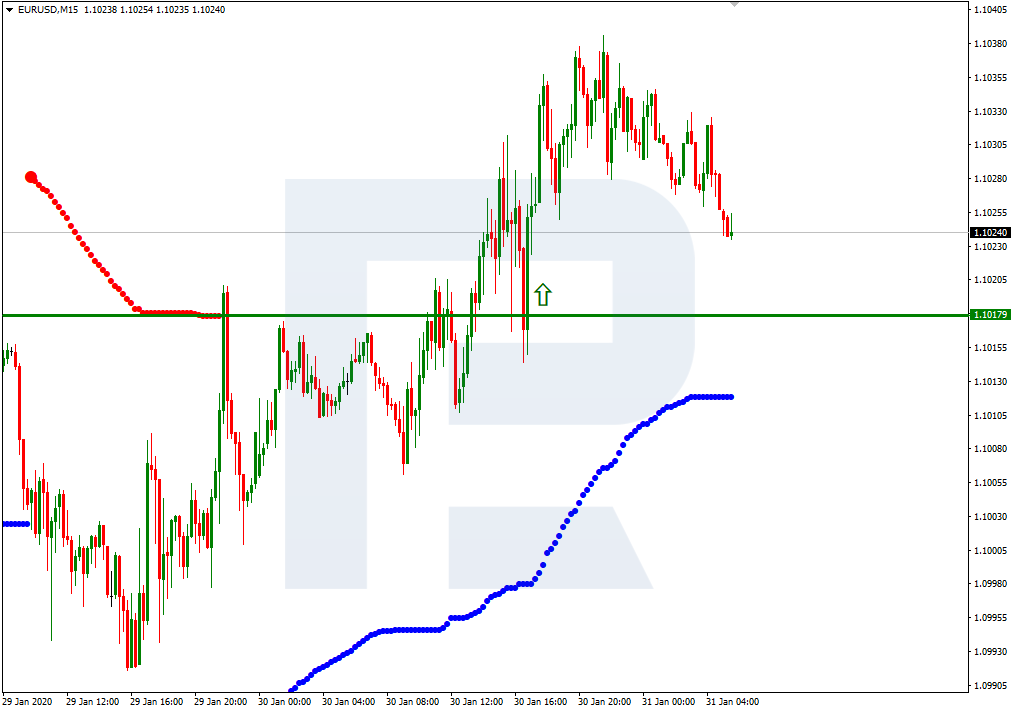
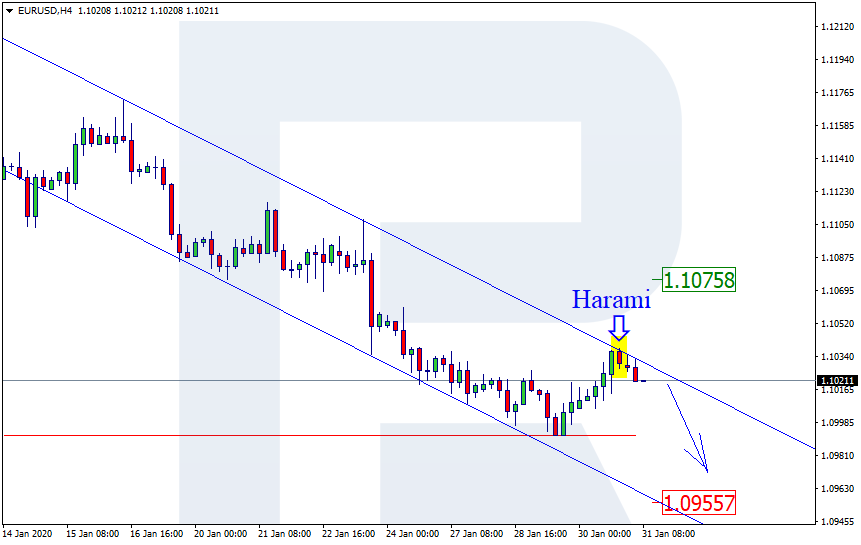
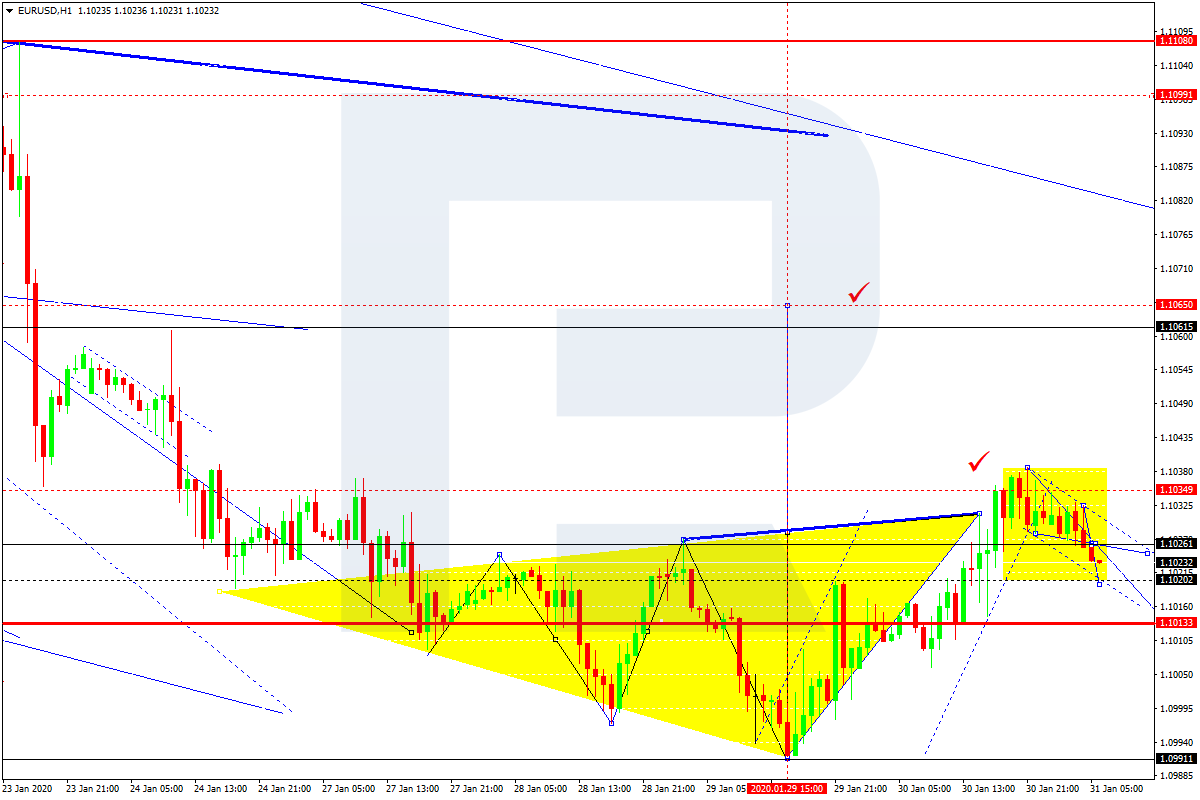
EURUSD, “Euro vs US Dollar”
EURUSD has completed another ascending impulse towards 1.1038; right now, it is correcting towards 1.1013. After that, the instrument may form one more ascending structure to break 1.1038 and then continue growing with the target at 1.1060.

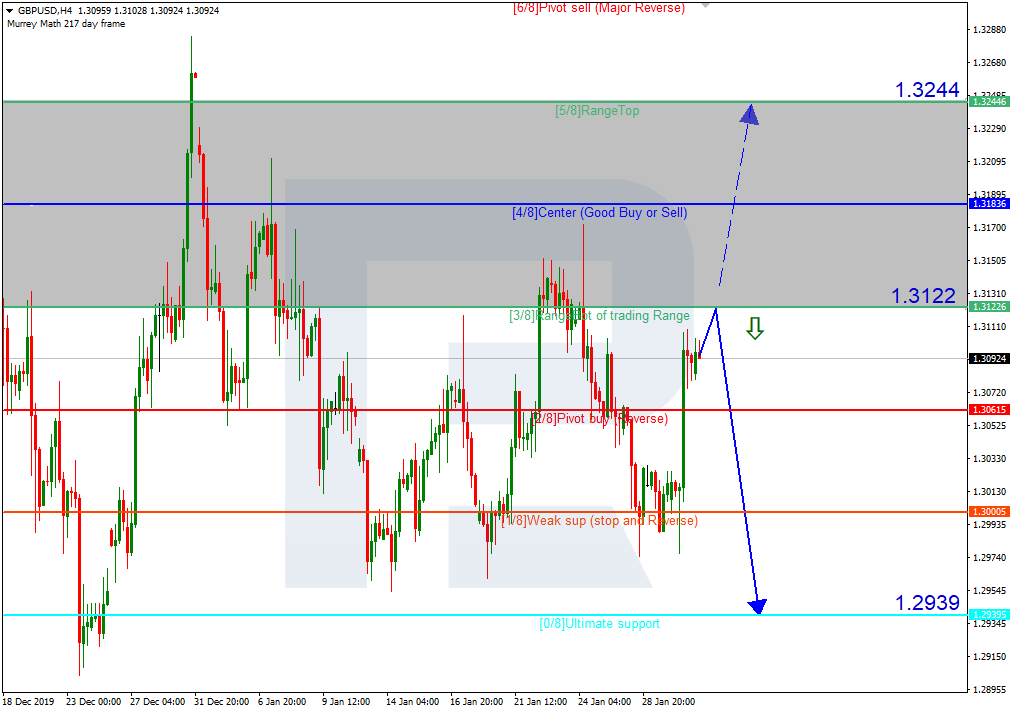
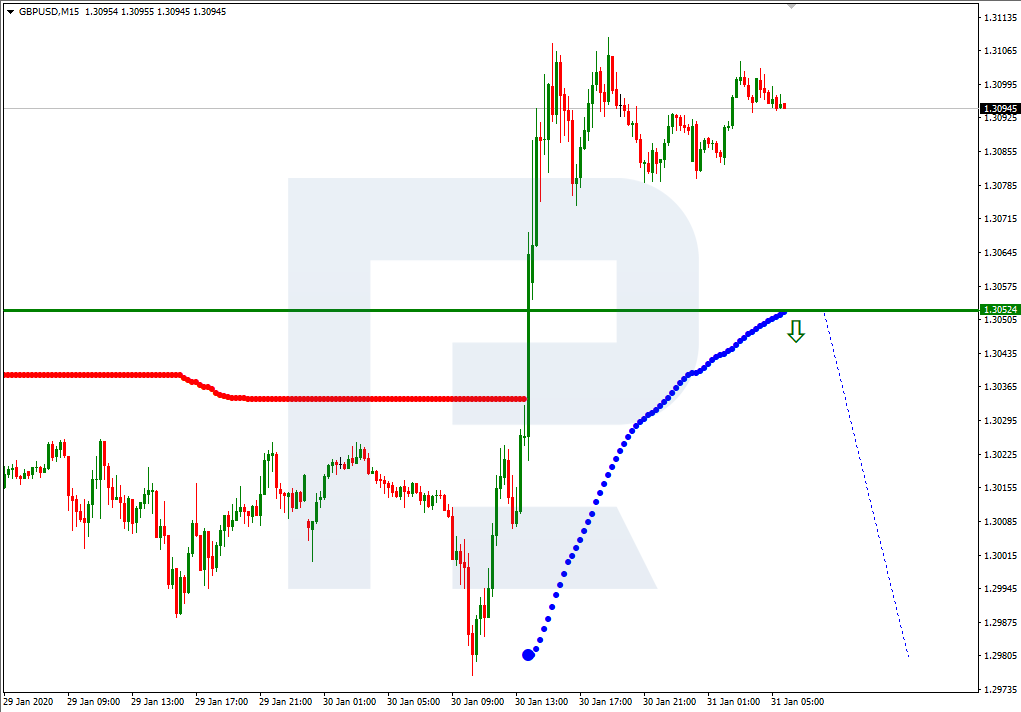
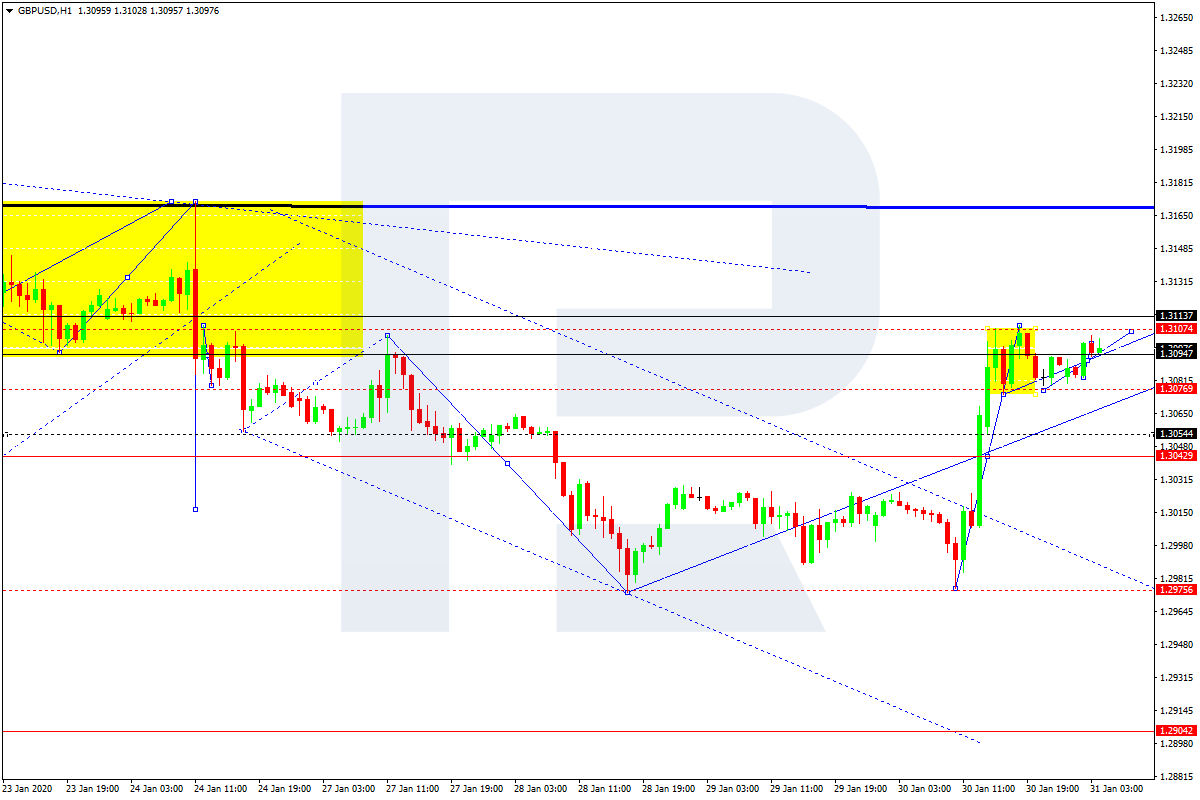
GBPUSD, “Great Britain Pound vs US Dollar”
GBPUSD has returned to 1.3085; right now, it is consolidating near the highs. Possibly, the pair may form a new descending structure towards 1.3040 and then start another growth with the target at 1.3090.
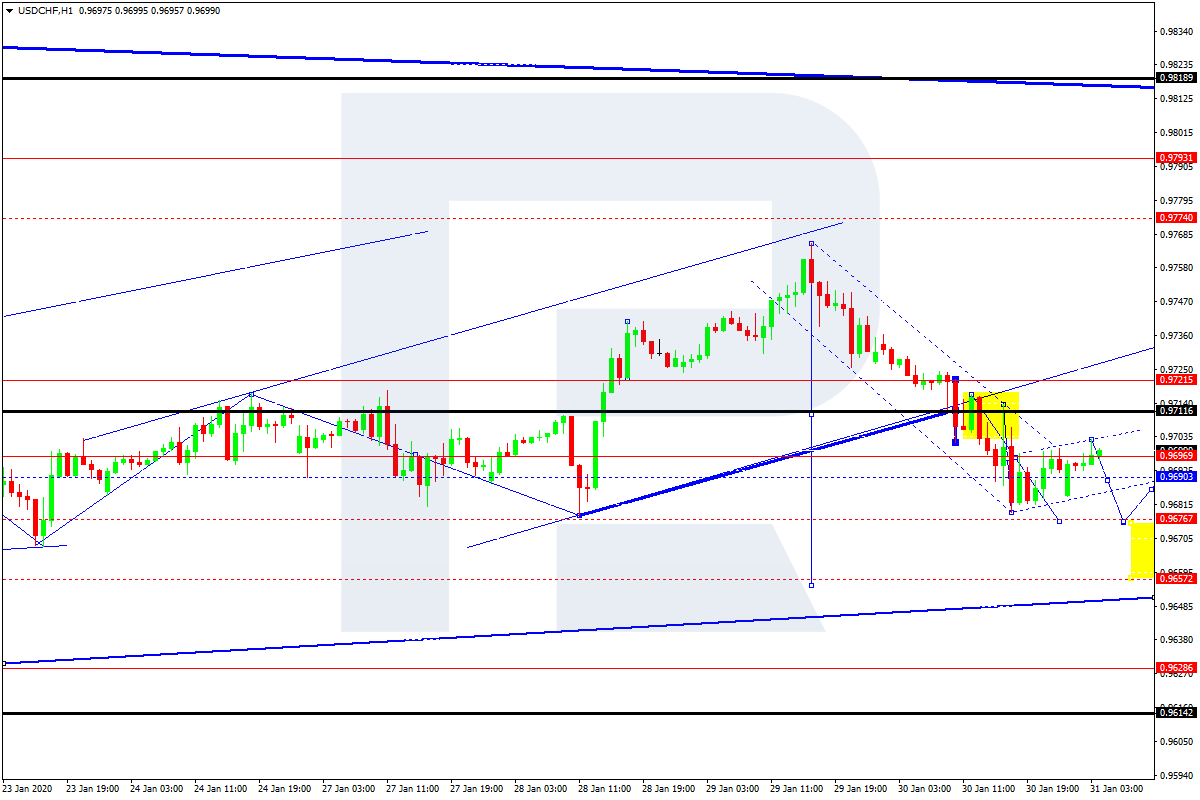
USDCHF, “US Dollar vs Swiss Franc”
After finishing the descending structure towards 0.9680, USDCHF has completed the correction at 0.9700. Later, the market may start a new decline with the target at 0.9661.
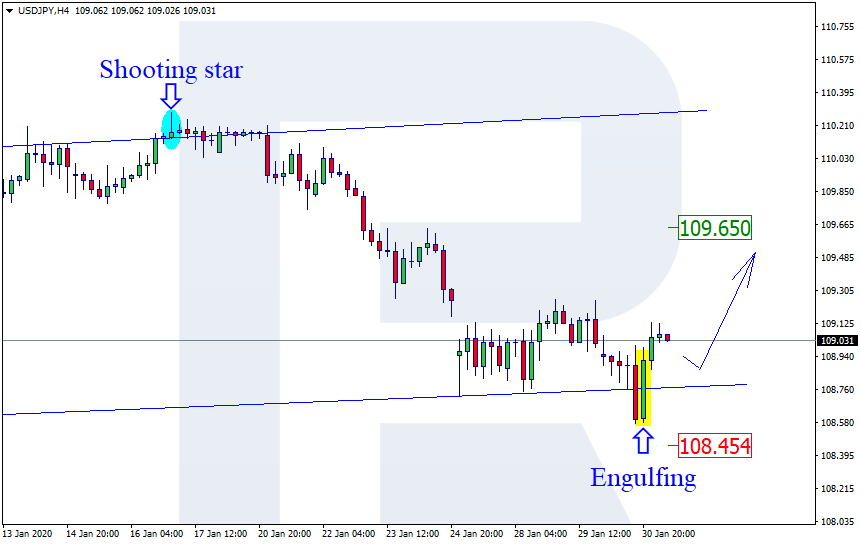
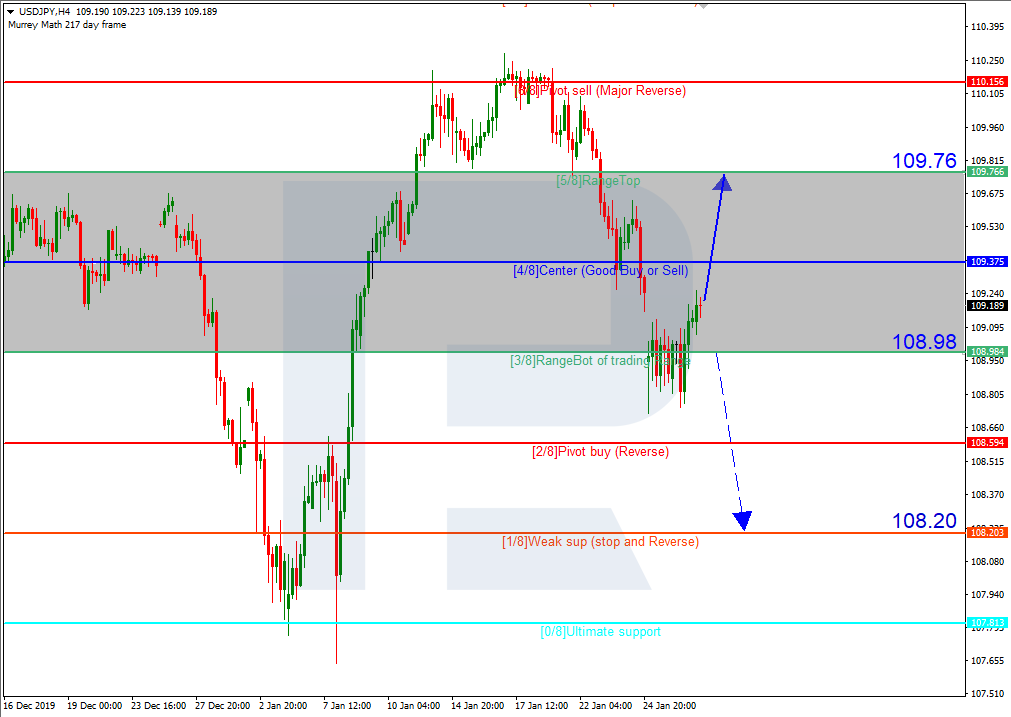
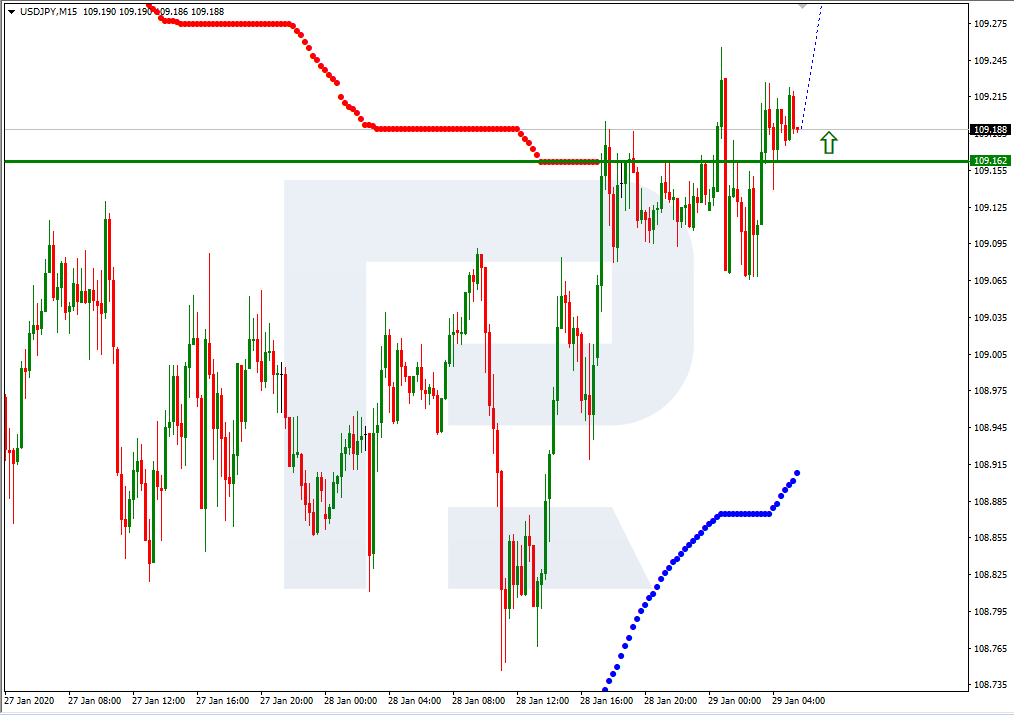
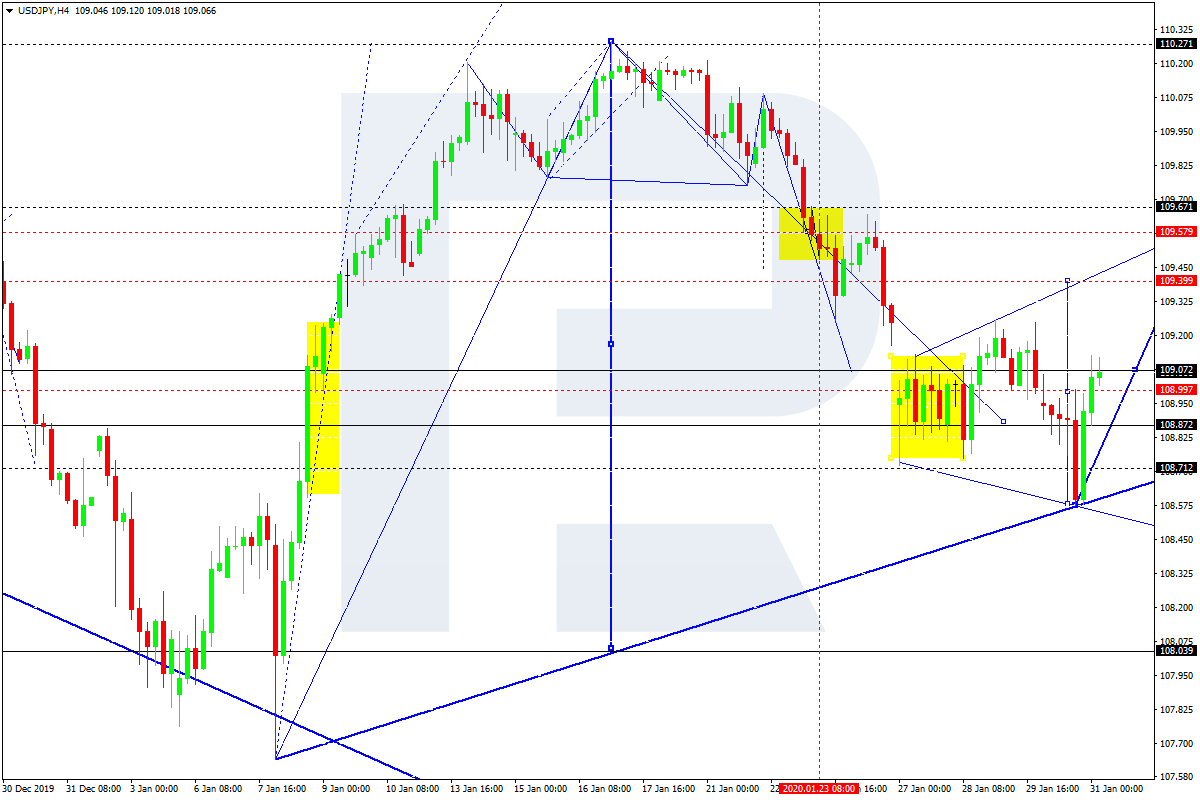
USDJPY, “US Dollar vs Japanese Yen”
USDJPY is still consolidating around 108.99. Possibly, today the pair may expand the range up to 109.39 or even 109.57 to test it from below. Later, the market may resume falling inside the downtrend with the target at 108.03.
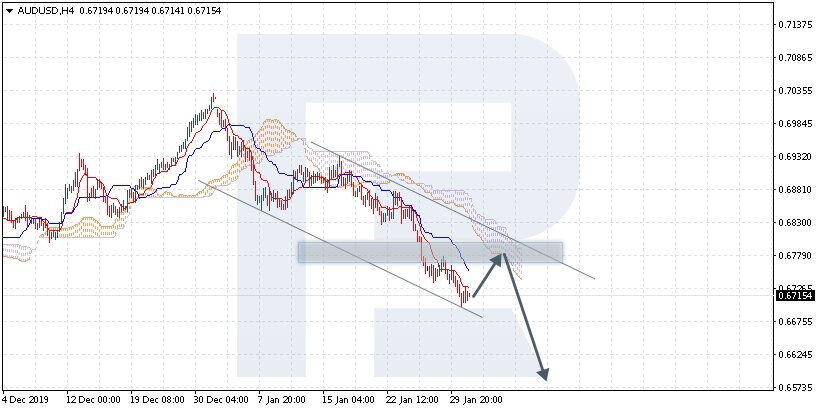
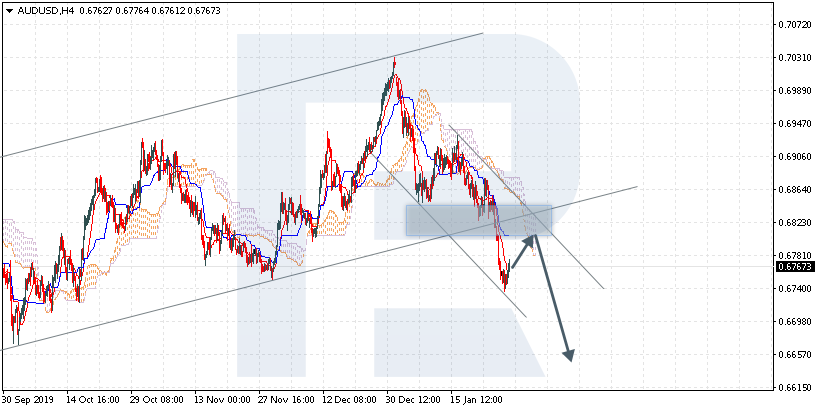
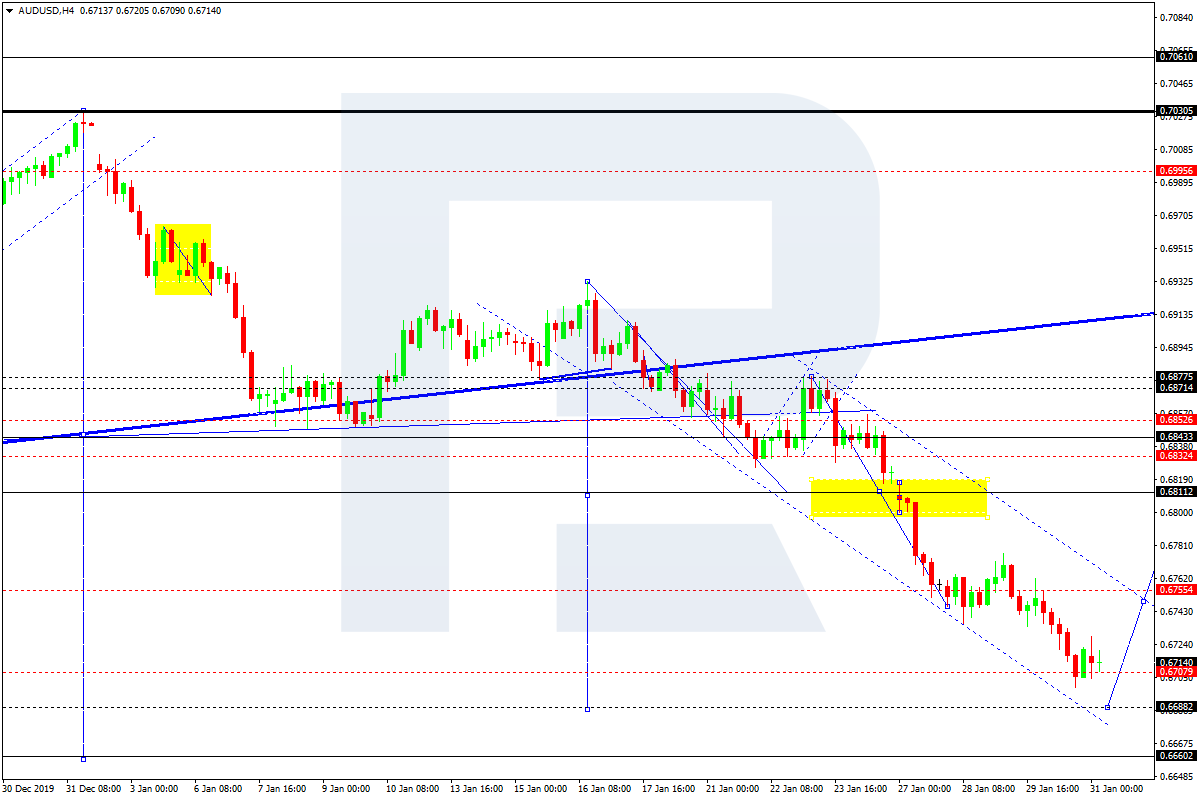
AUDUSD, “Australian Dollar vs US Dollar”
After breaking 0.6733, AUDUSD has completed the descending structure towards 0.6707. Today, the pair may grow to test 0.6733 from below and then resume trading downwards with the target at 0.6688.
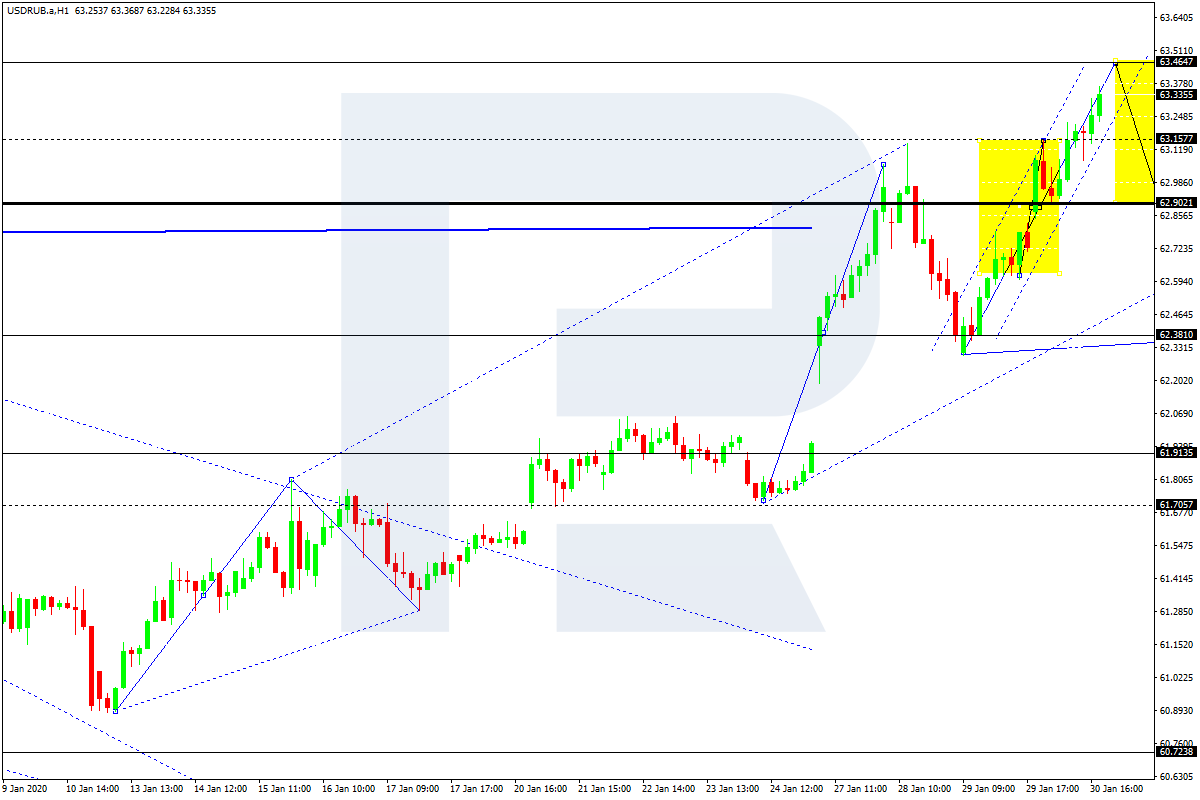
USDRUB, “US Dollar vs Russian Ruble”
USDRUB is moving upwards. Possibly, the pair may reach 63.50 and then form a new descending structure to break 62.90. Later, the market may resume trading downwards with the first target at 62.38.
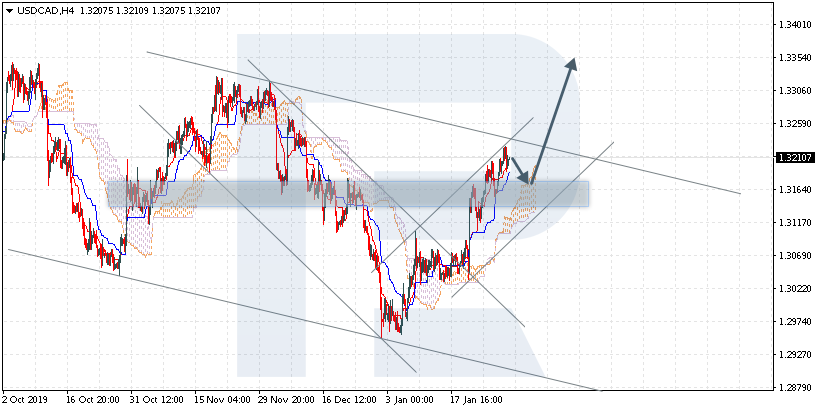
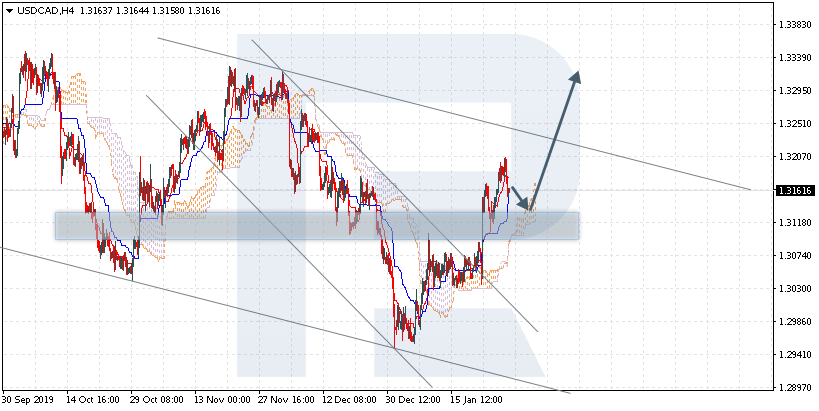
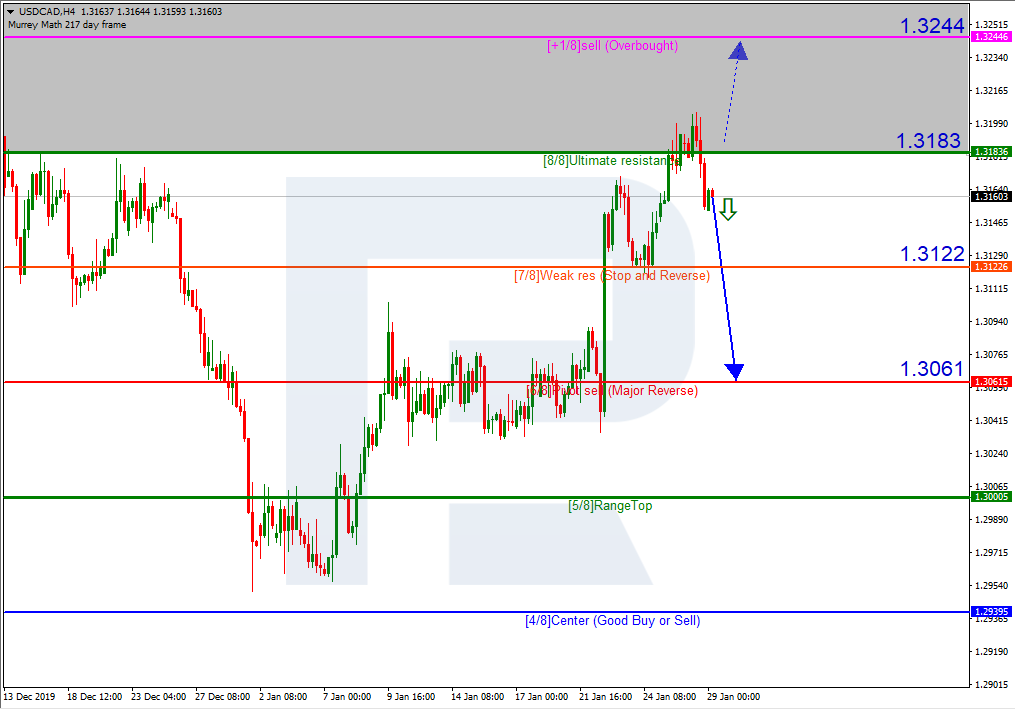
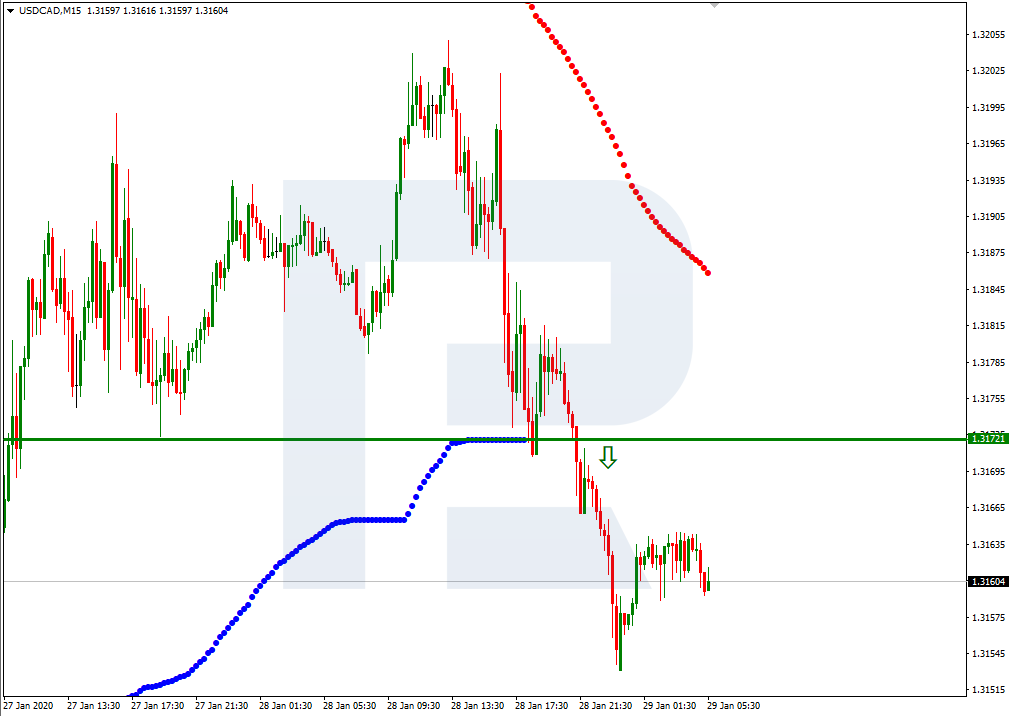
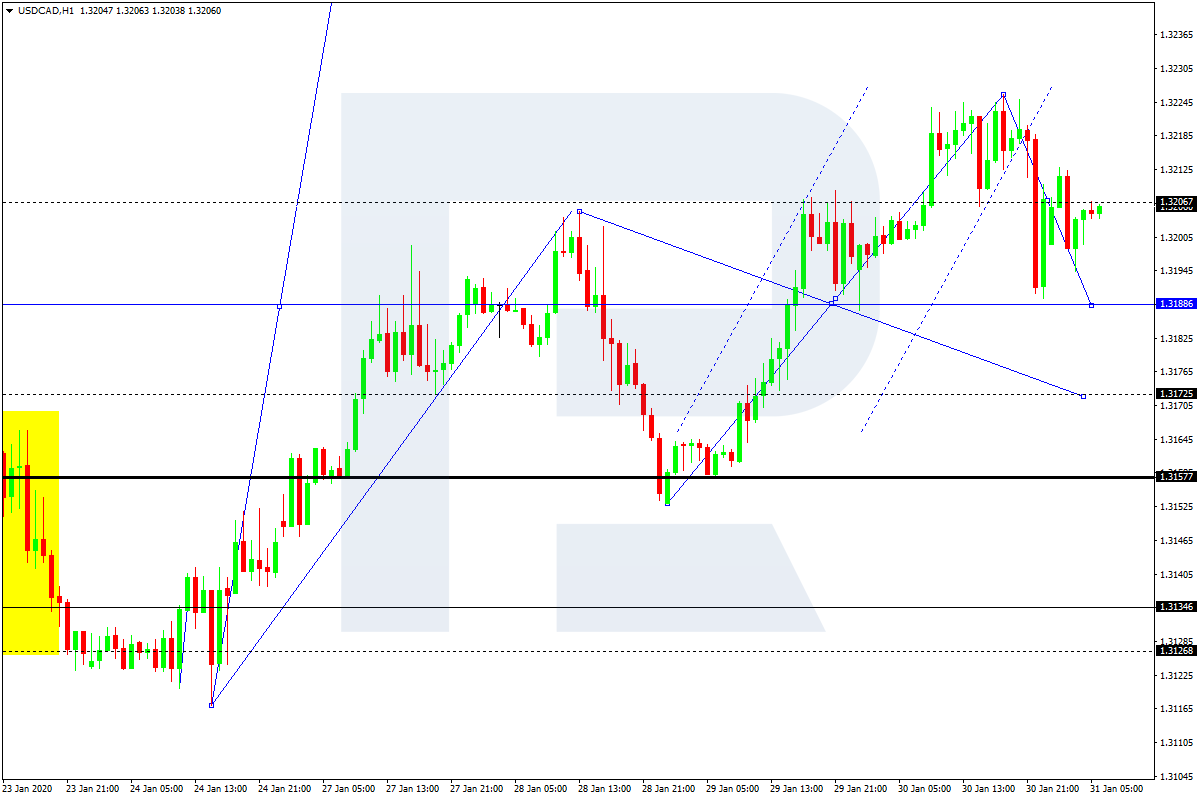
USDCAD, “US Dollar vs Canadian Dollar”
USDCAD is falling towards 1.3188 and may later start a new correction to reach 1.3206, thus forming a new consolidation range. If the price breaks this range to the downside, the market may form a new descending structure to reach 1.3170; if to the upside – resume growing with the target at 1.3250.
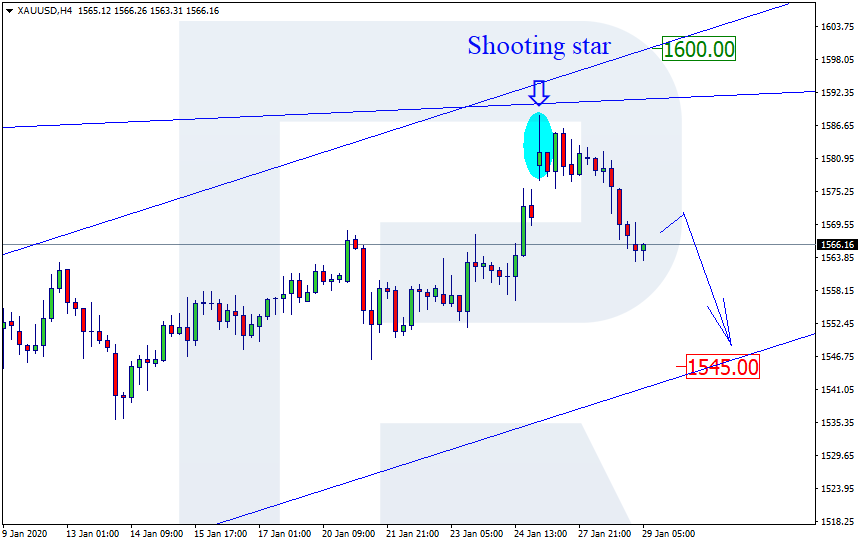
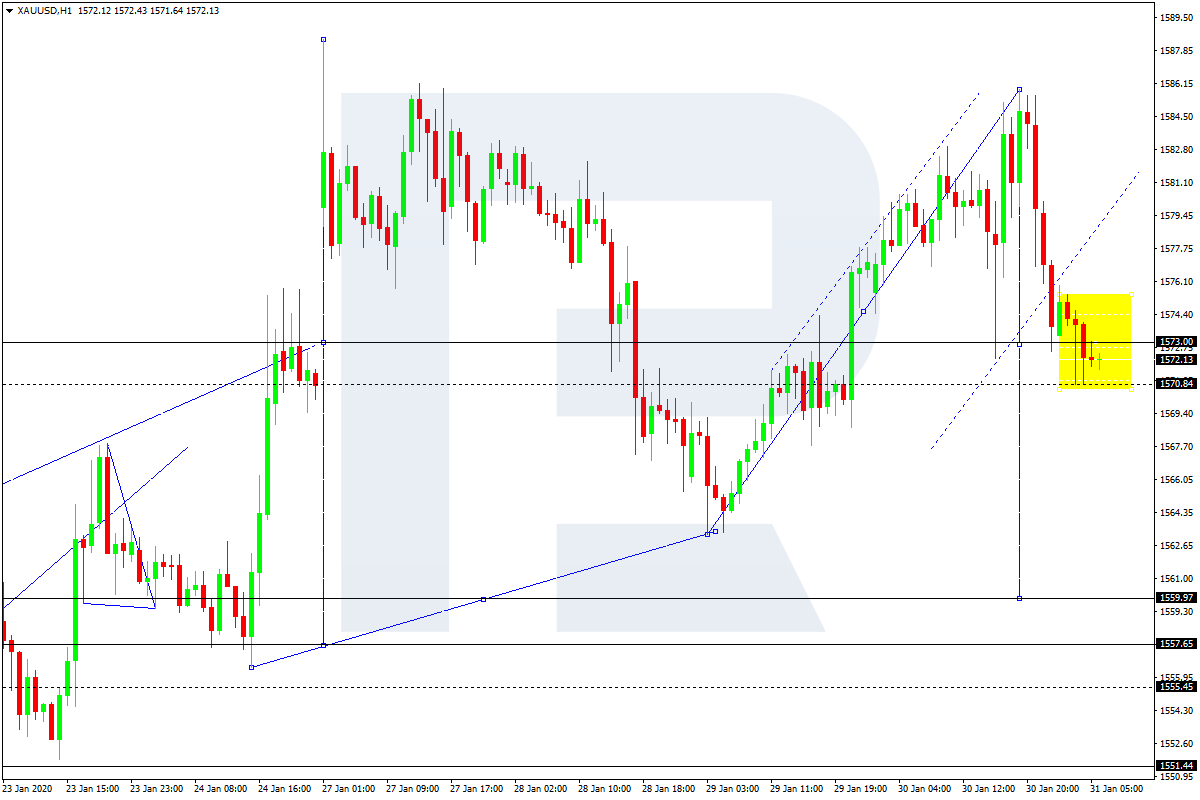
XAUUSD, “Gold vs US Dollar”
Gold is moving downwards. Possibly, the pair may break 1570.84. The downside target is at 1560.00.
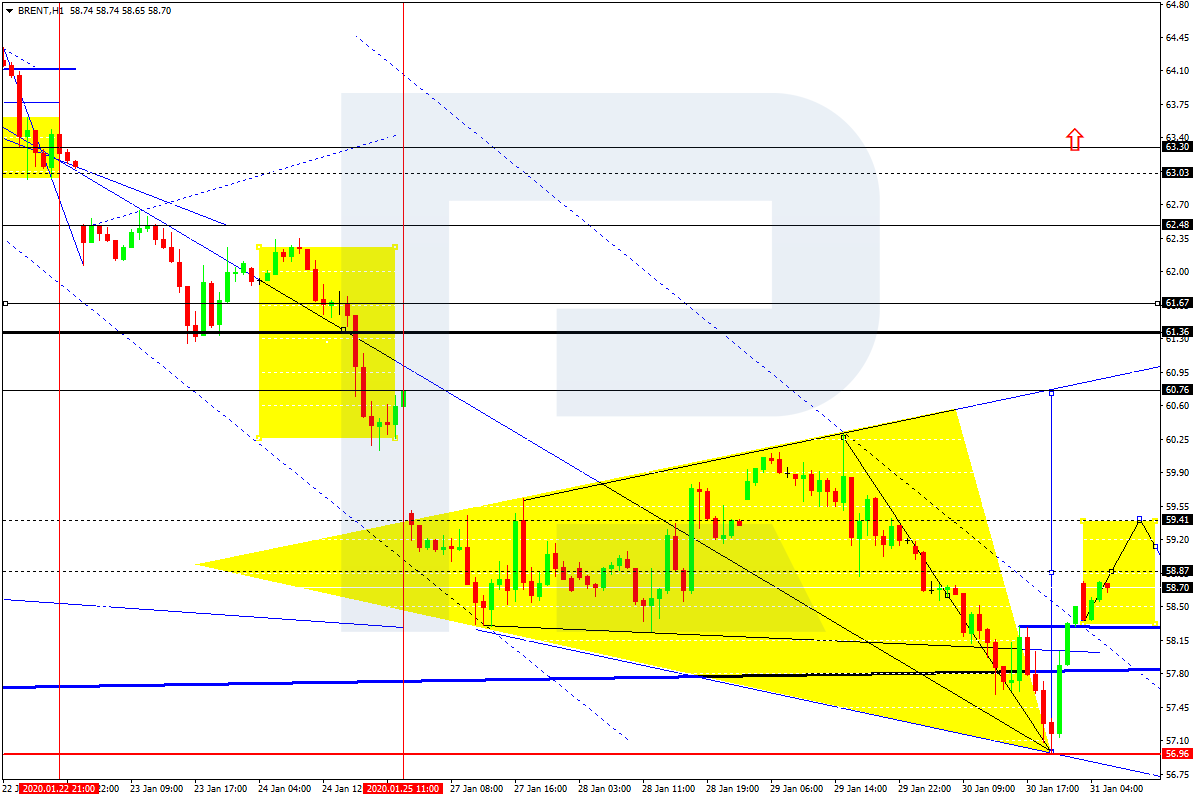
BRENT
Brent is growing towards 58.87. Today, the pair is expected to form a new consolidation around this level. If later the price breaks this range to the upside, the market may continue trading upwards with the target at 60.75.
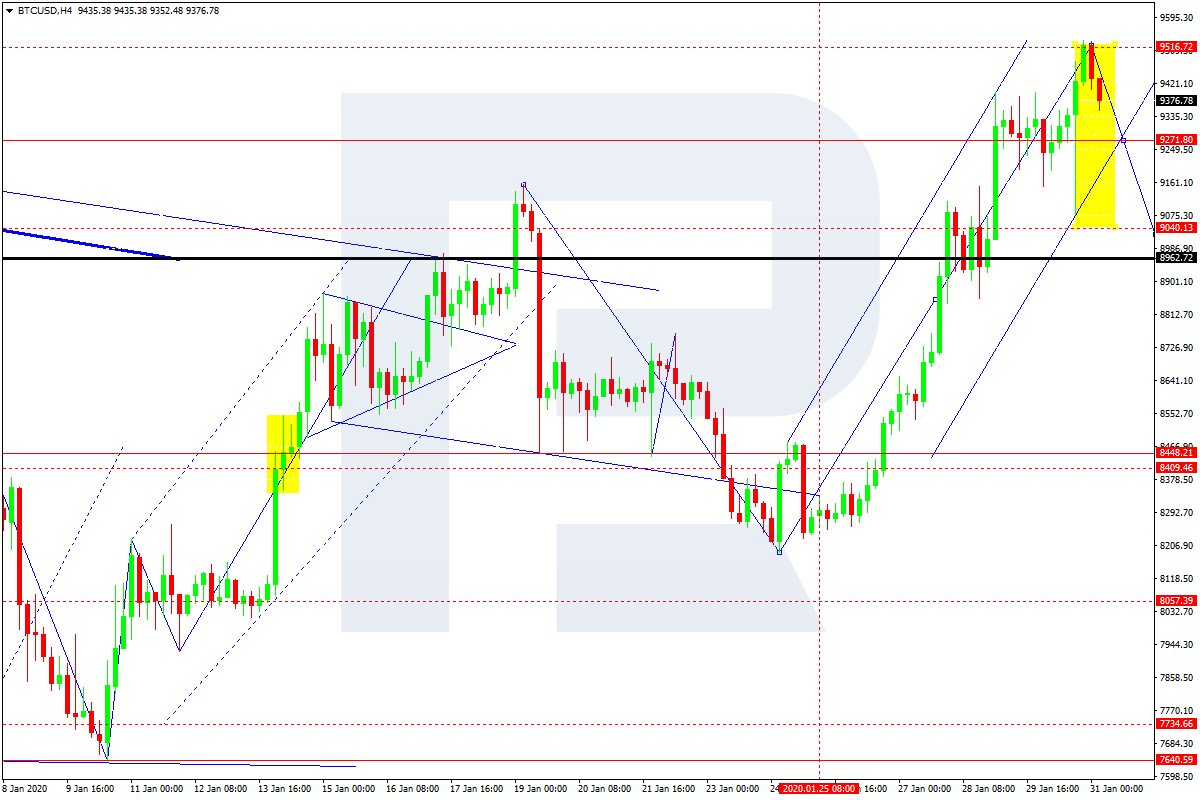
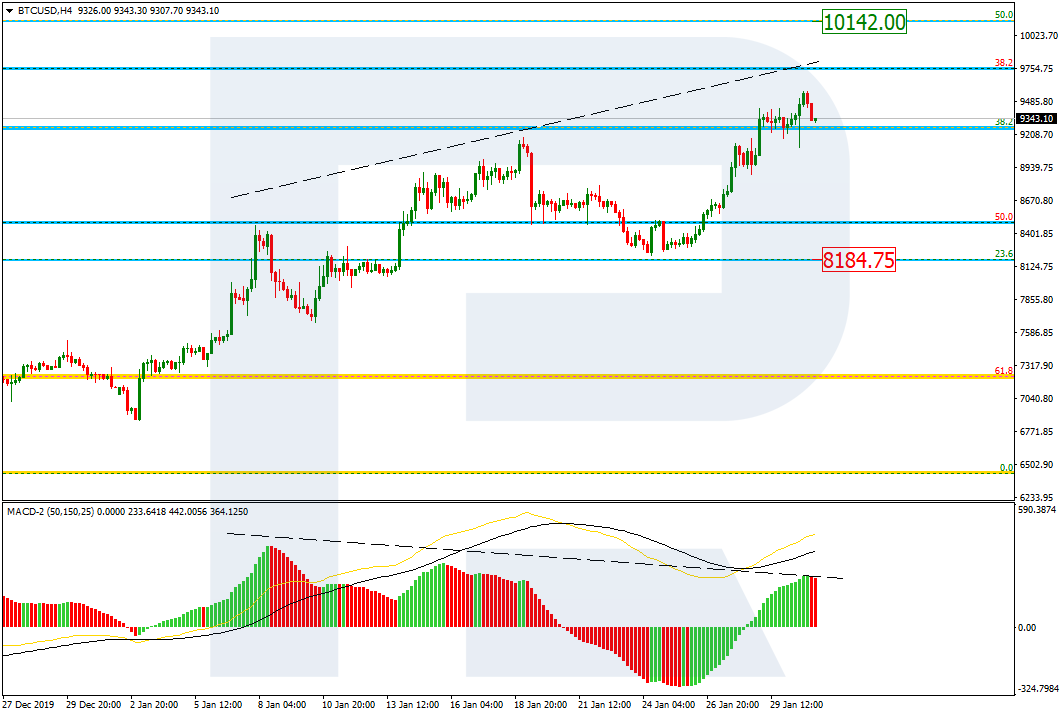
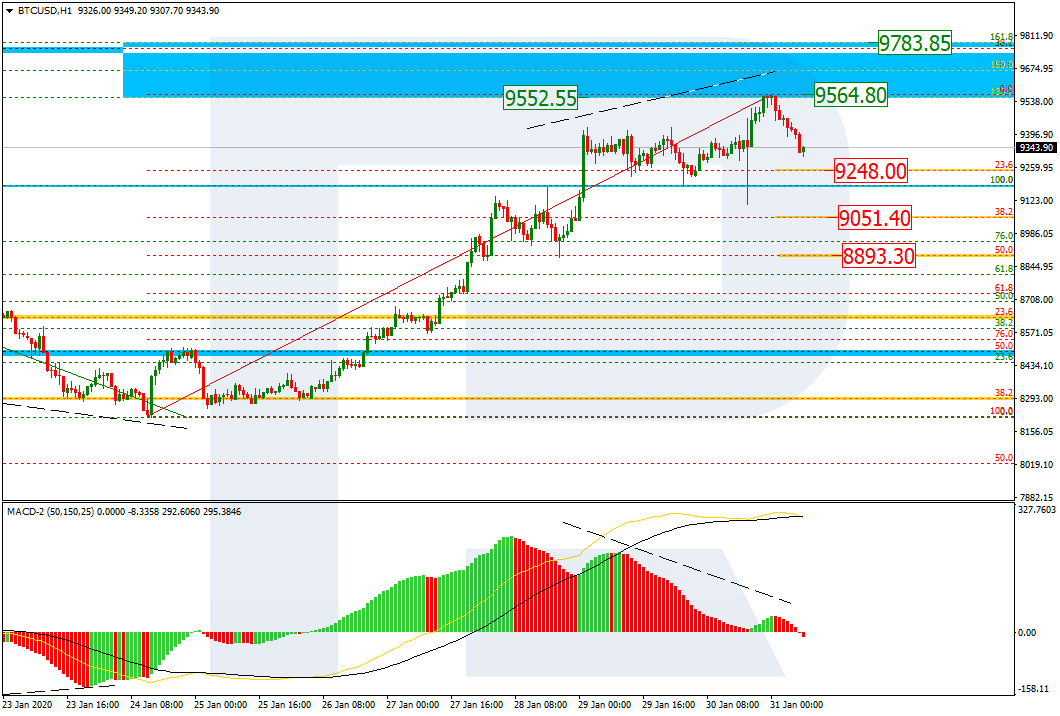
BTCUSD, “Bitcoin vs US Dollar”
BTCUSD has reached 9500.00; right now, it is moving downwards. The main scenario implies that the pair may fall to reach 9050.00 and then start a new correction towards 9250.00. After that, the instrument may continue falling with the target at 8500.00.