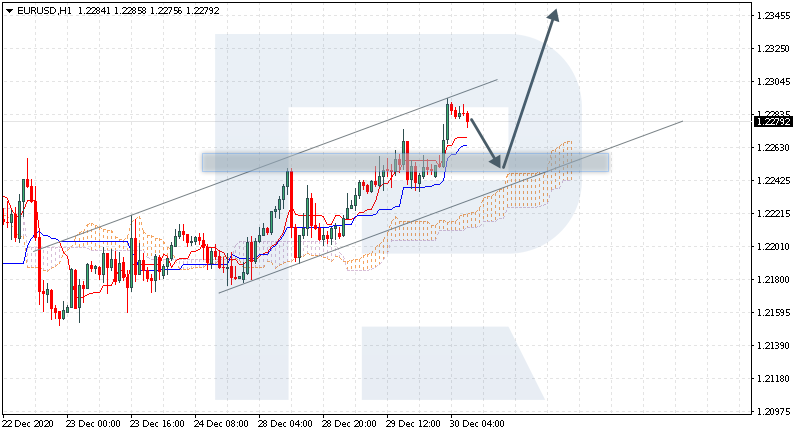
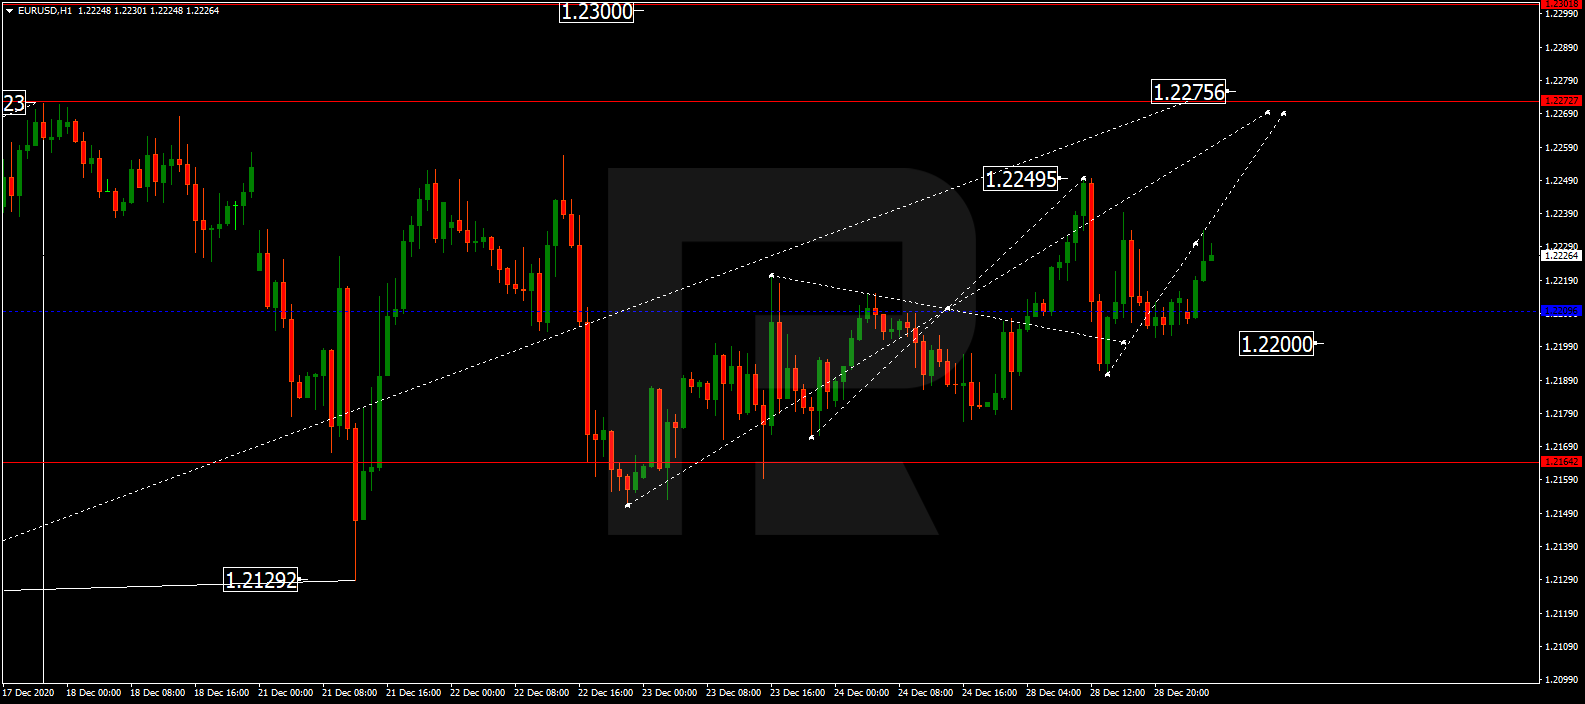
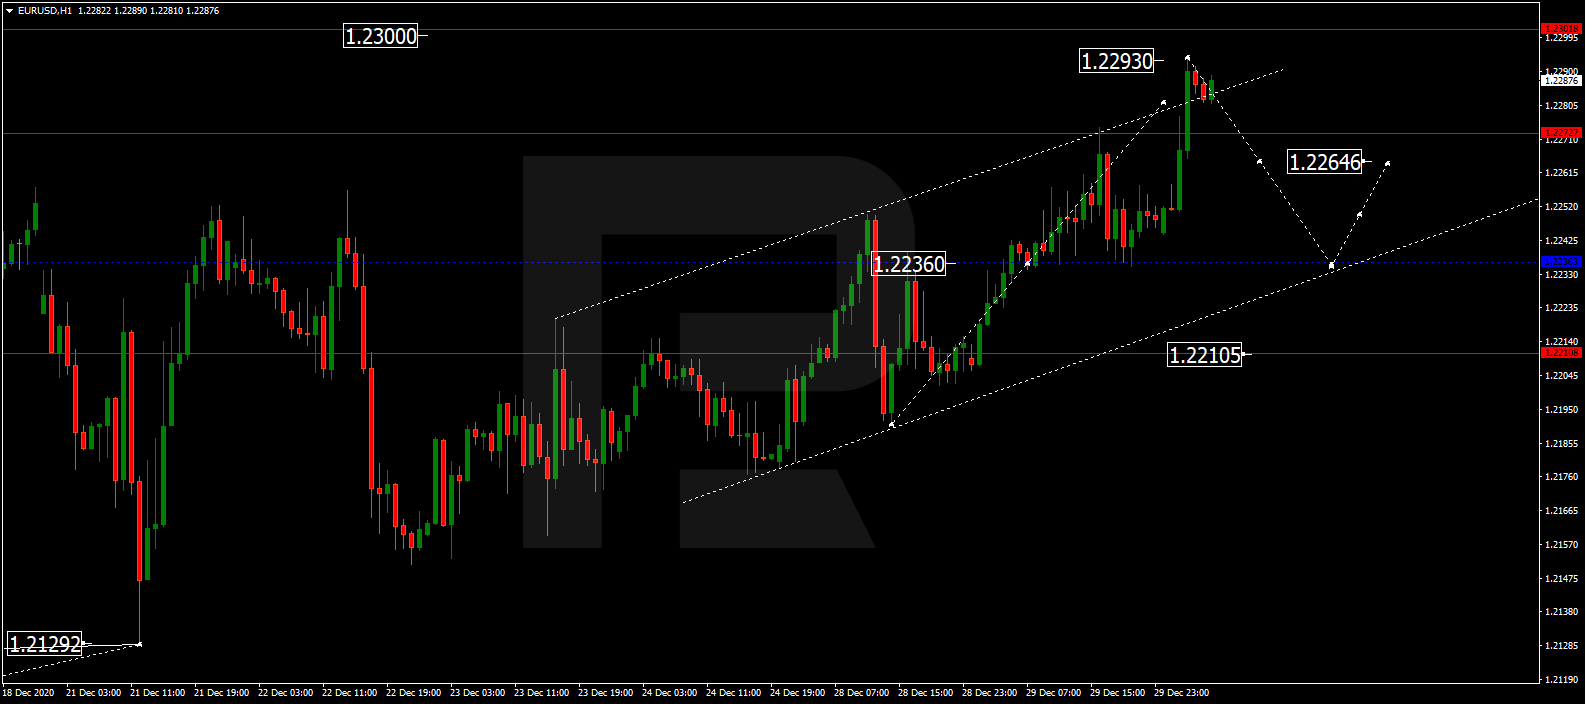
EURUSD, “Euro vs US Dollar”
After finishing the ascending wave at 1.2293, EURUSD is consolidating below this level. If later the price breaks this range to the upside, the market may form one more ascending structure towards 1.2300; if to the downside – start a new correction with the target at 1.2210.

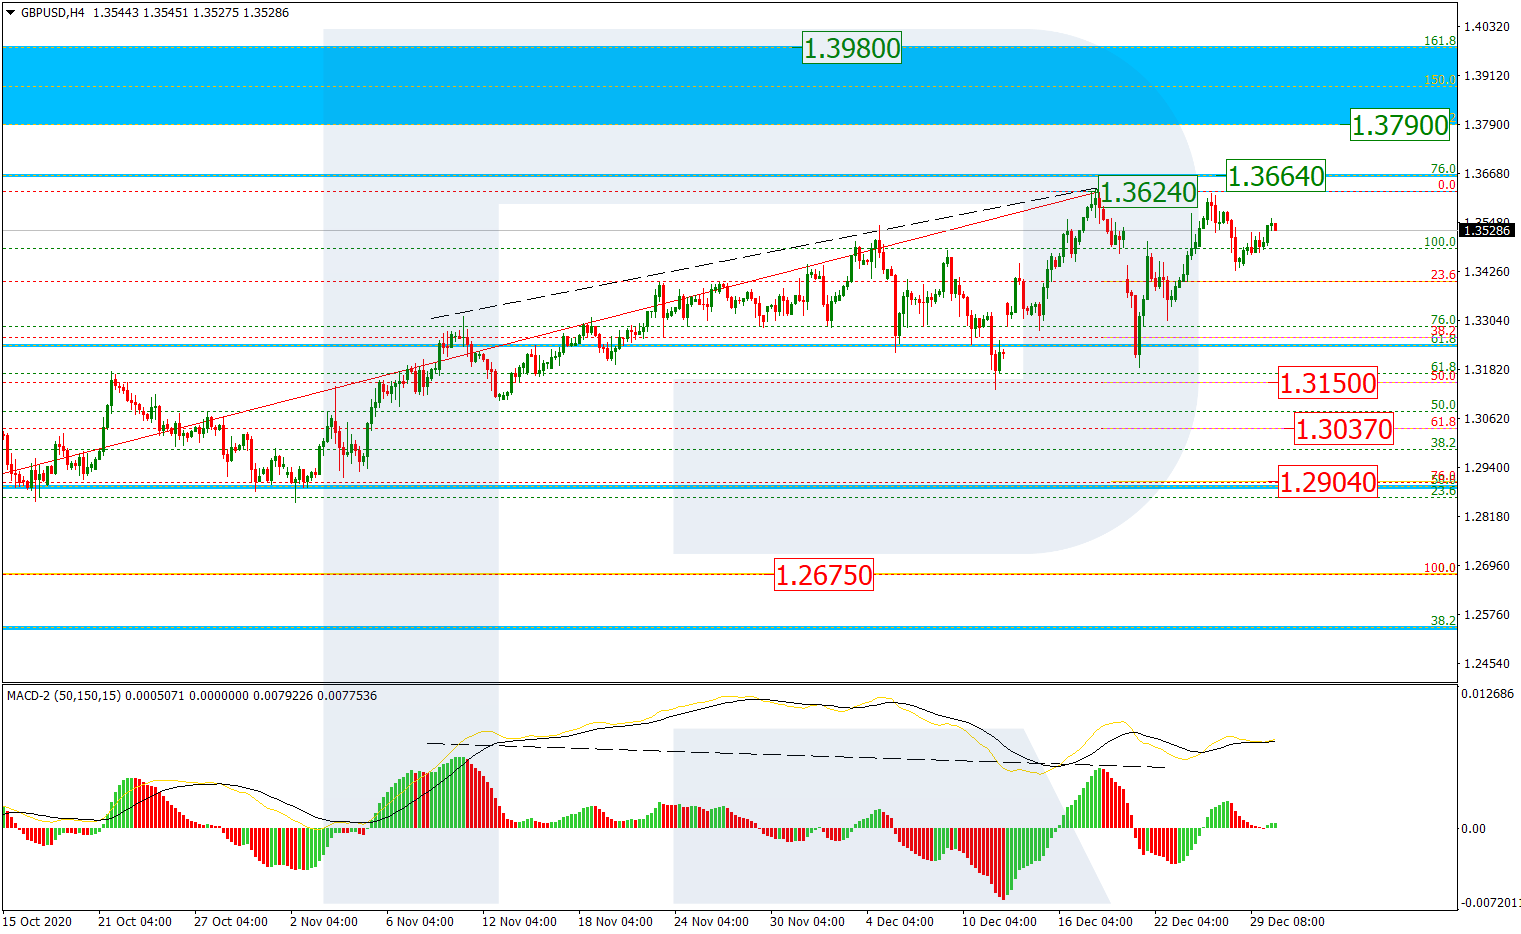
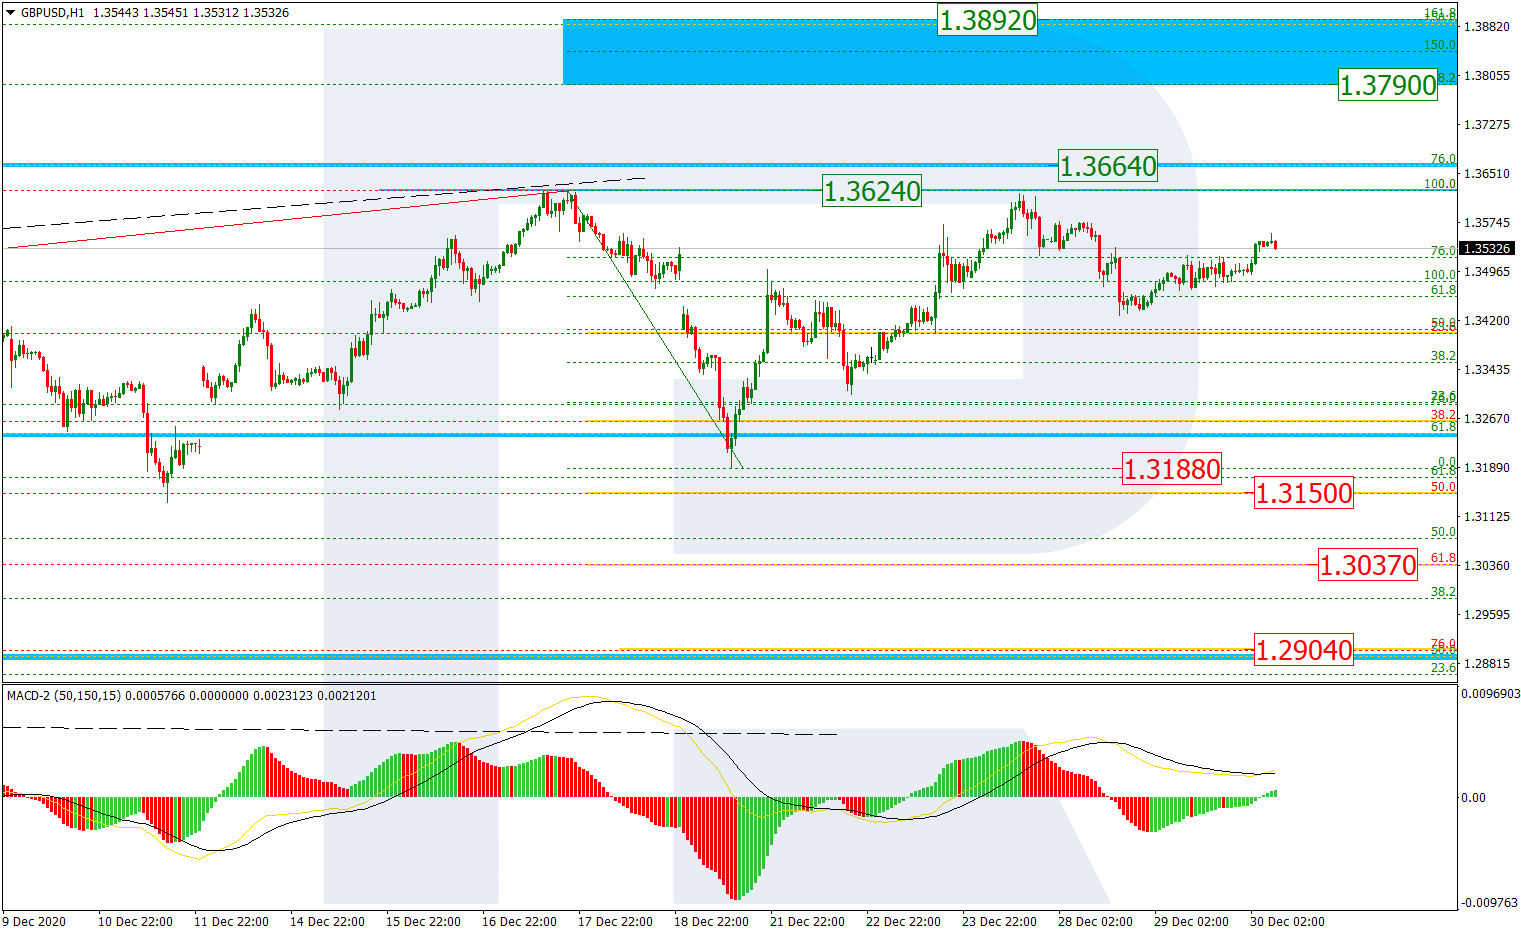
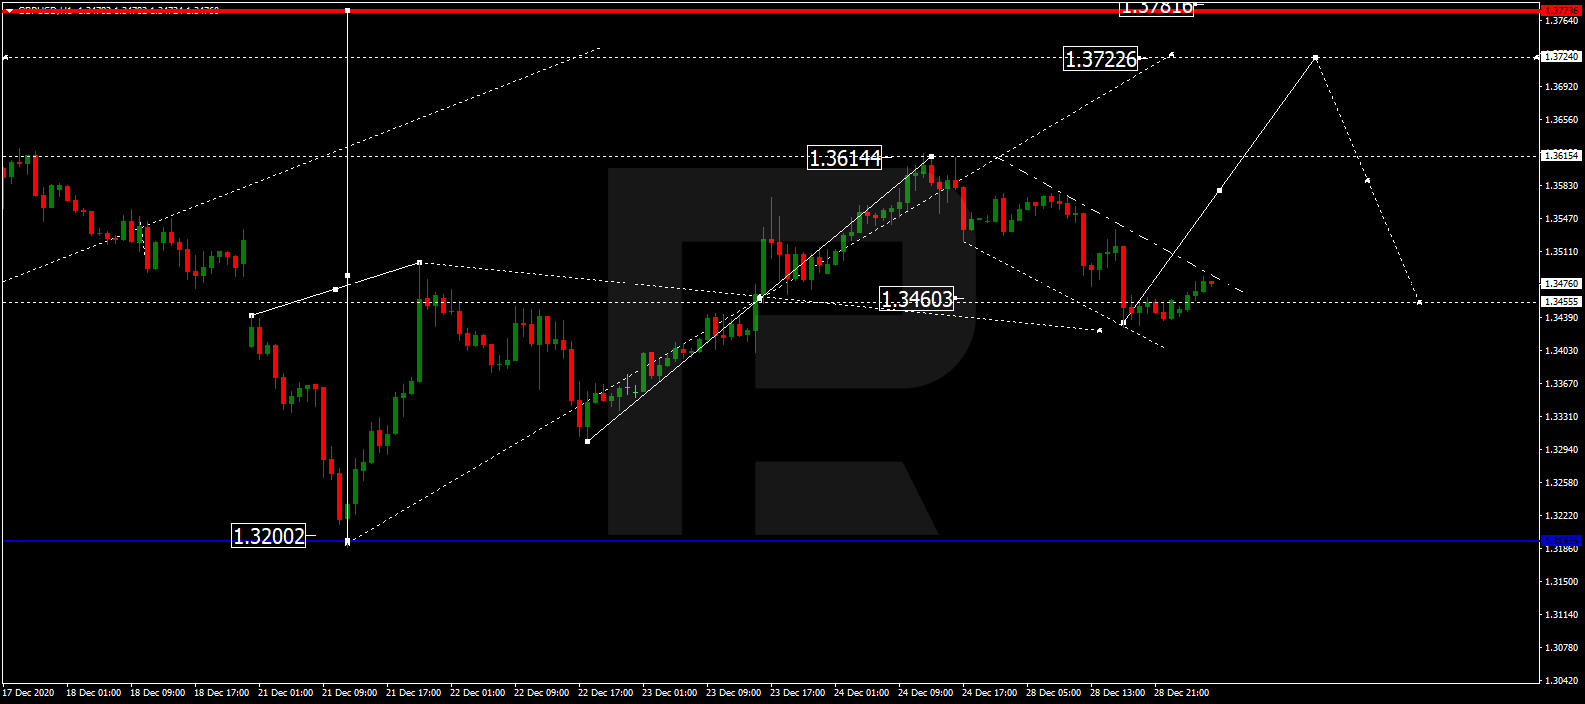
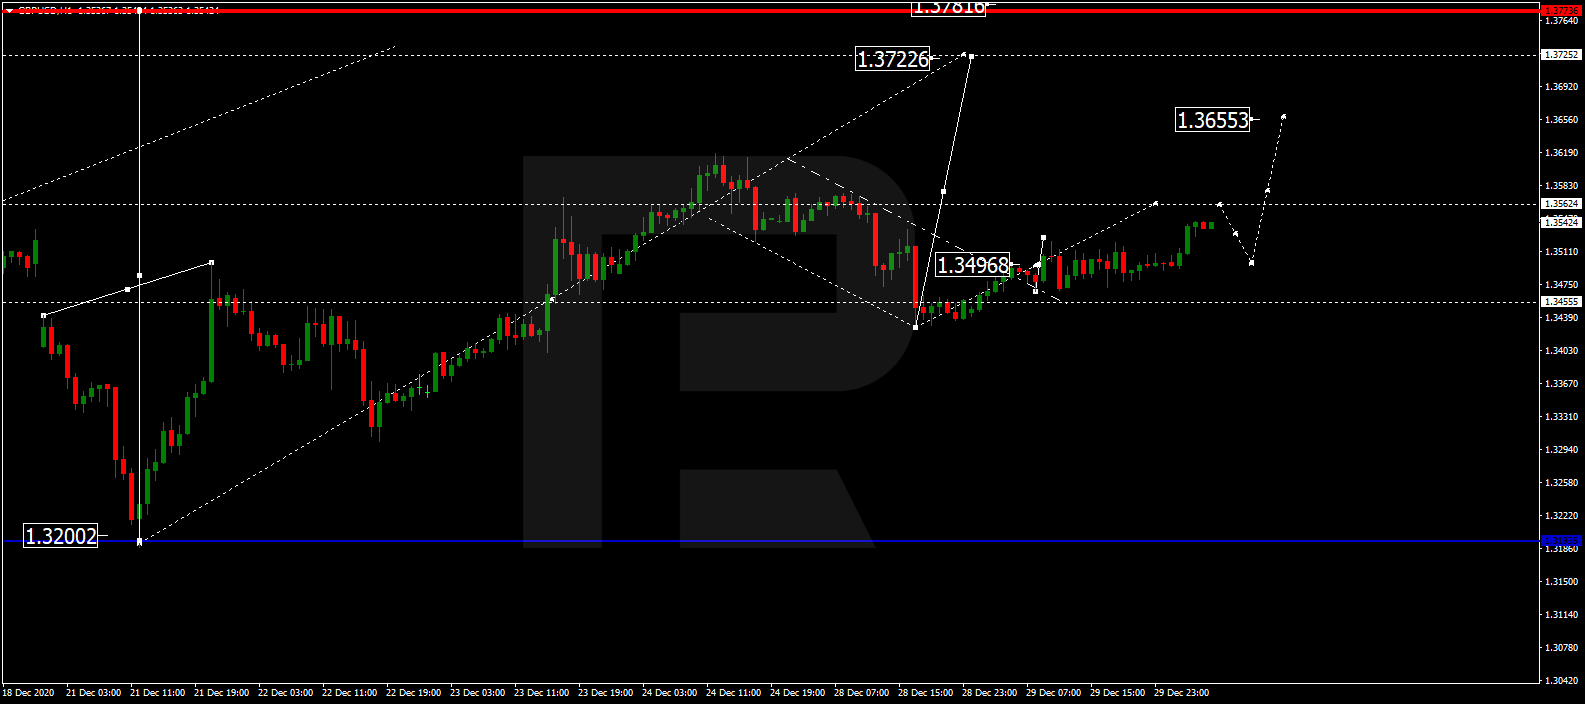
GBPUSD, “Great Britain Pound vs US Dollar”
GBPUSD is growing towards 1.3565 and may later correct to reach 1.3500. After that, the instrument may move upwards to break 1.3655 and then continue trading within the uptrend with the target at 1.3780.
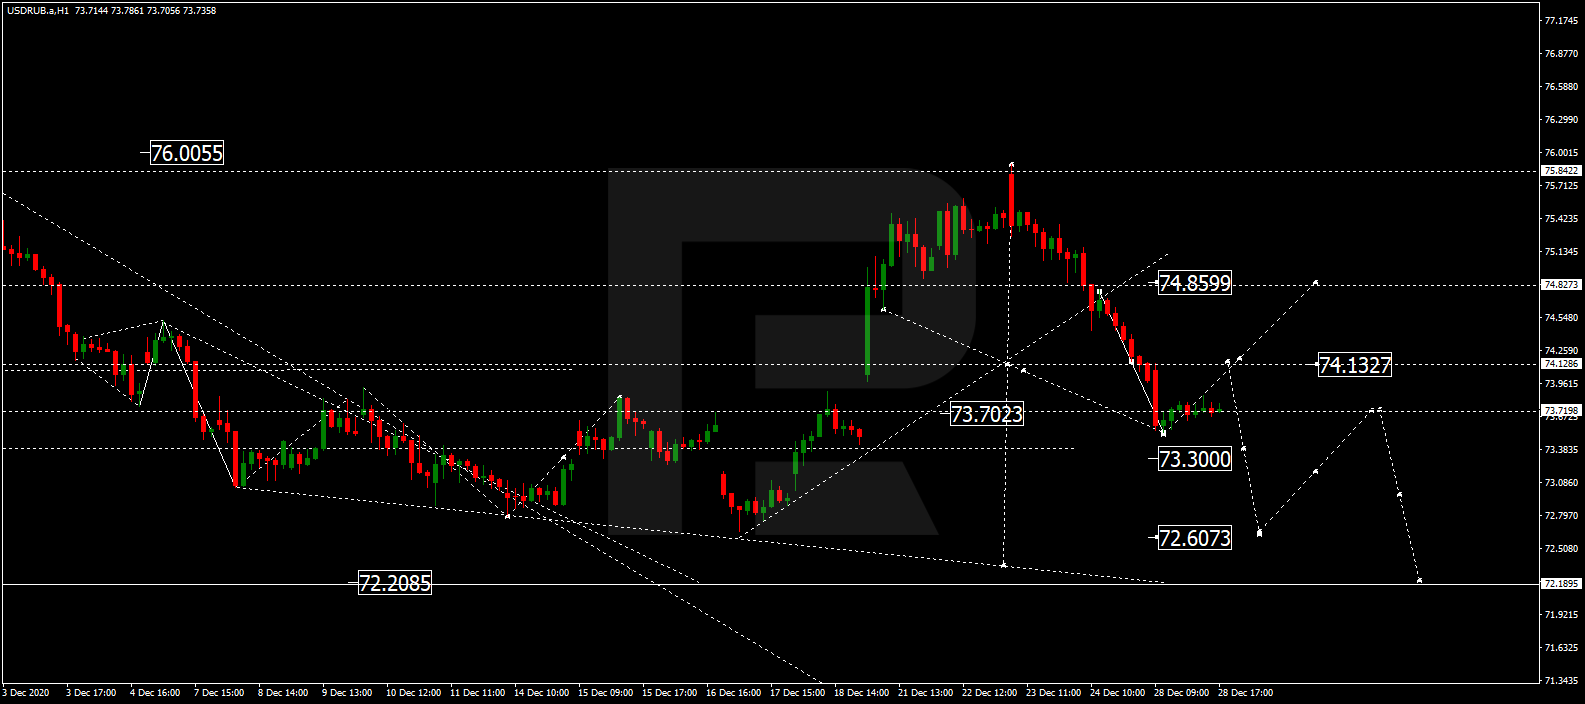
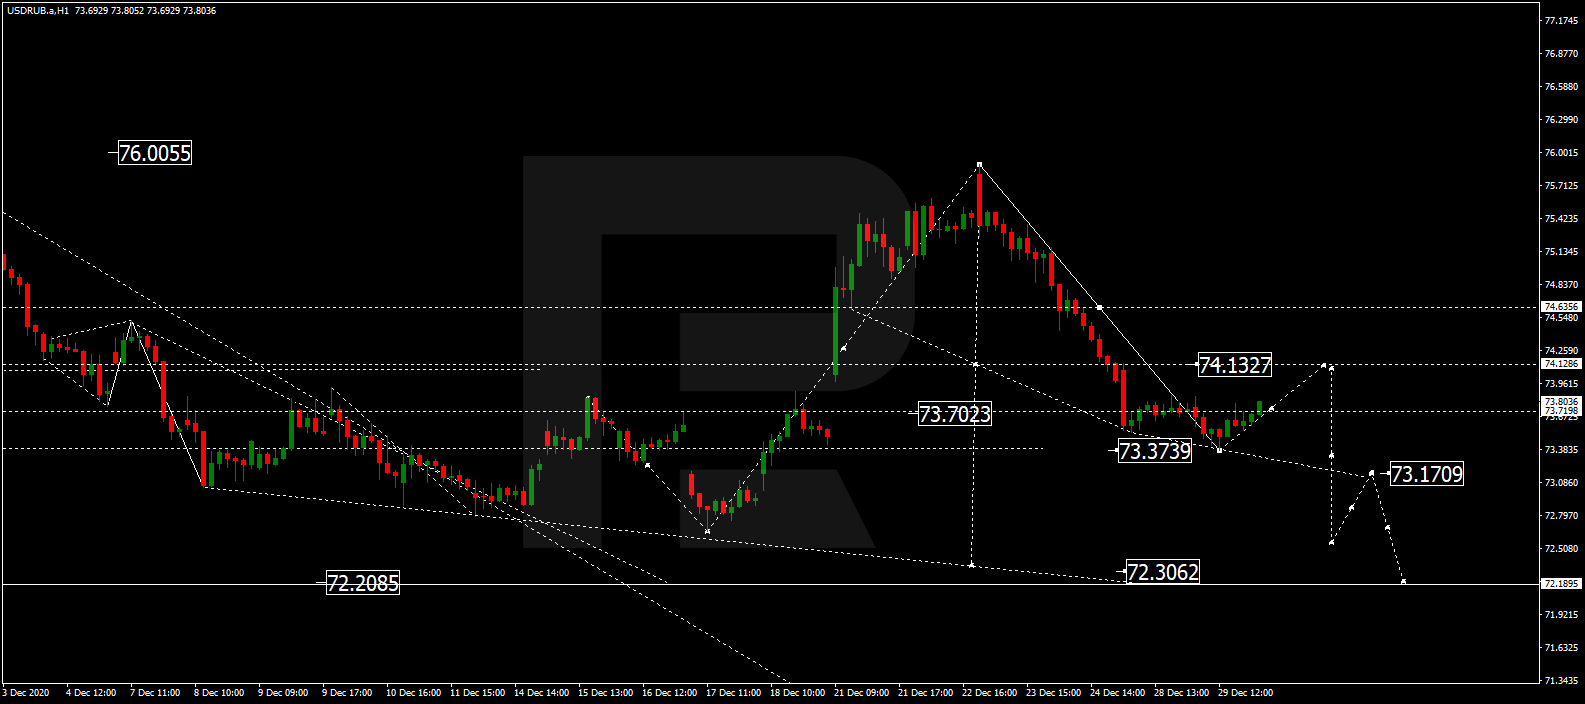
USDRUB, “US Dollar vs Russian Ruble”
USDRUB is still consolidating below 74.00. If later the price breaks this range to the downside, the market may resume trading downwards to reach 72.30 and then start another correction to return to 74.00.
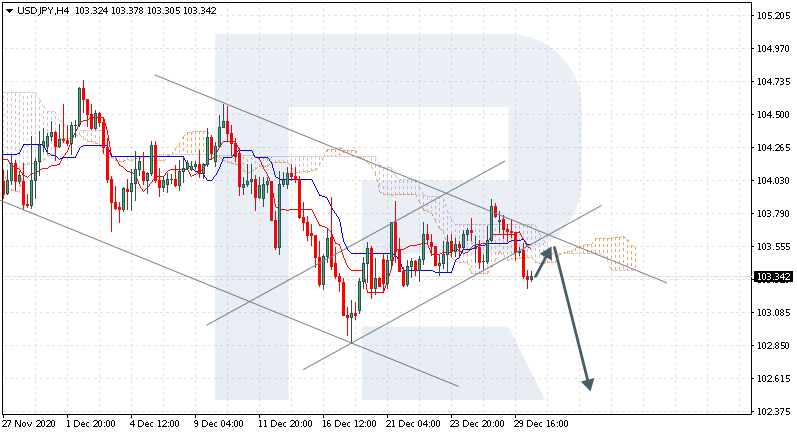
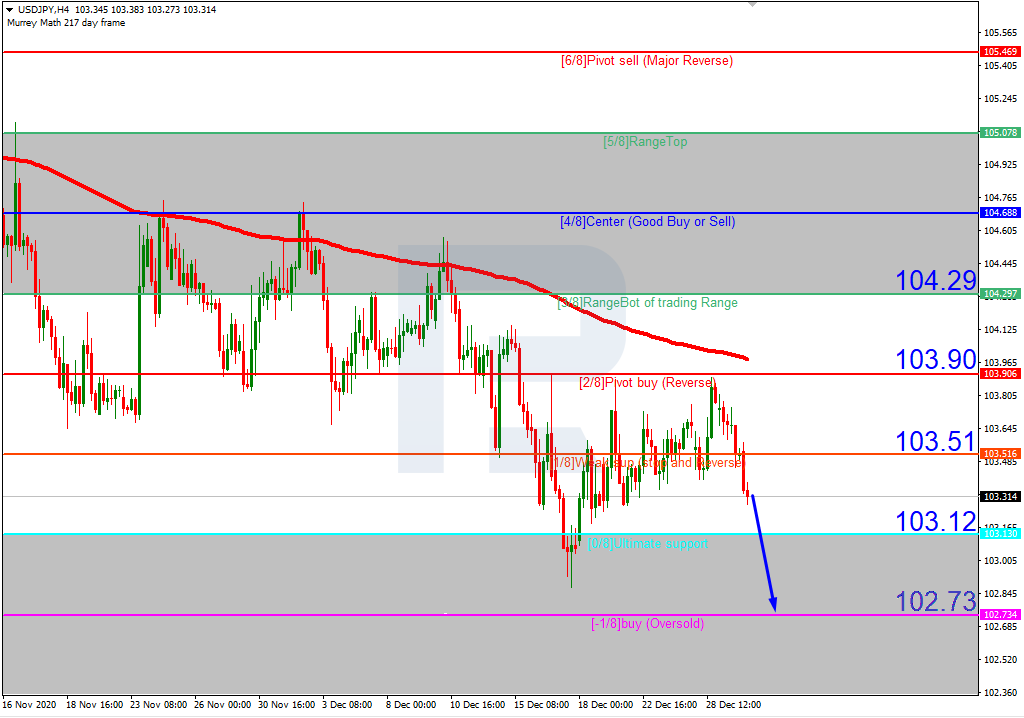
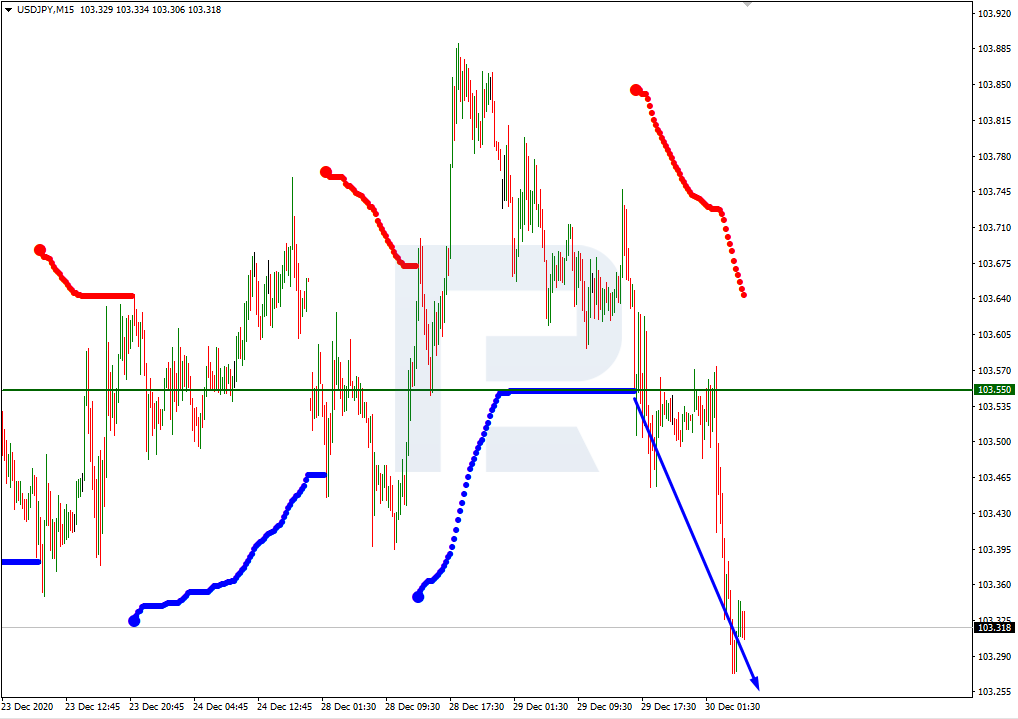
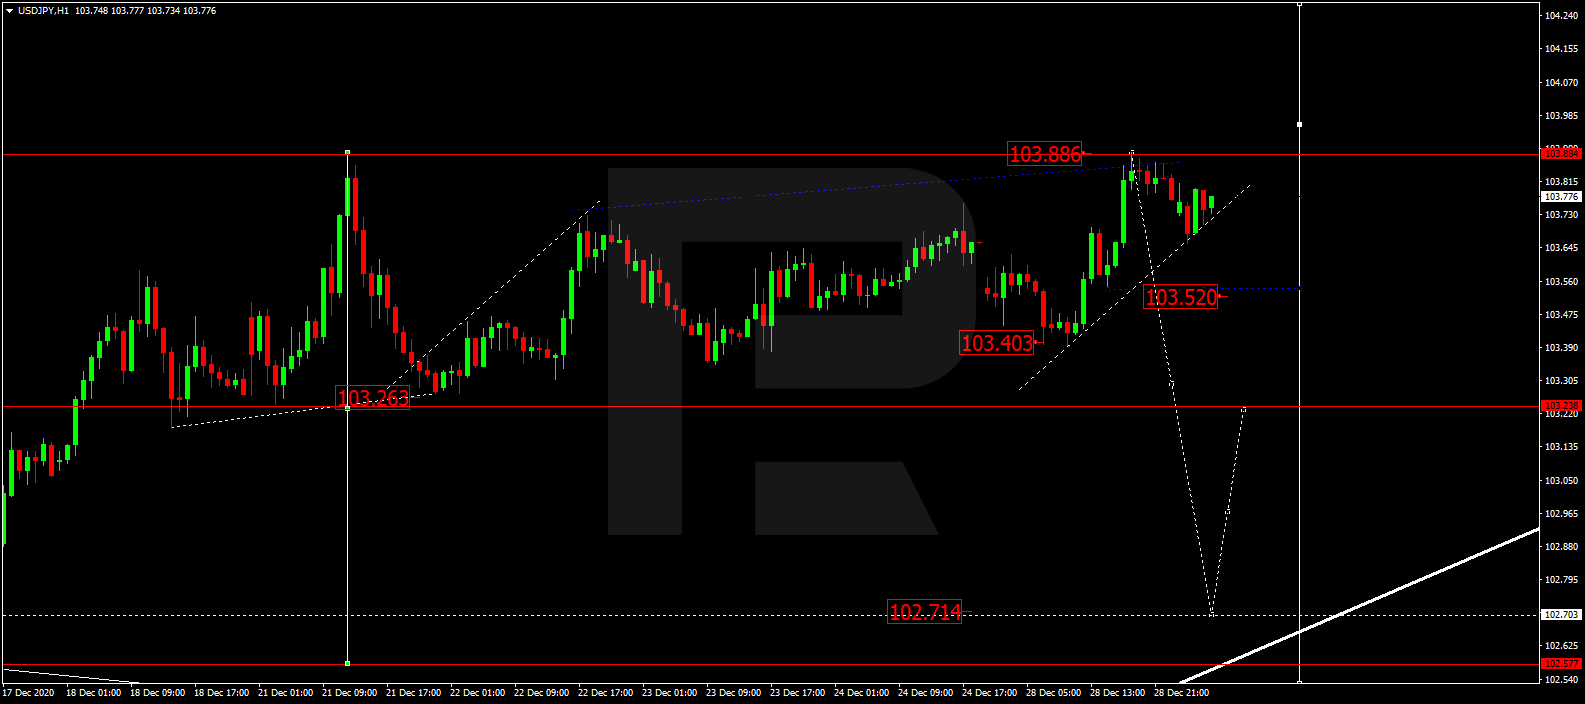
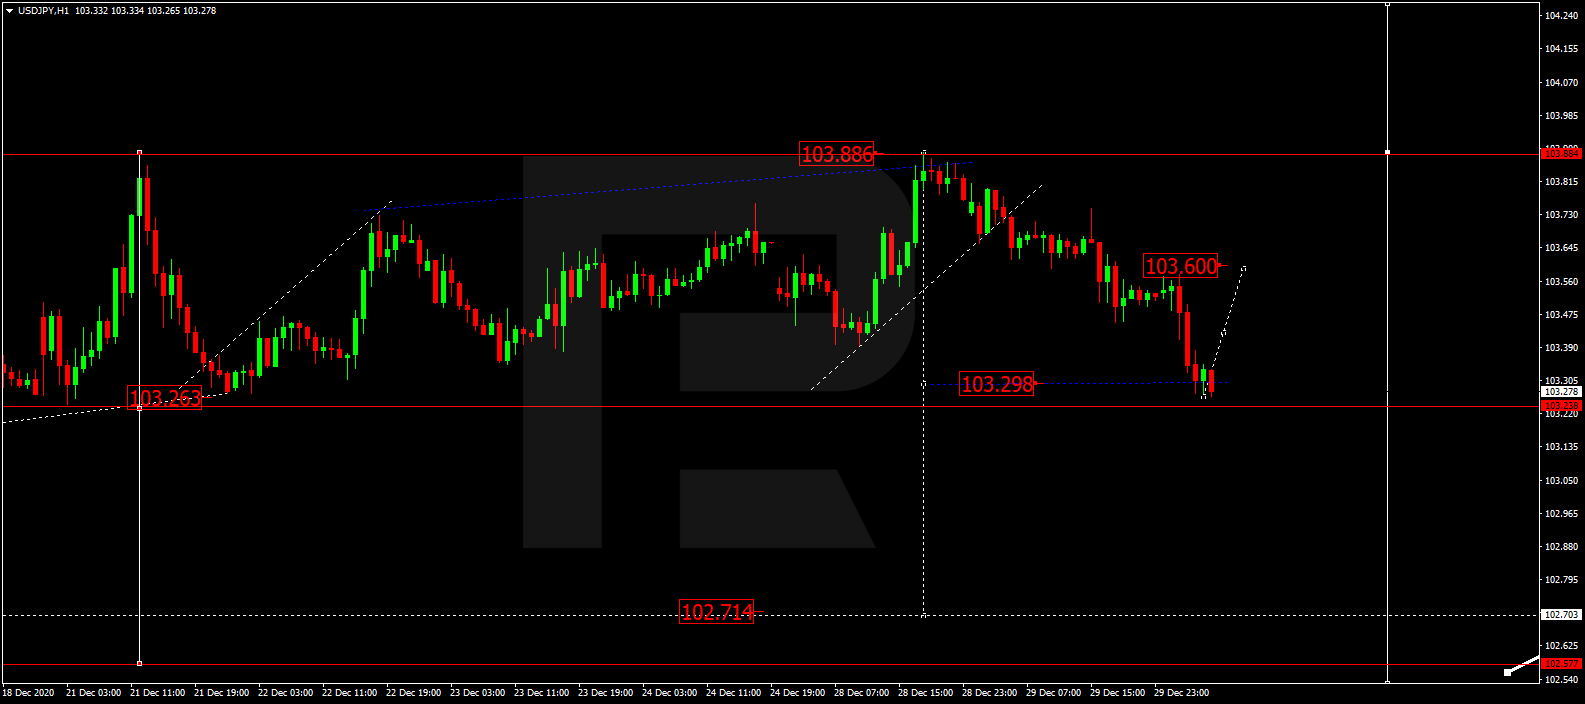
USDJPY, “US Dollar vs Japanese Yen”
After completing the descending wave at 103.30, USDJPY is consolidating around this level. If later the price breaks this range to the upside, the market may start another correction towards 103.60; if to the downside – resume trading downwards with the short-term target at 102.70.
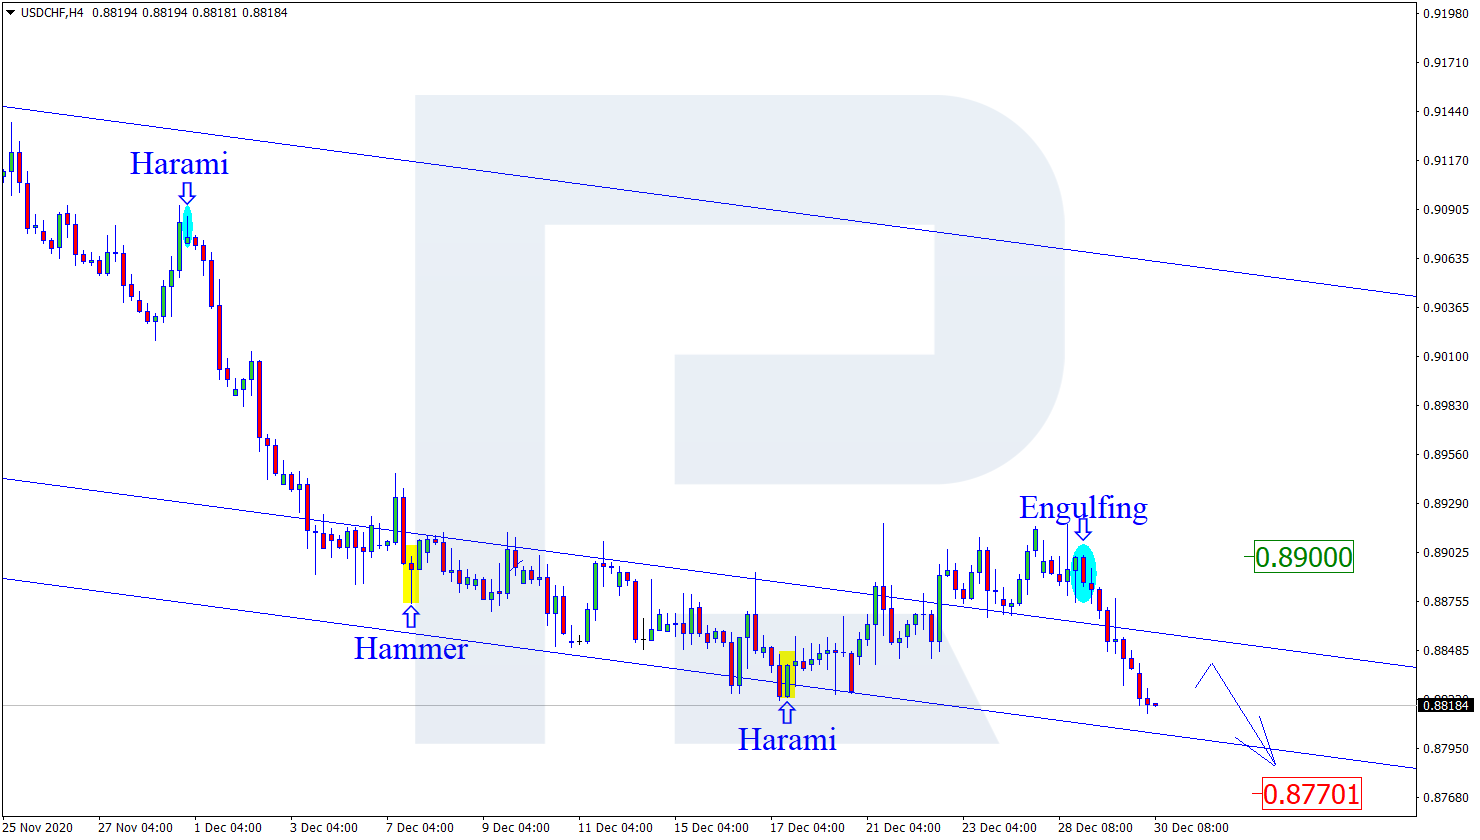
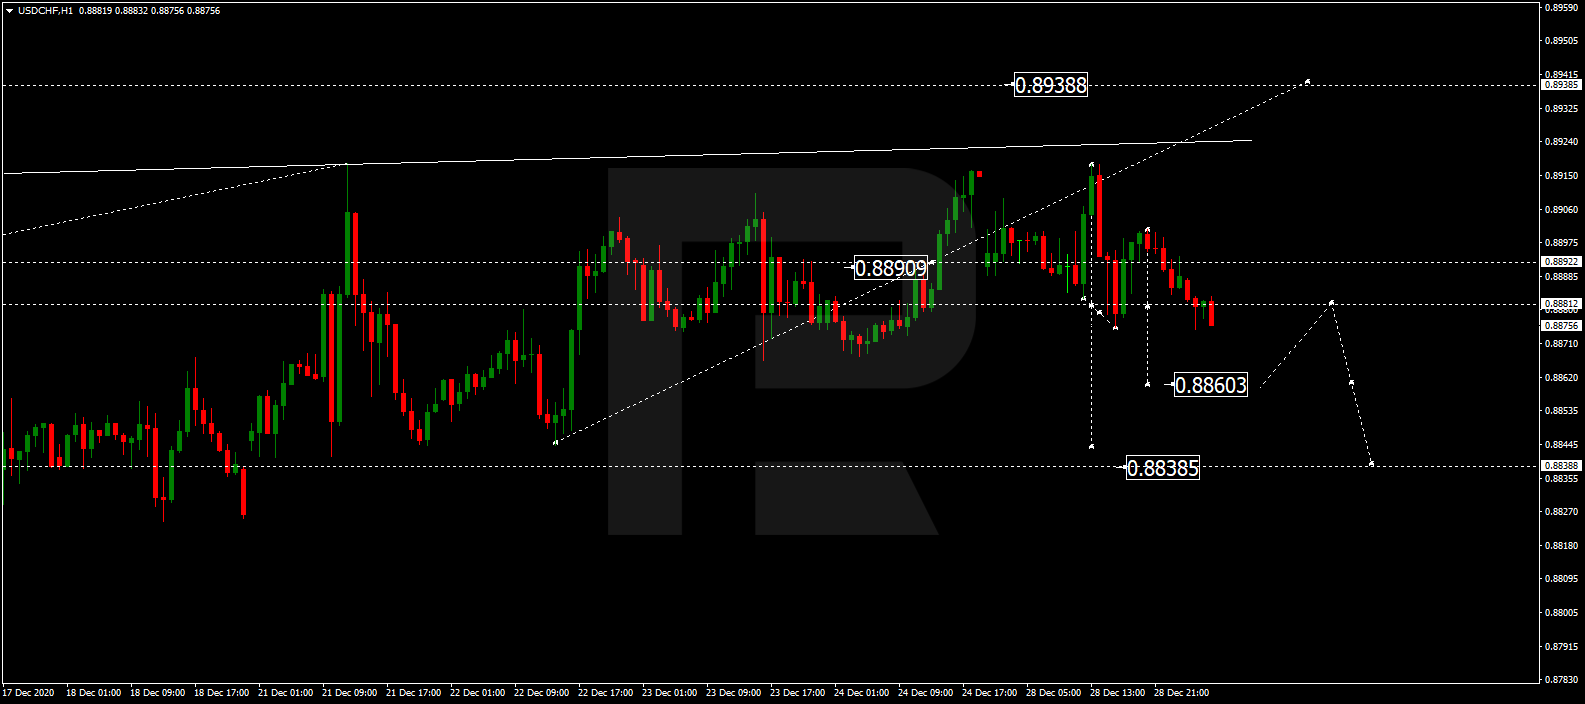
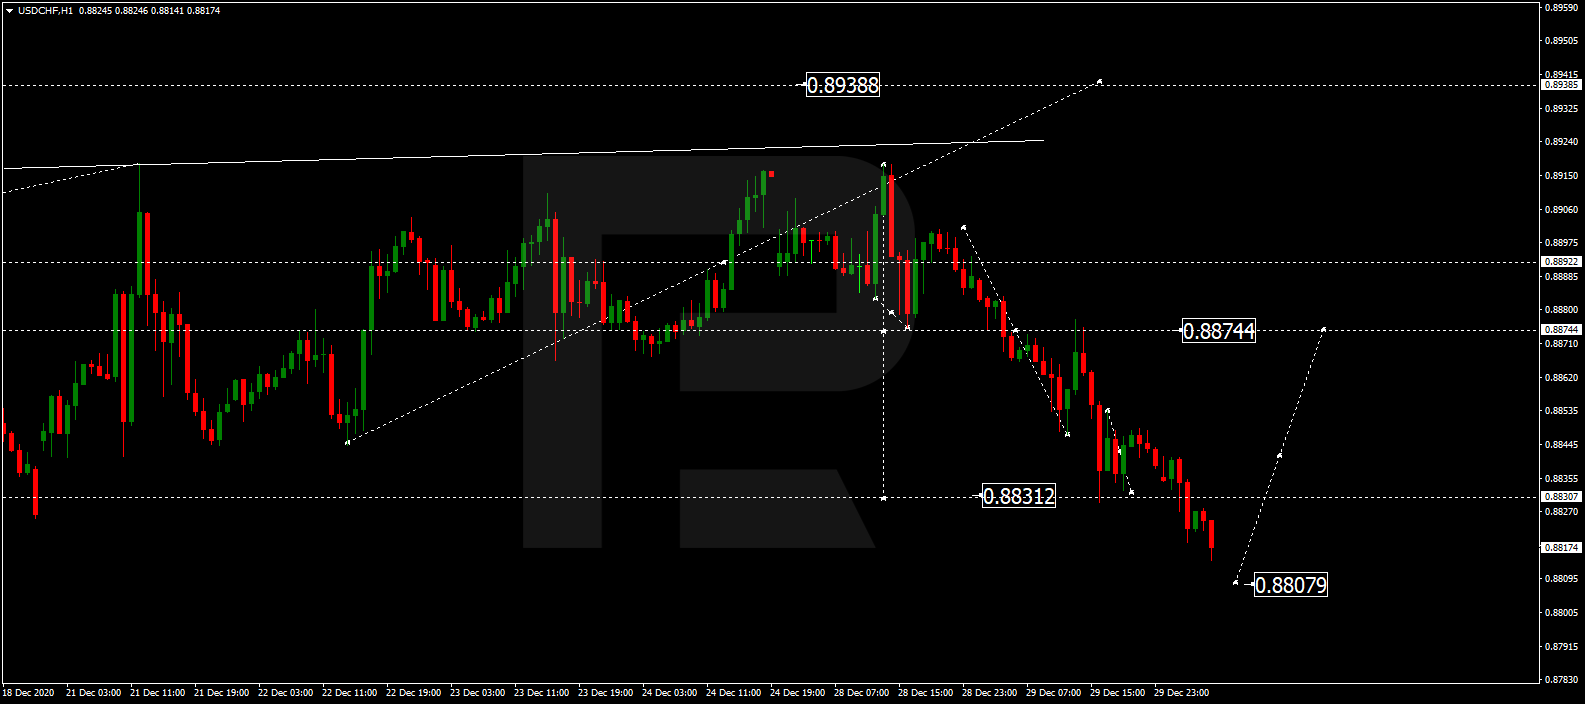
USDCHF, “US Dollar vs Swiss Franc”
After finishing the descending wave at 0.8830, USDCHF is forming a new consolidation range around this level. If later the price breaks this range to the upside, the market may start another growth with the target at 0.8874; if to the downside – resume trading downwards to expand the range towards 0.8808.
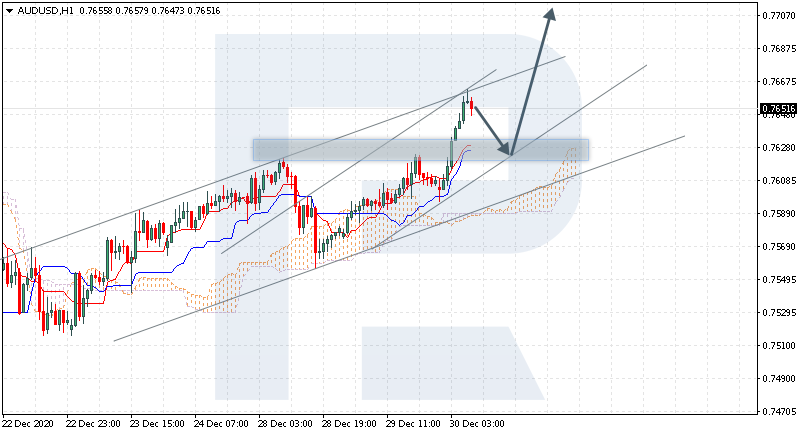
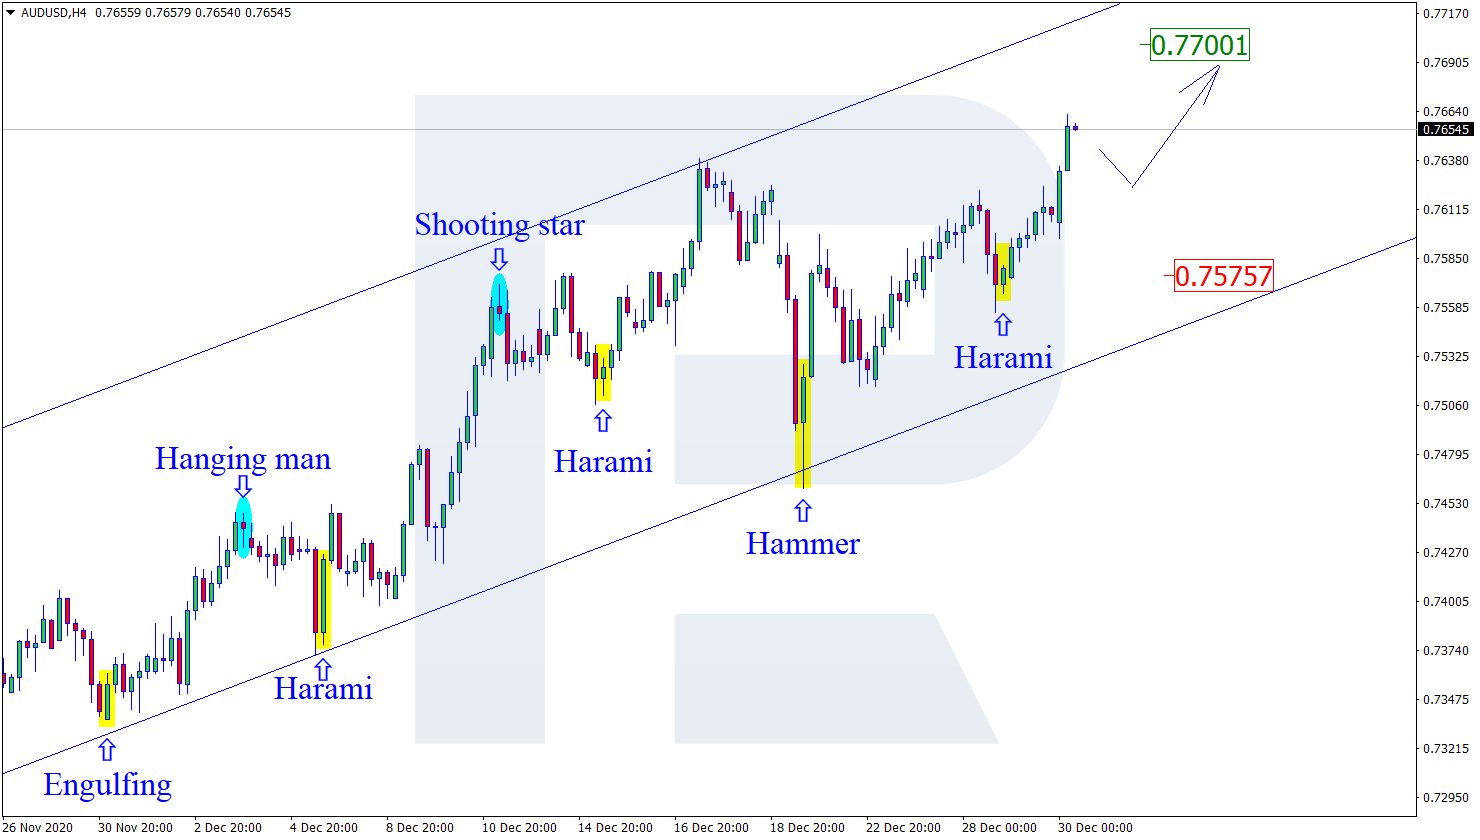
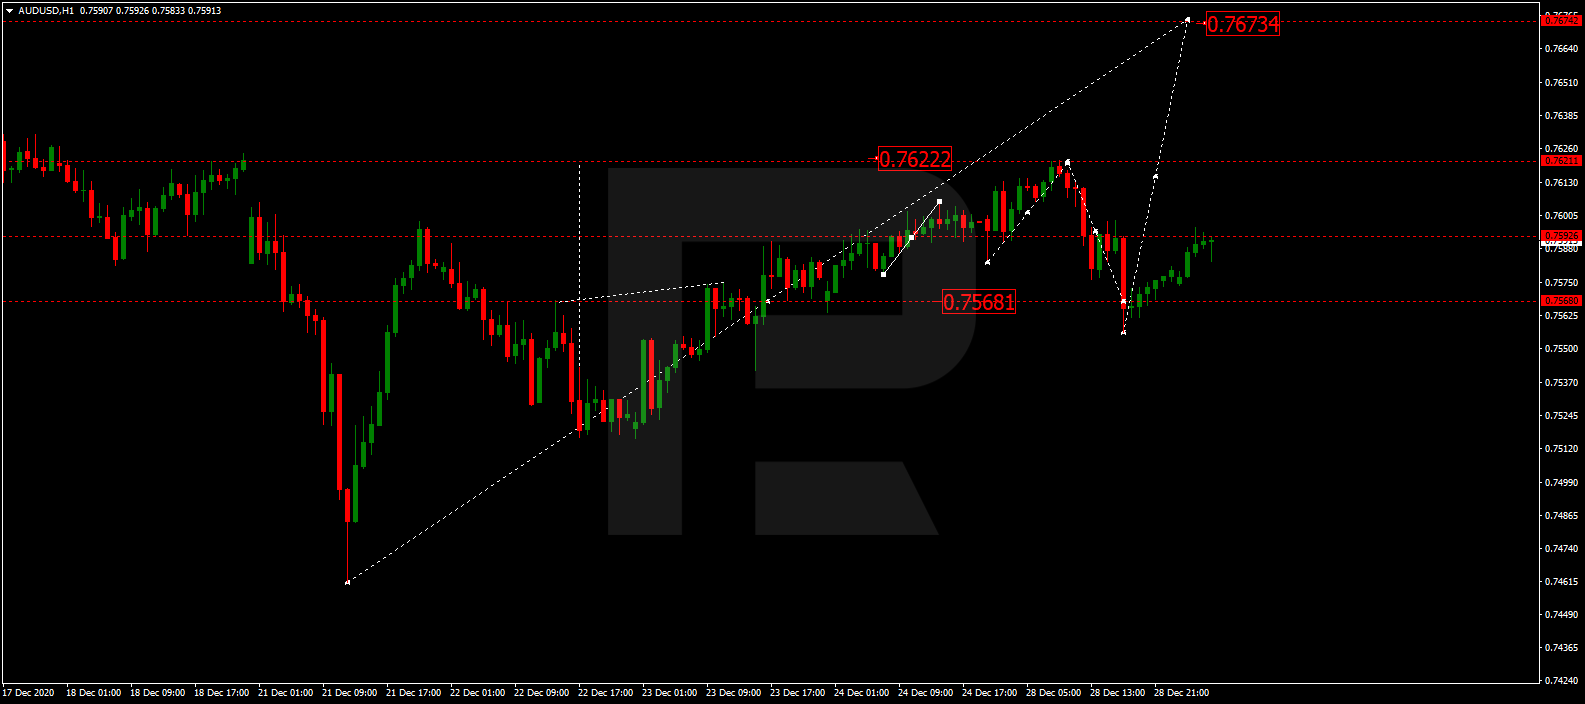
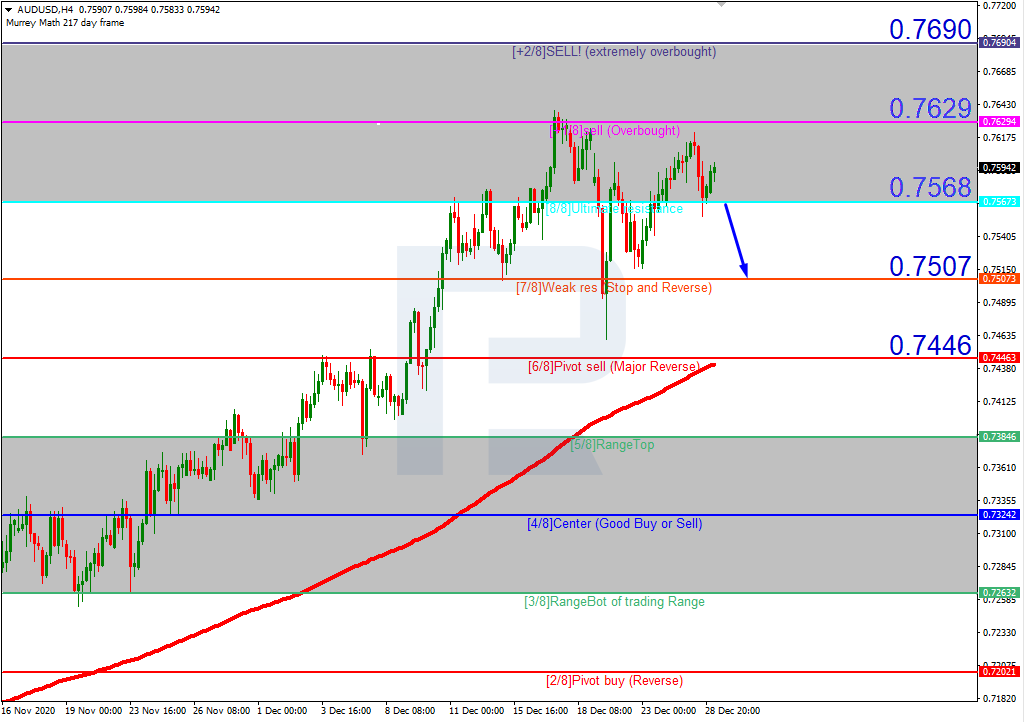
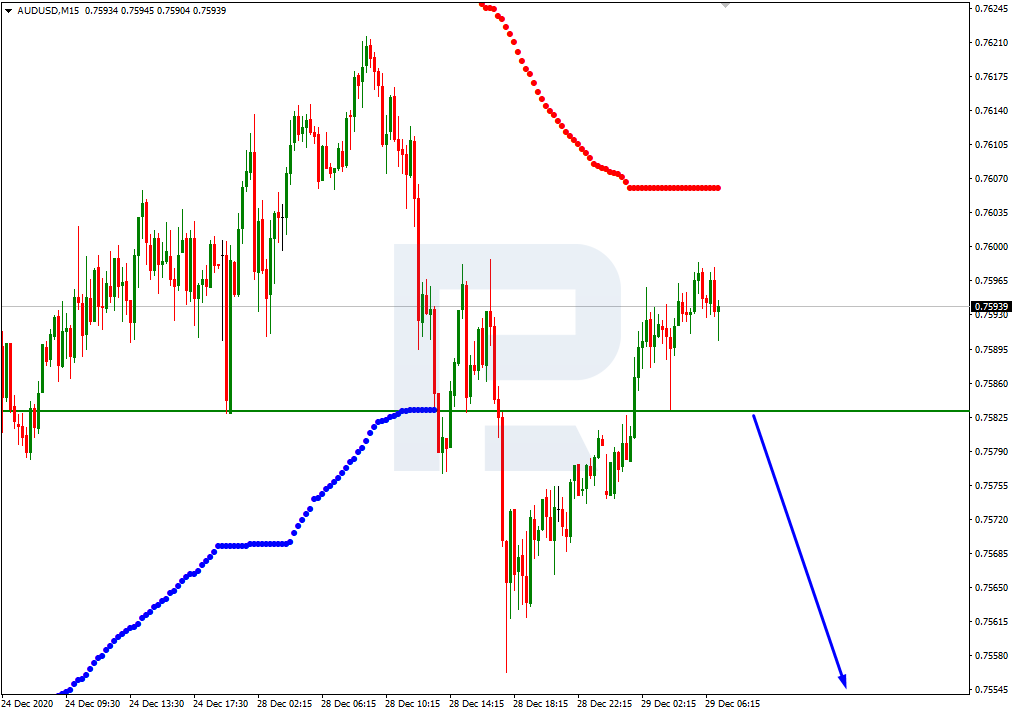
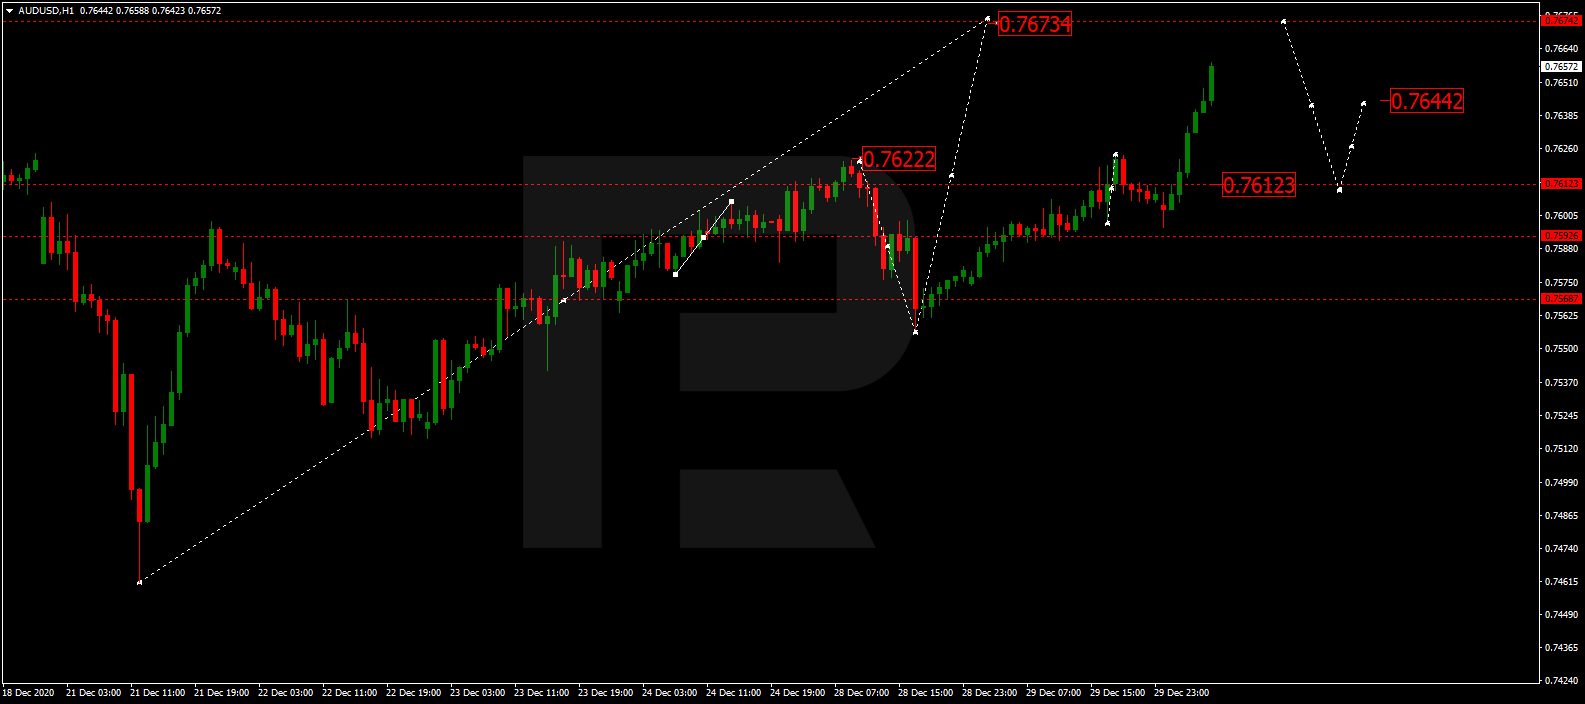
AUDUSD, “Australian Dollar vs US Dollar”
After finishing the ascending wave at 0.7612 and then forming a new consolidation range around this level, AUDUSD has broken it to the upside; right now, it is still growing towards 0.7673. Later, the market may form a new descending structure with the target at 0.7612.
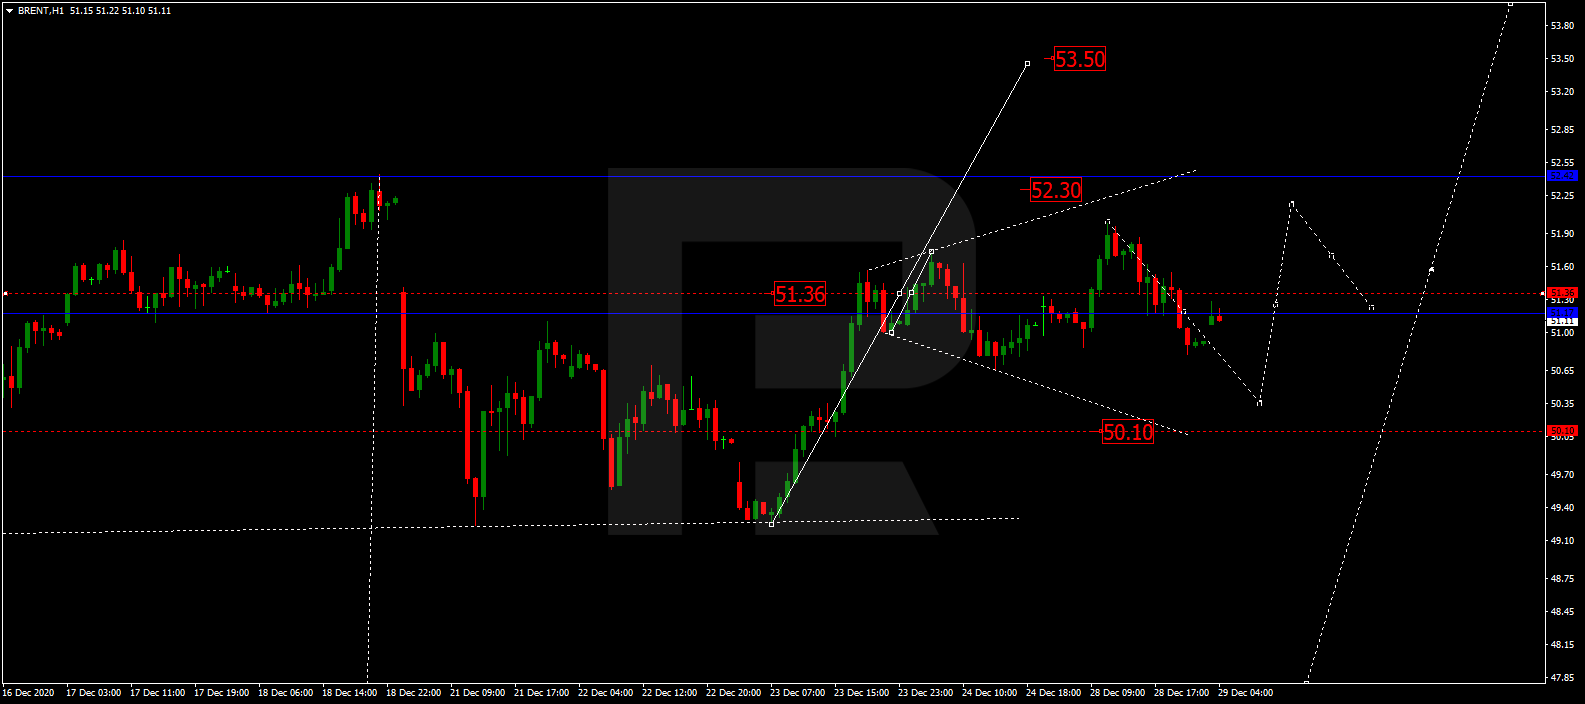
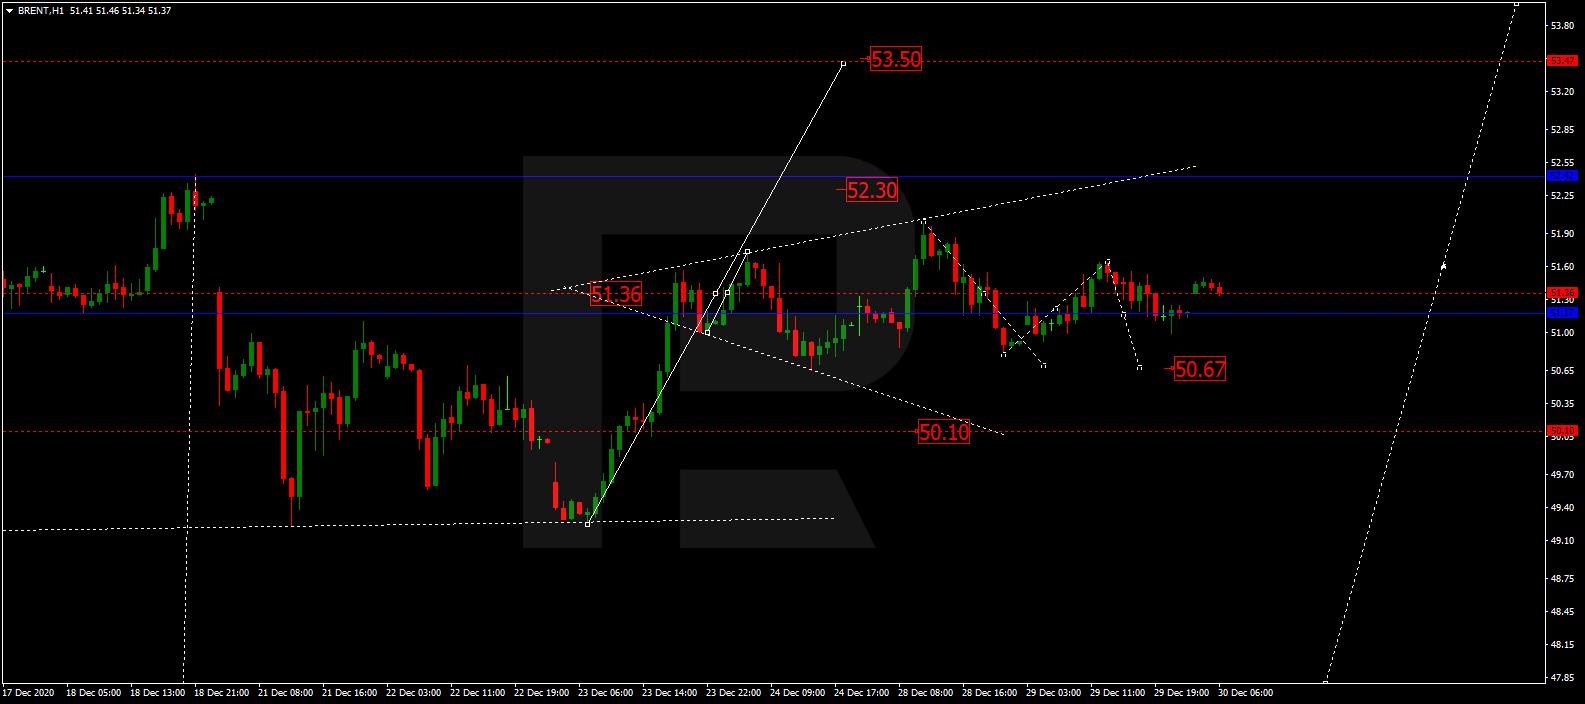
BRENT
Brent is still forming a consolidation range around 51.36 without any particular direction. Possibly, the asset may expand the range down to 50.70 and then grow to reach 52.30. After that, the instrument may fall to break 51.36 and then continue the correction towards 50.10. Later, the market may resume trading upwards with the target at 53.50.
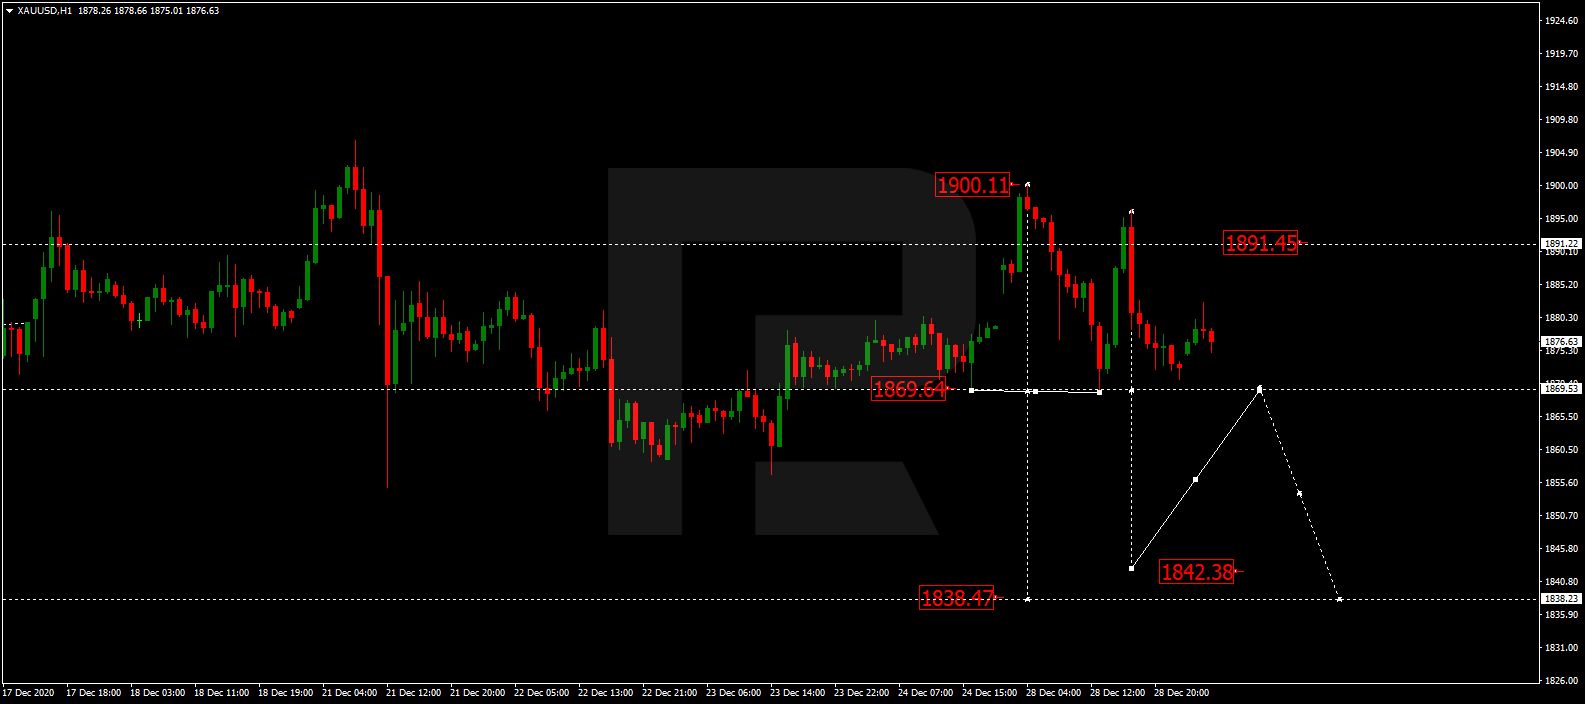
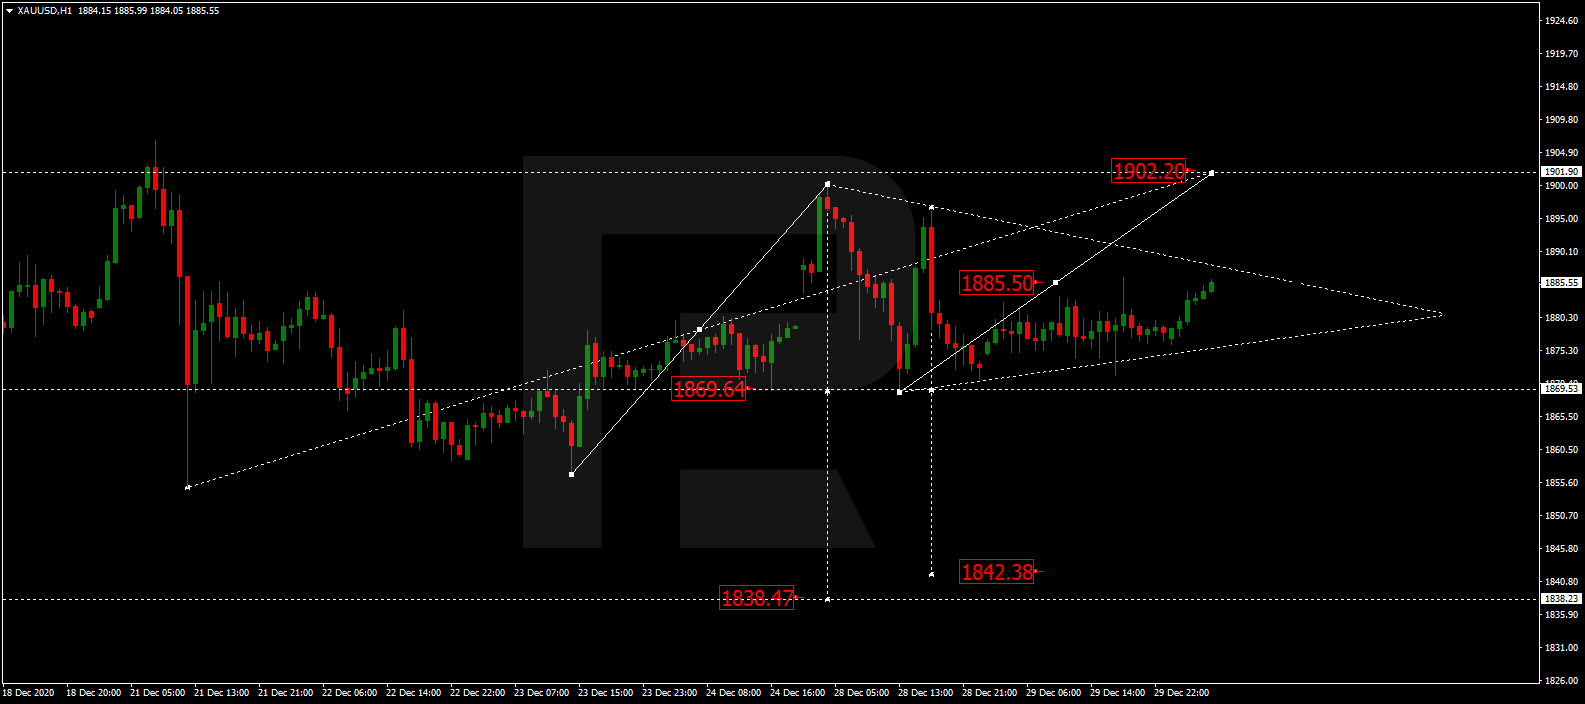
XAUUSD, “Gold vs US Dollar”
Gold is still consolidating around 1885.50. Possibly, today the metal may fall to reach 1869.50. If later the price breaks this range to the downside, the market may resume falling towards 1842.40; if to the upside – start a new growth with the target at 1900.00.
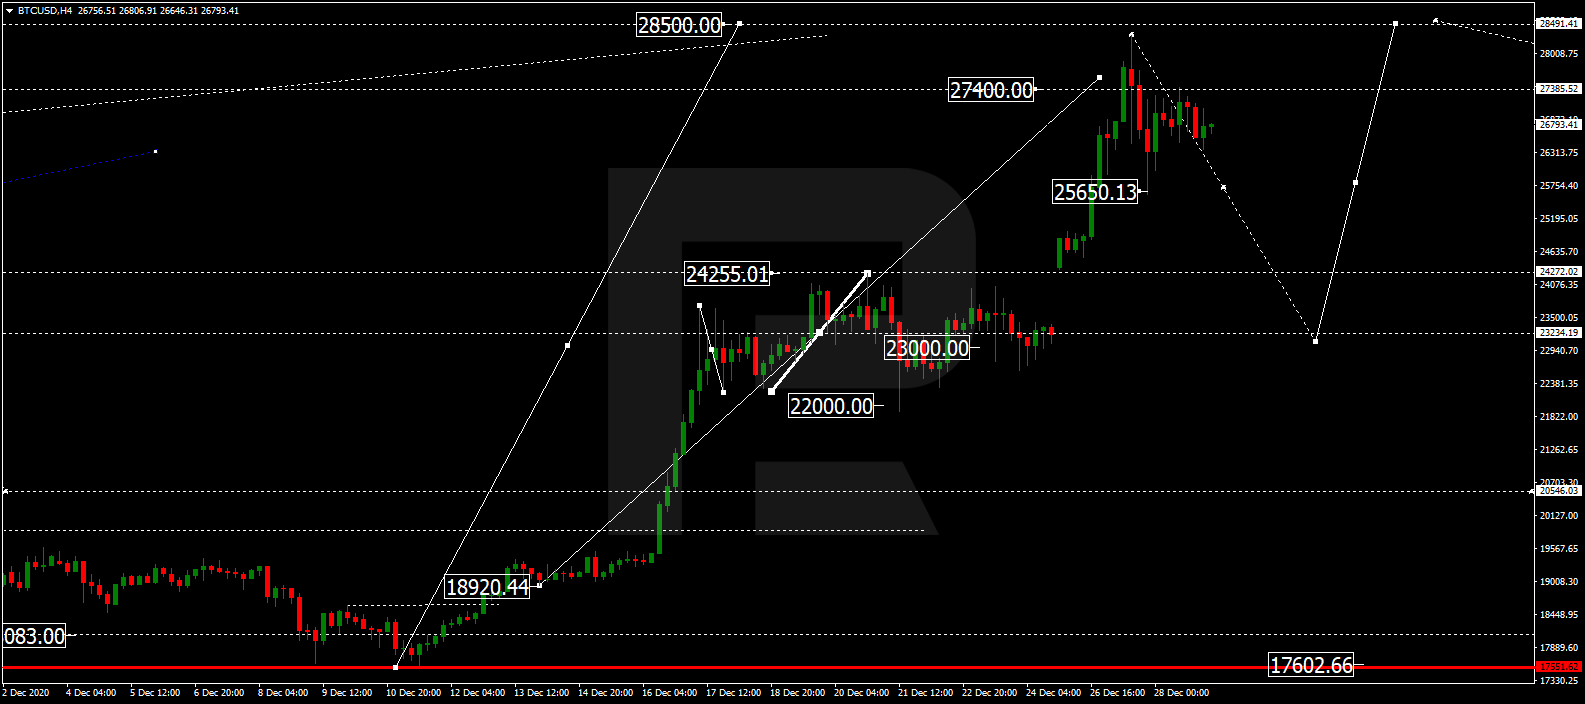
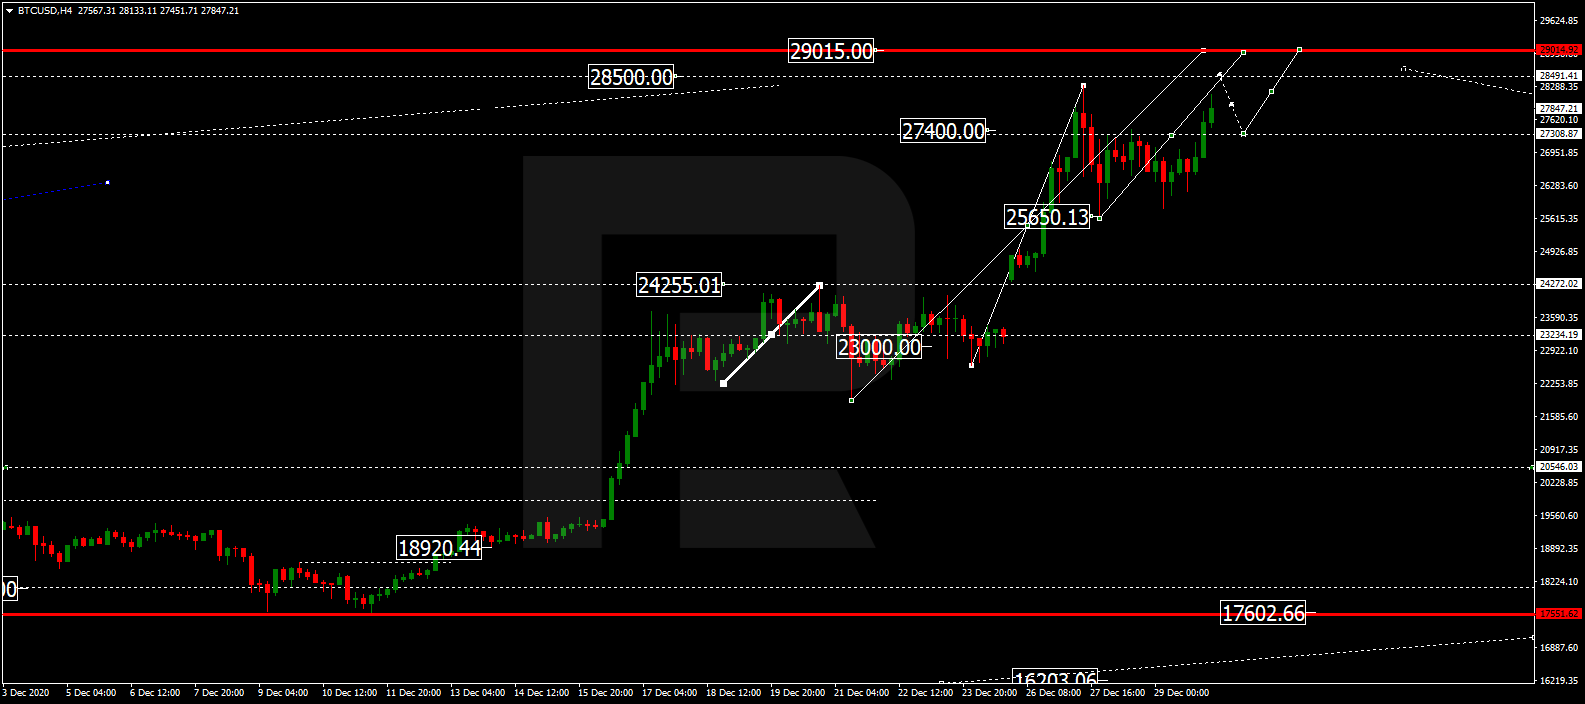
BTCUSD, “Bitcoin vs US Dollar”
BTCUSD is still consolidating above 25650.00. Possibly, the asset may try to break the range to the upside at 27400.00 and then continue trading upwards to reach 29015.00. Later, the market may start a new correction with the target at 23650.
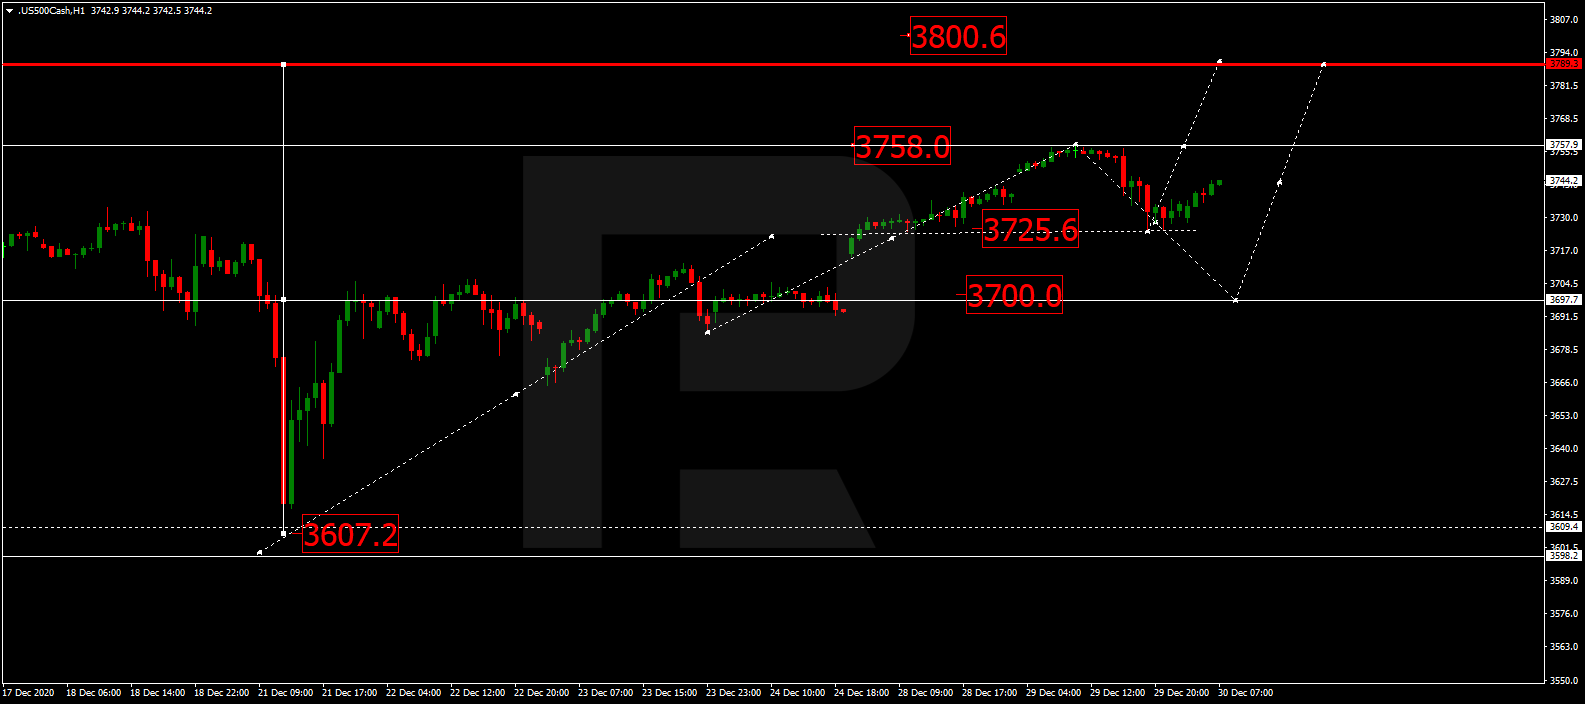
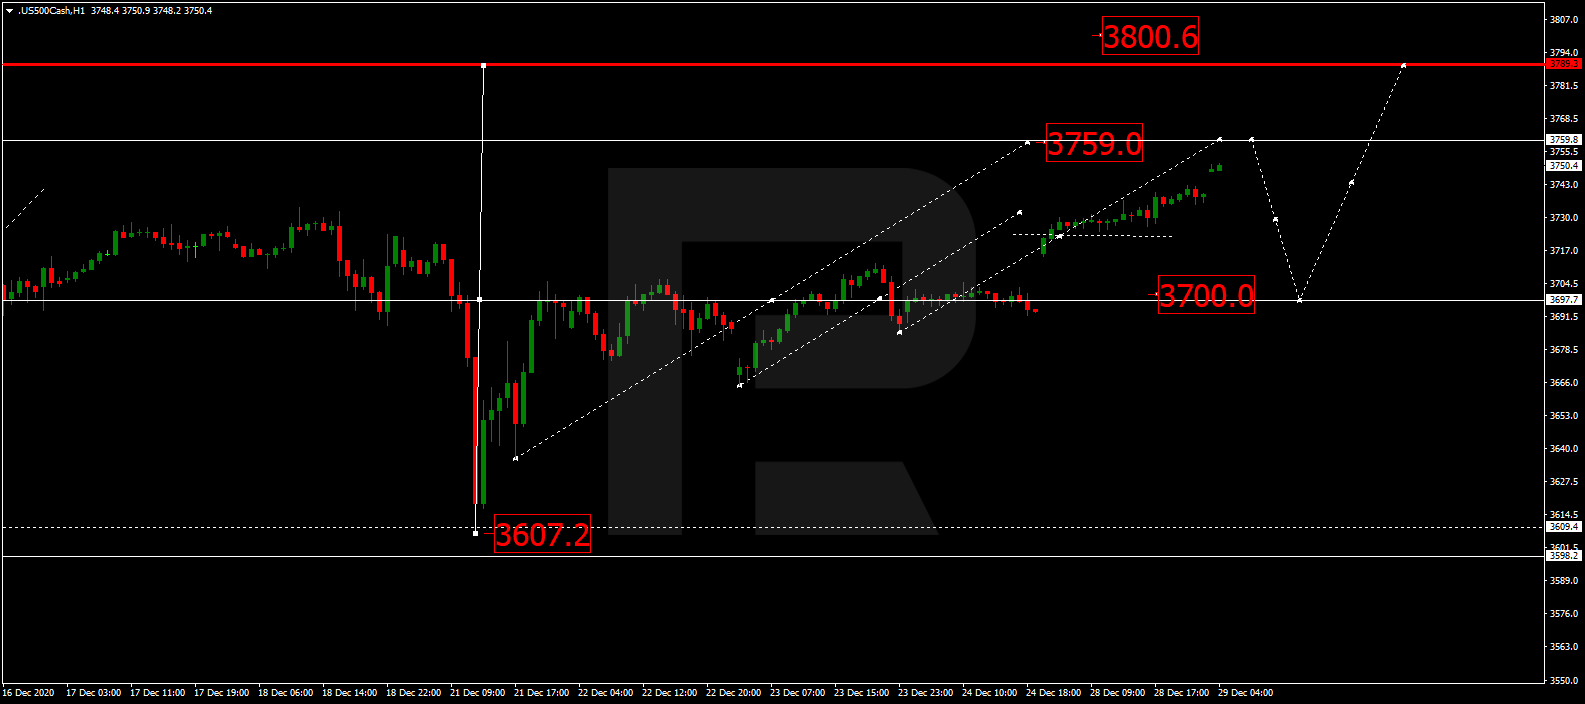
S&P 500
After completing the ascending wave at 3758.0 along with the correction towards 3725.6, the S&P index is still growing return to 3758.0. Later, the market may break the latter level and continue trading upwards to reach 3800.0. After that, the instrument may form a new descending structure with the target at 3700.0.