Forex Technical Analysis & Forecast 26.05.2020
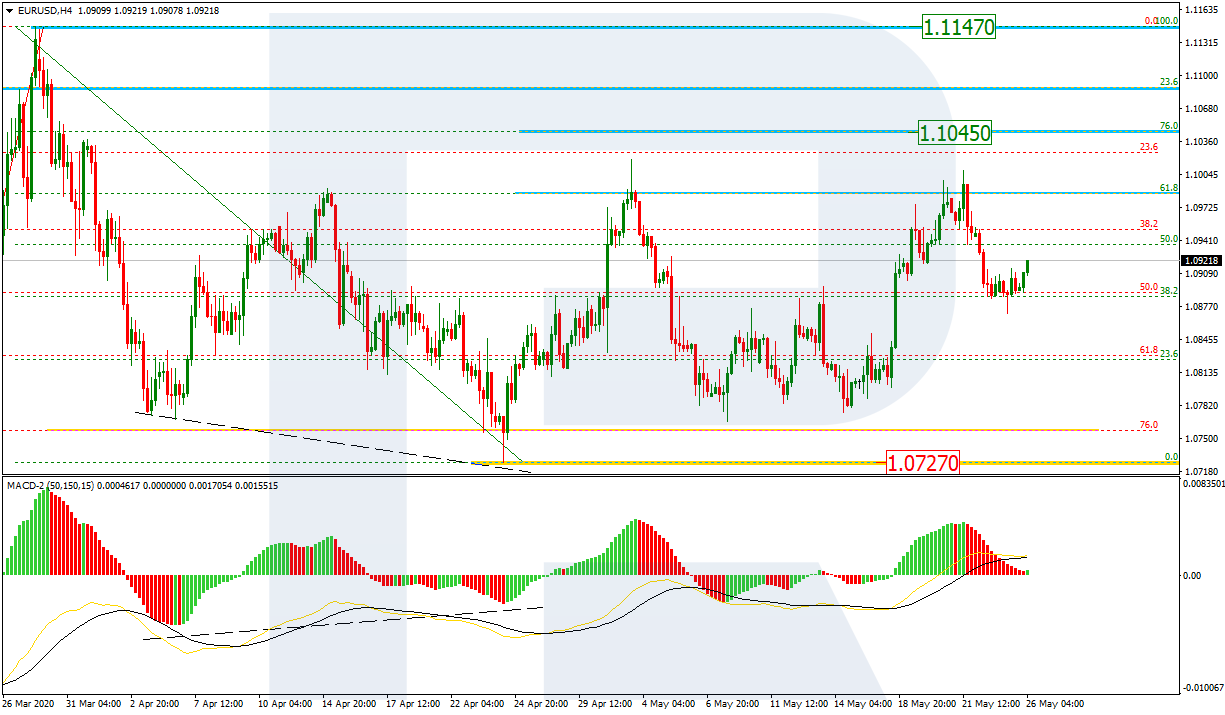
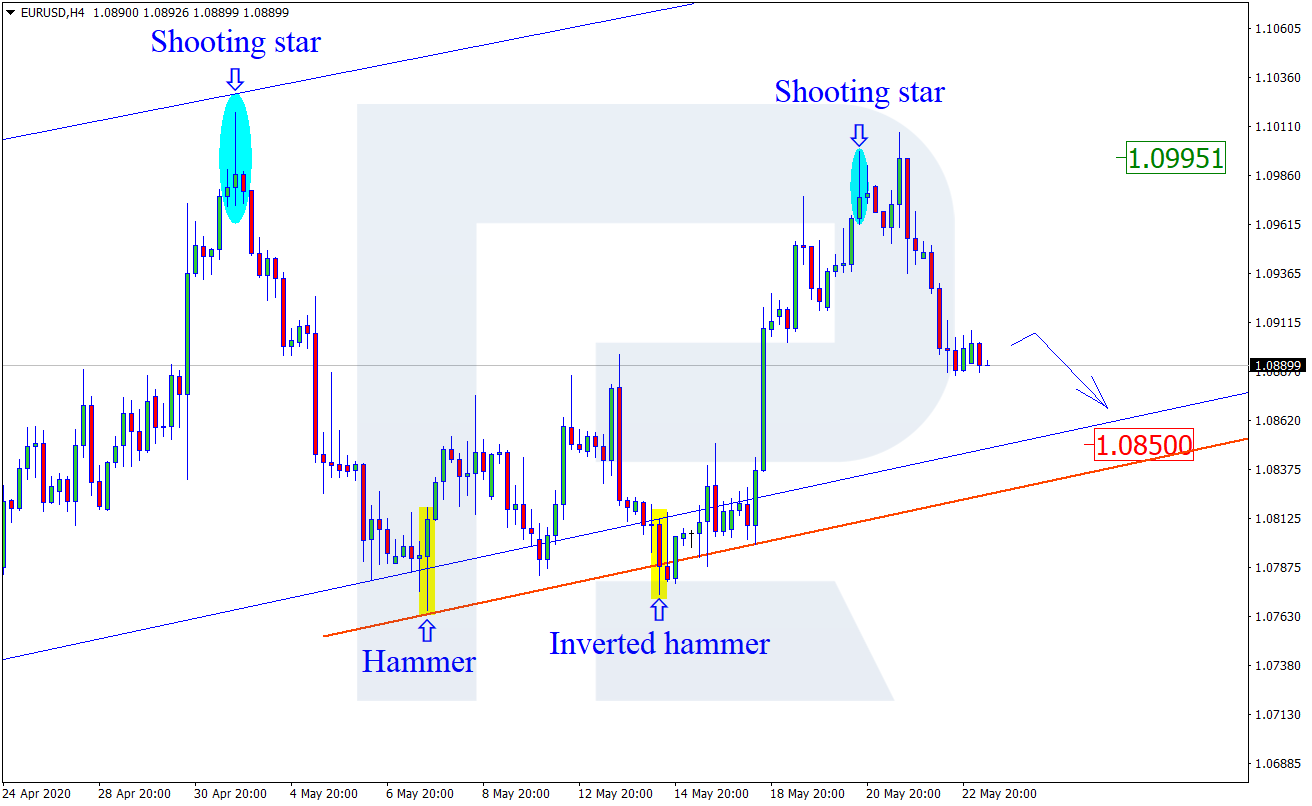
EURUSD, “Euro vs US Dollar”
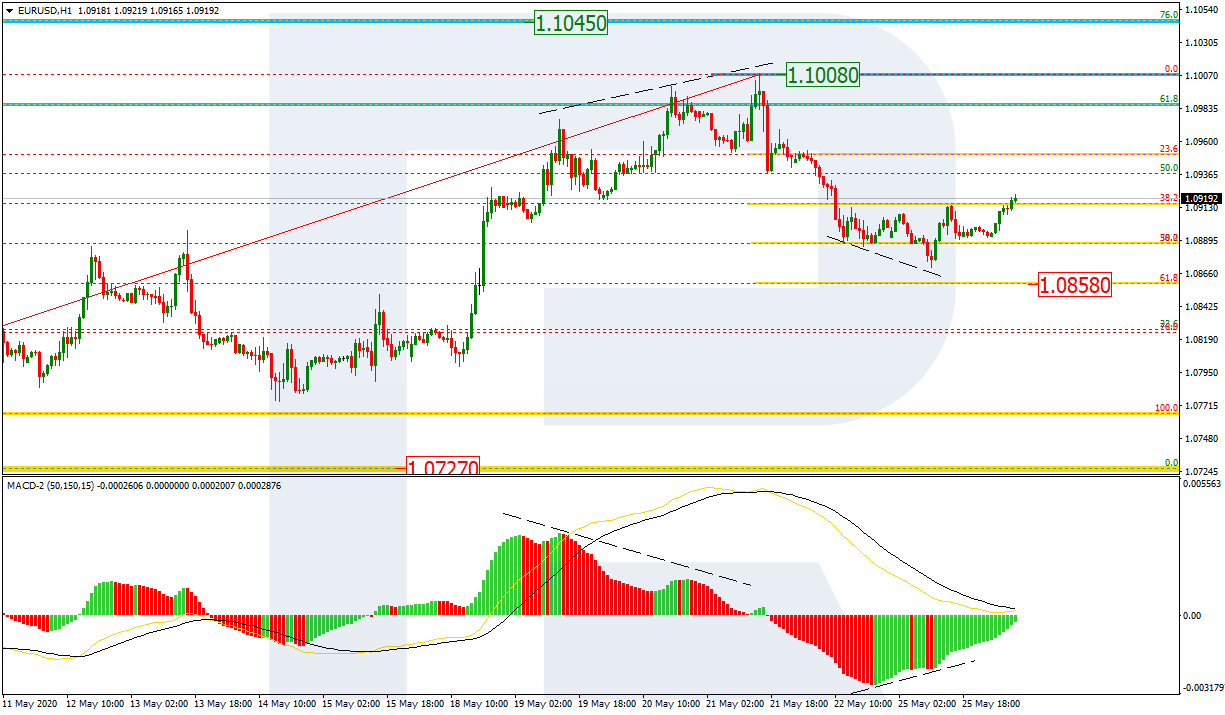
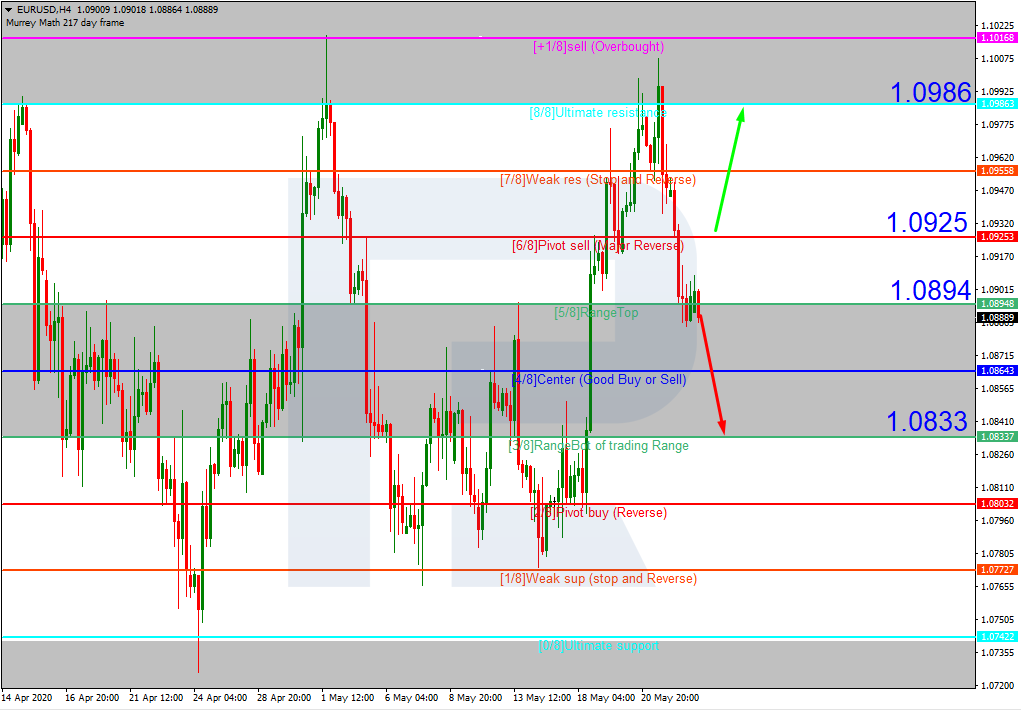
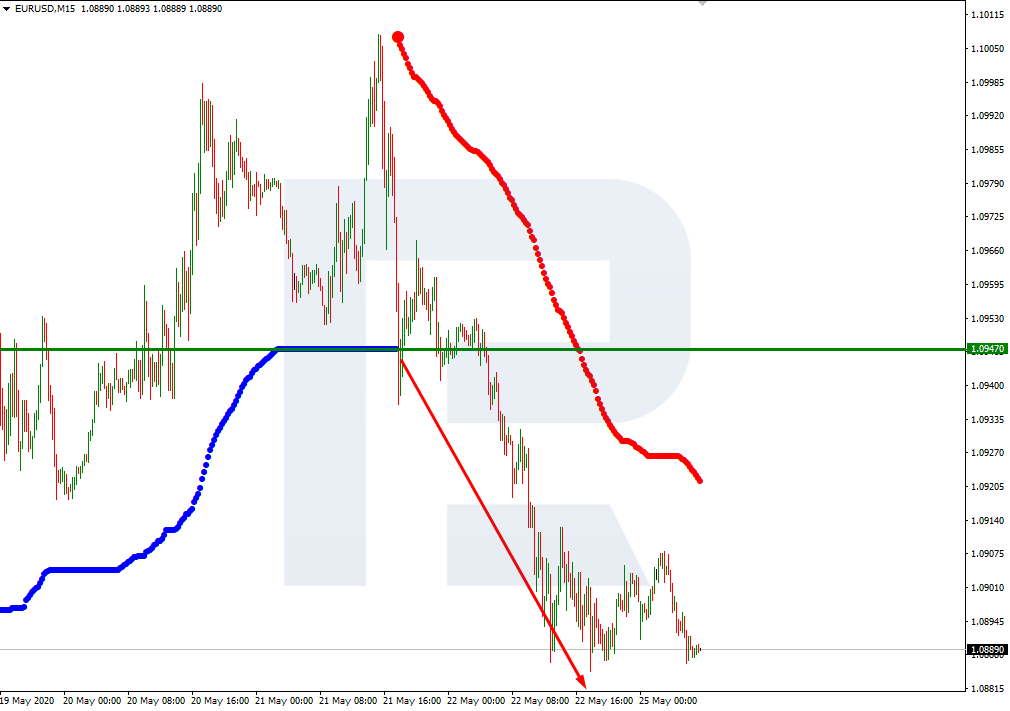
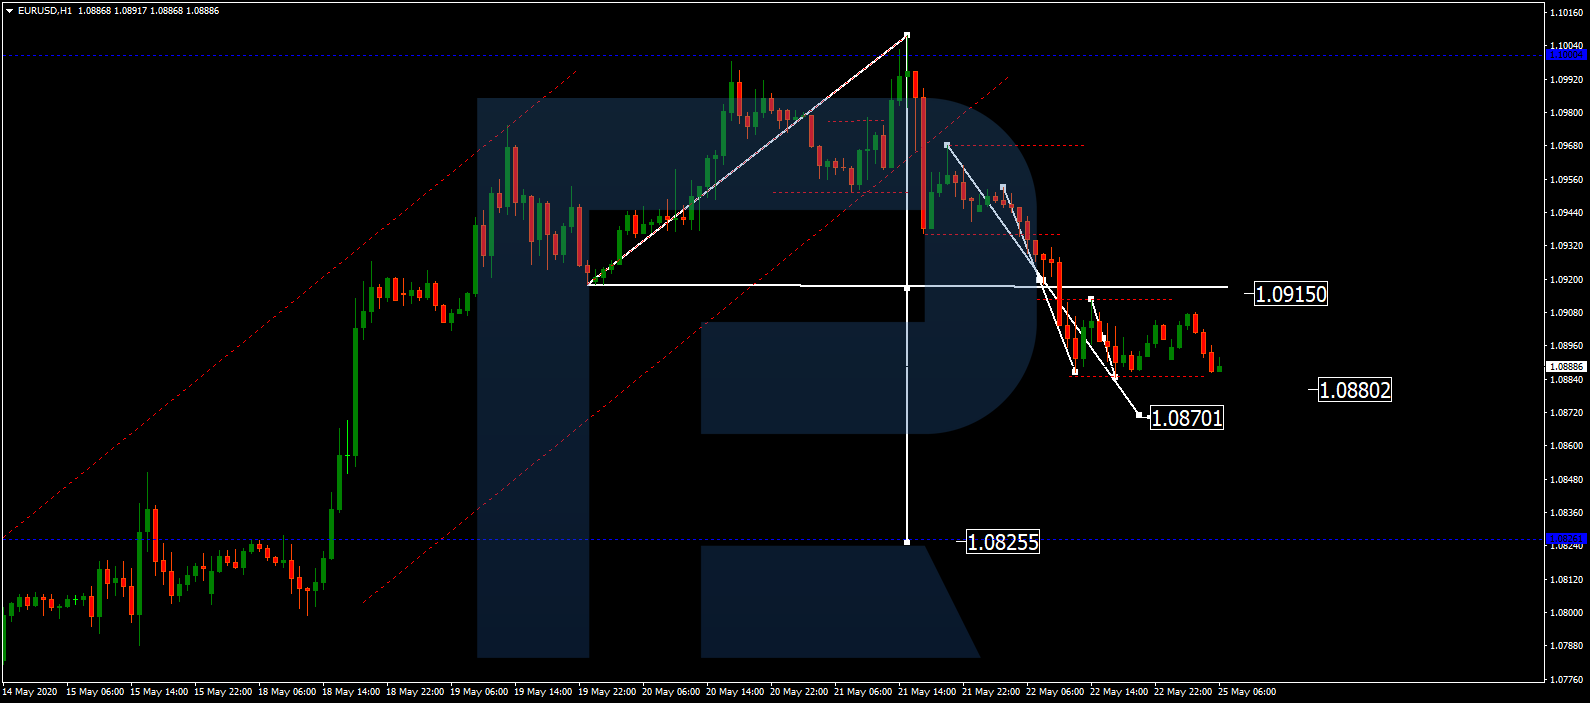
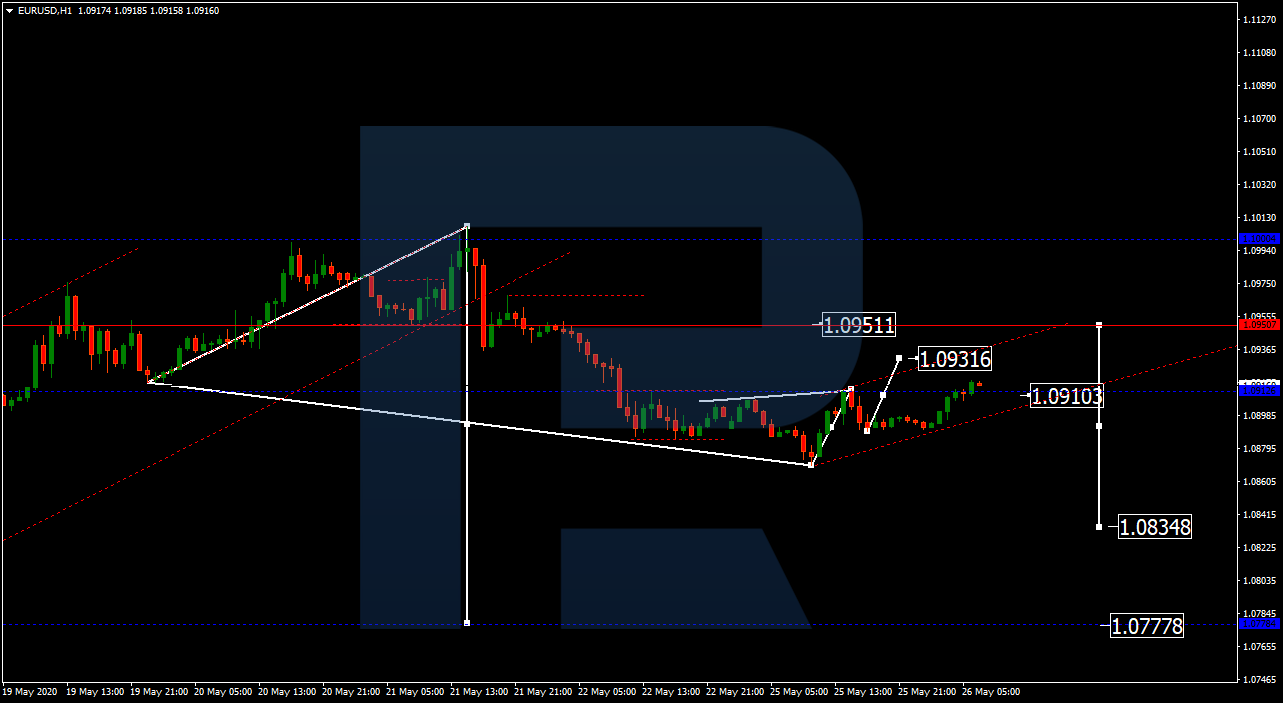
After forming a new consolidation range around 1.0900, EURUSD is trying to break it to the upside. Possibly, the pair may trade upwards to reach 1.0932 and then fall towards 1.0910. Later, the market may form one more ascending structure to complete the correction at 1.0951 and then resume moving inside the downtrend with the target at 1.0834.

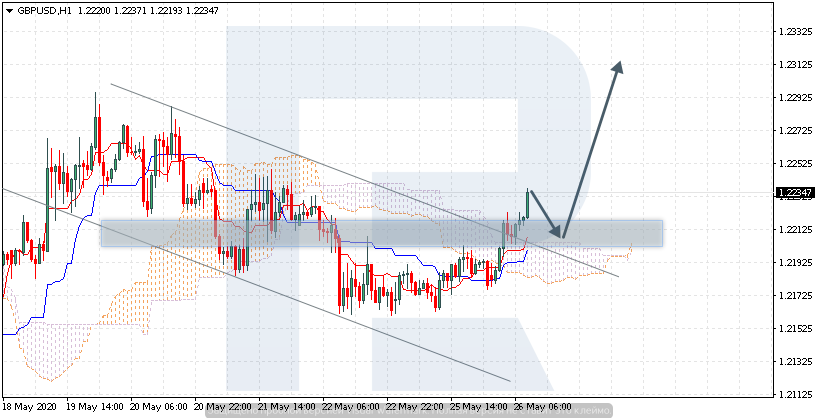
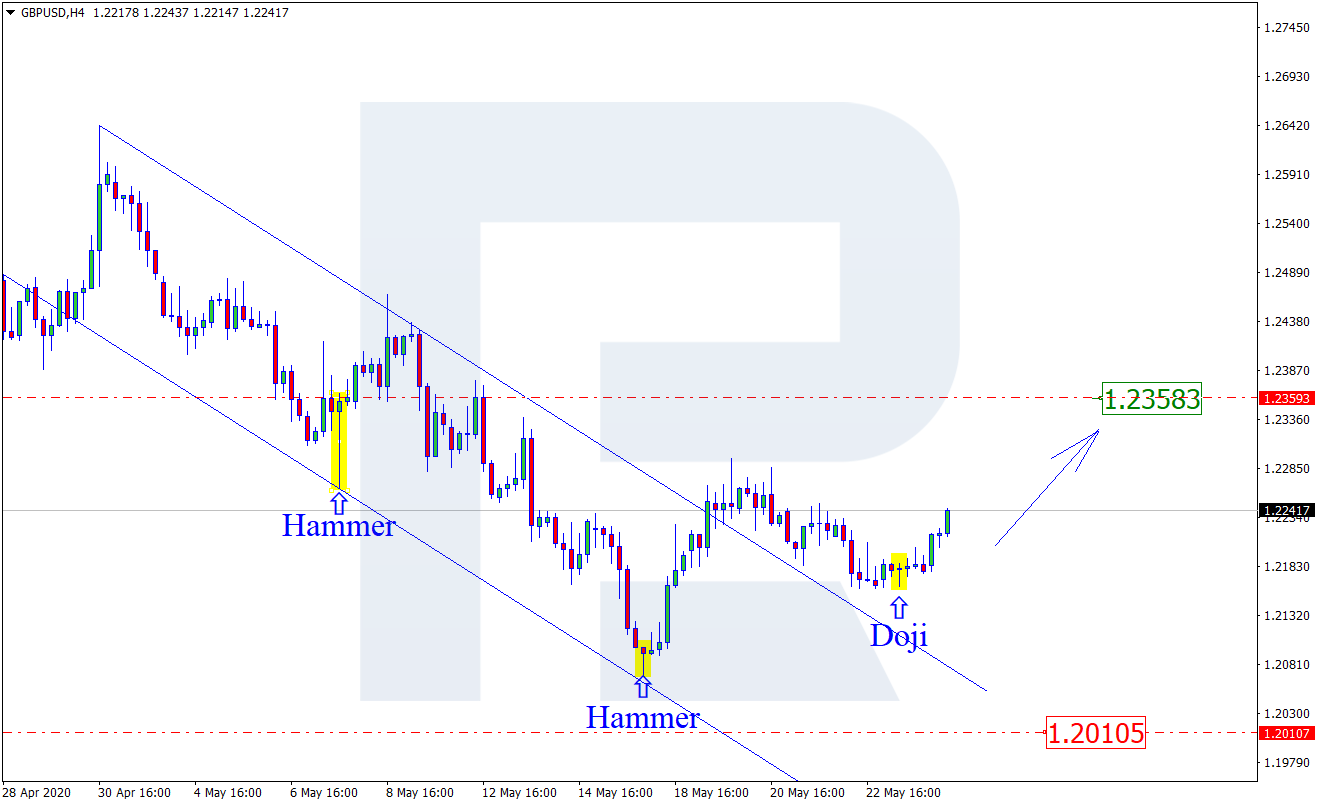
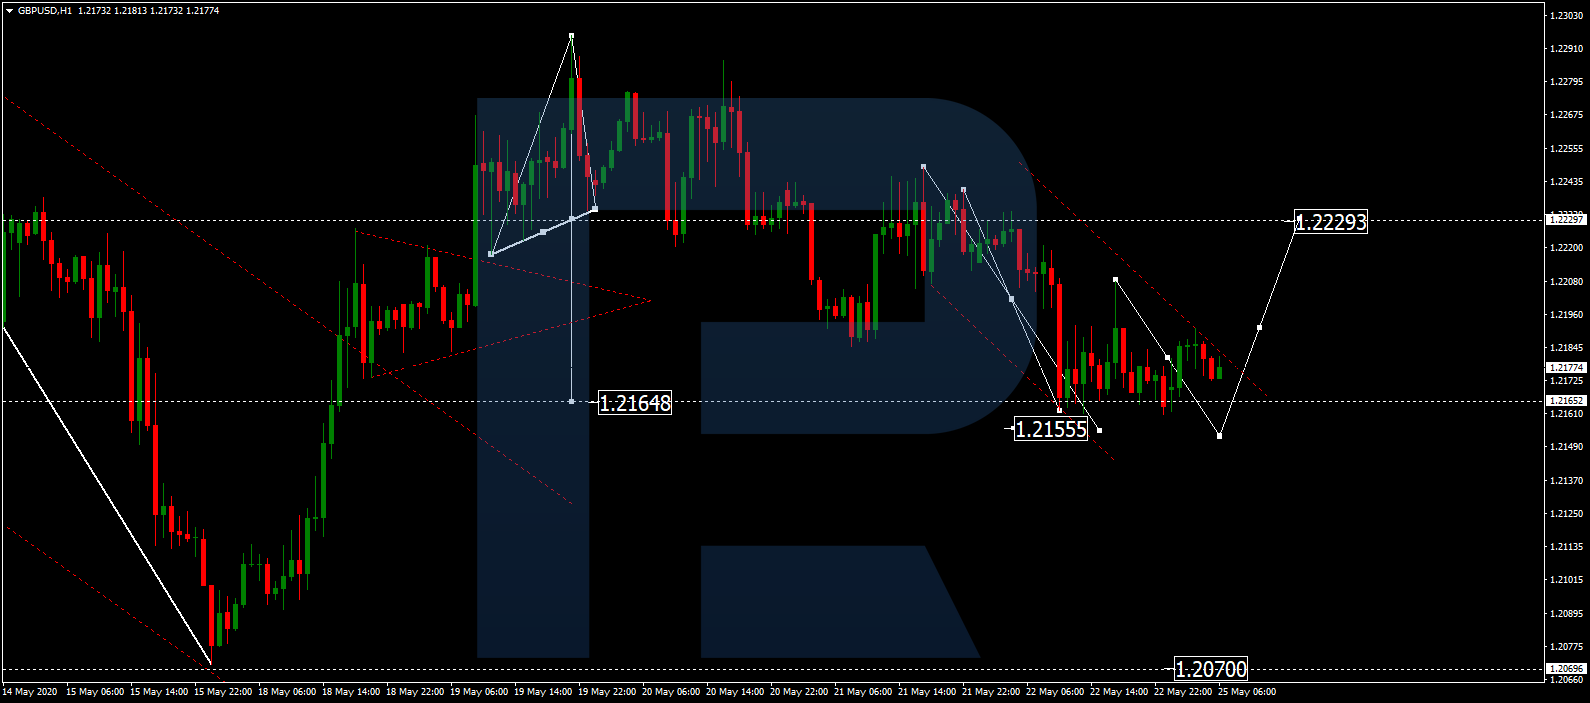
GBPUSD, “Great Britain Pound vs US Dollar”
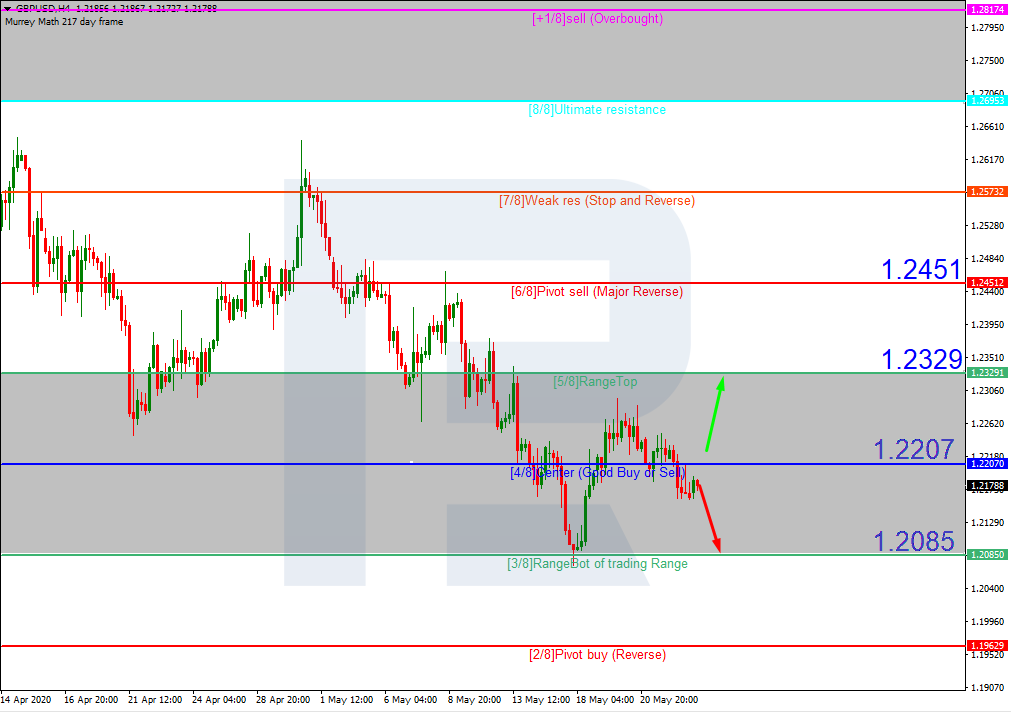
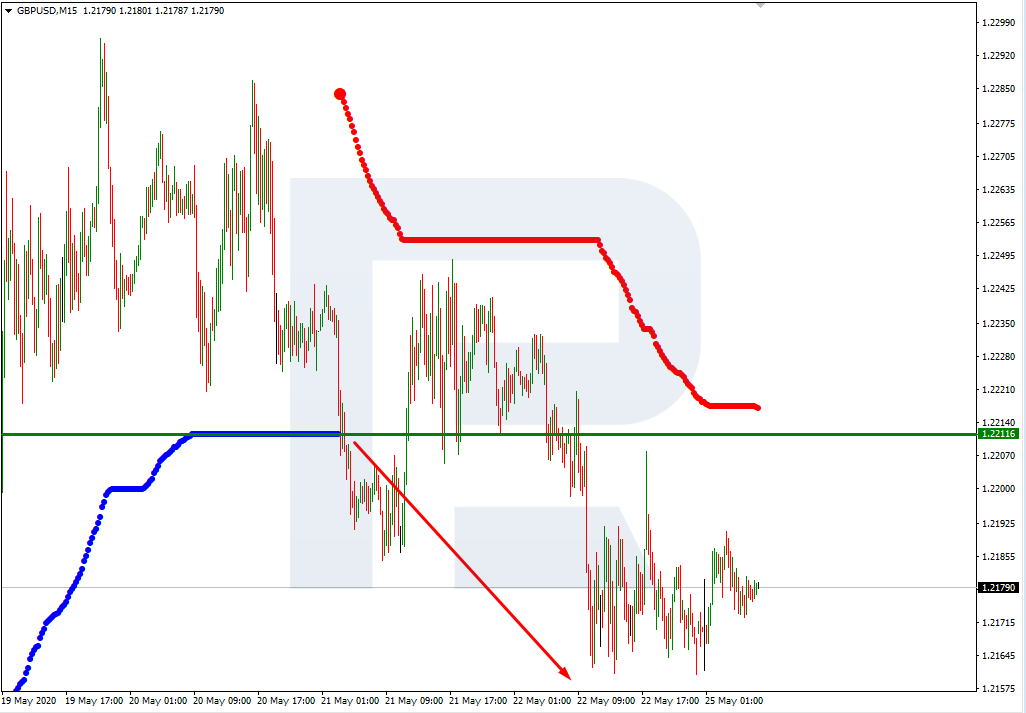
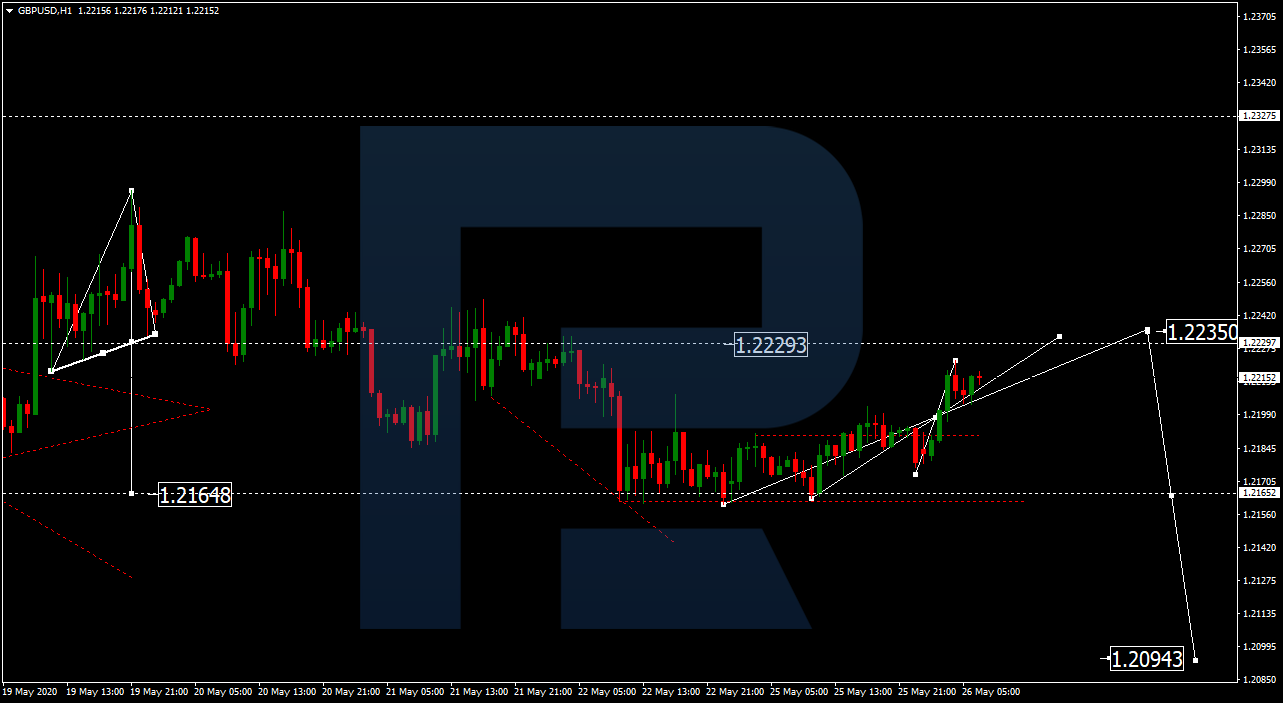
After breaking its consolidation range to the upside, GBPUSD is expected to correct towards 1.2235. After that, the instrument may resume trading downwards with the target at 1.2094.
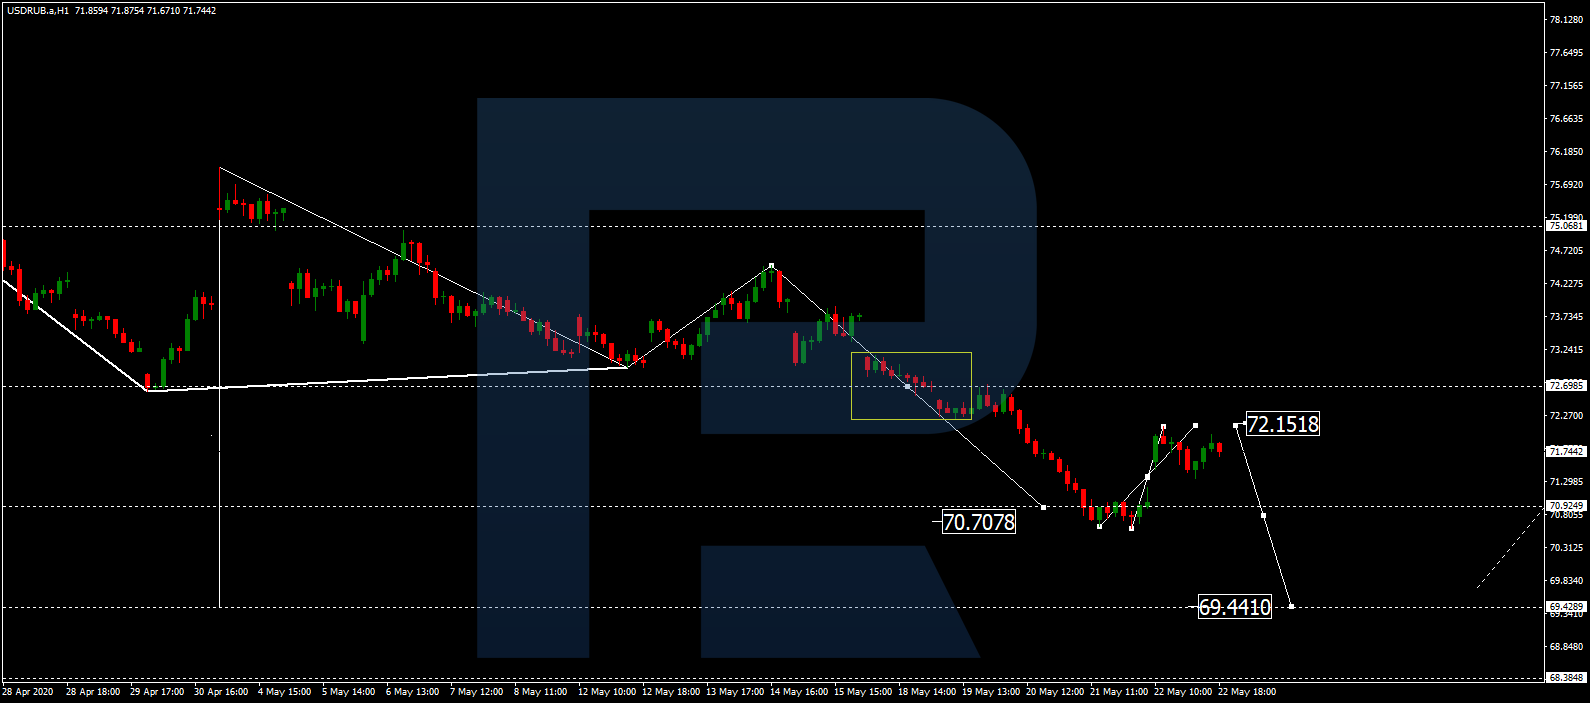
USDRUB, “US Dollar vs Russian Ruble”
USDRUB is consolidating around 71.04. Possibly, the pair may move upwards for a while to reach 72.15 and then resume trading inside the downtrend with the short-term target at 69.44.

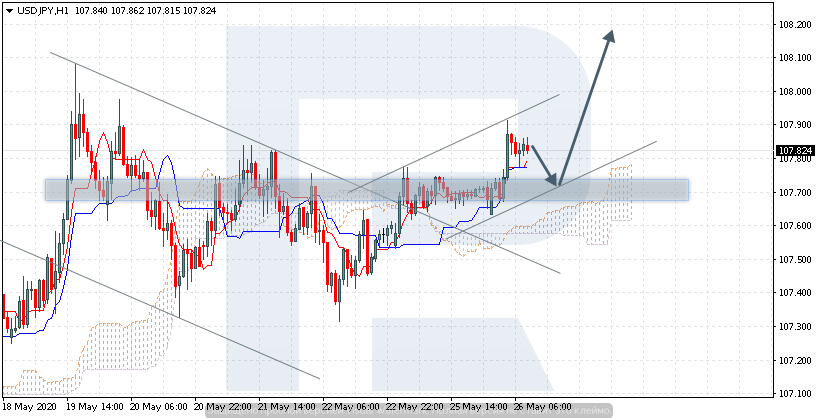
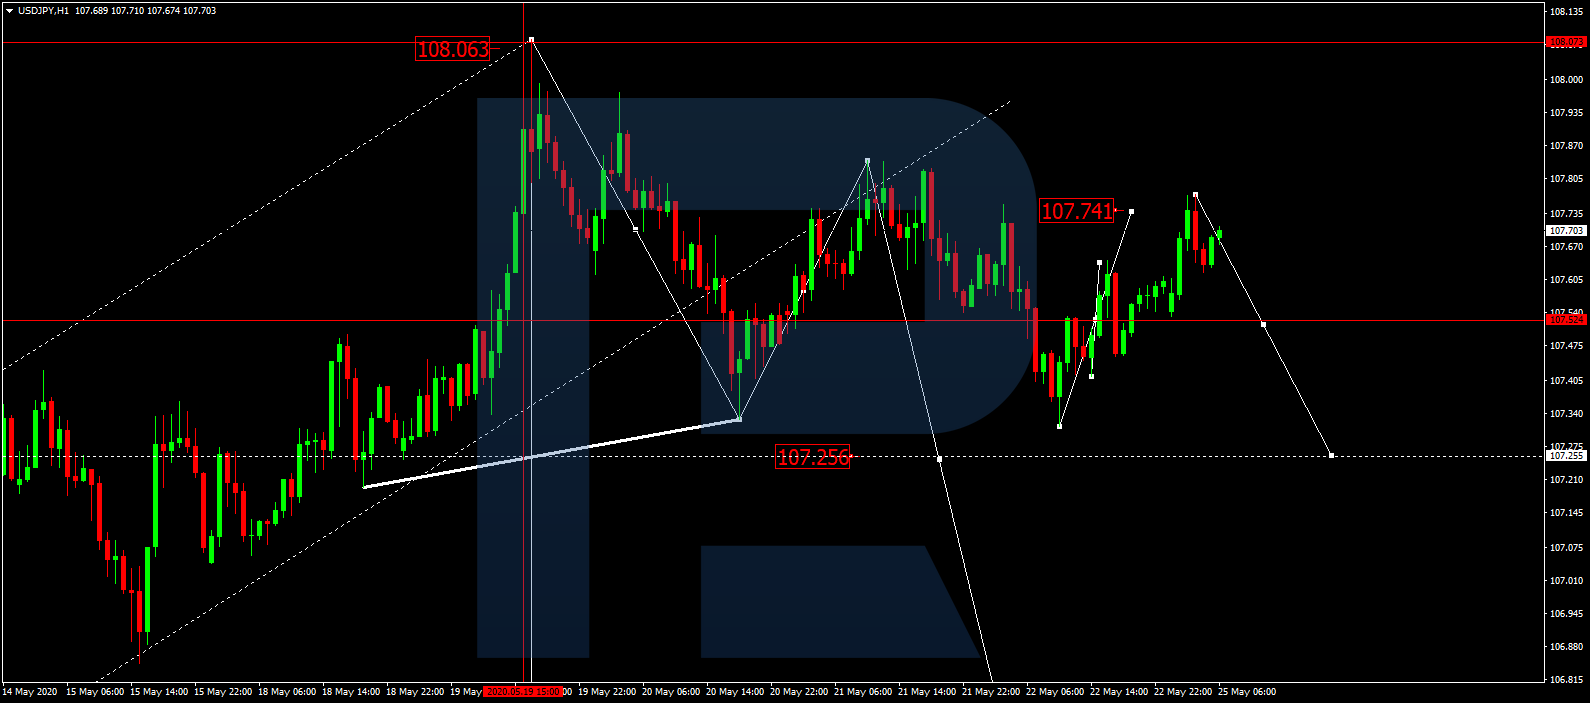
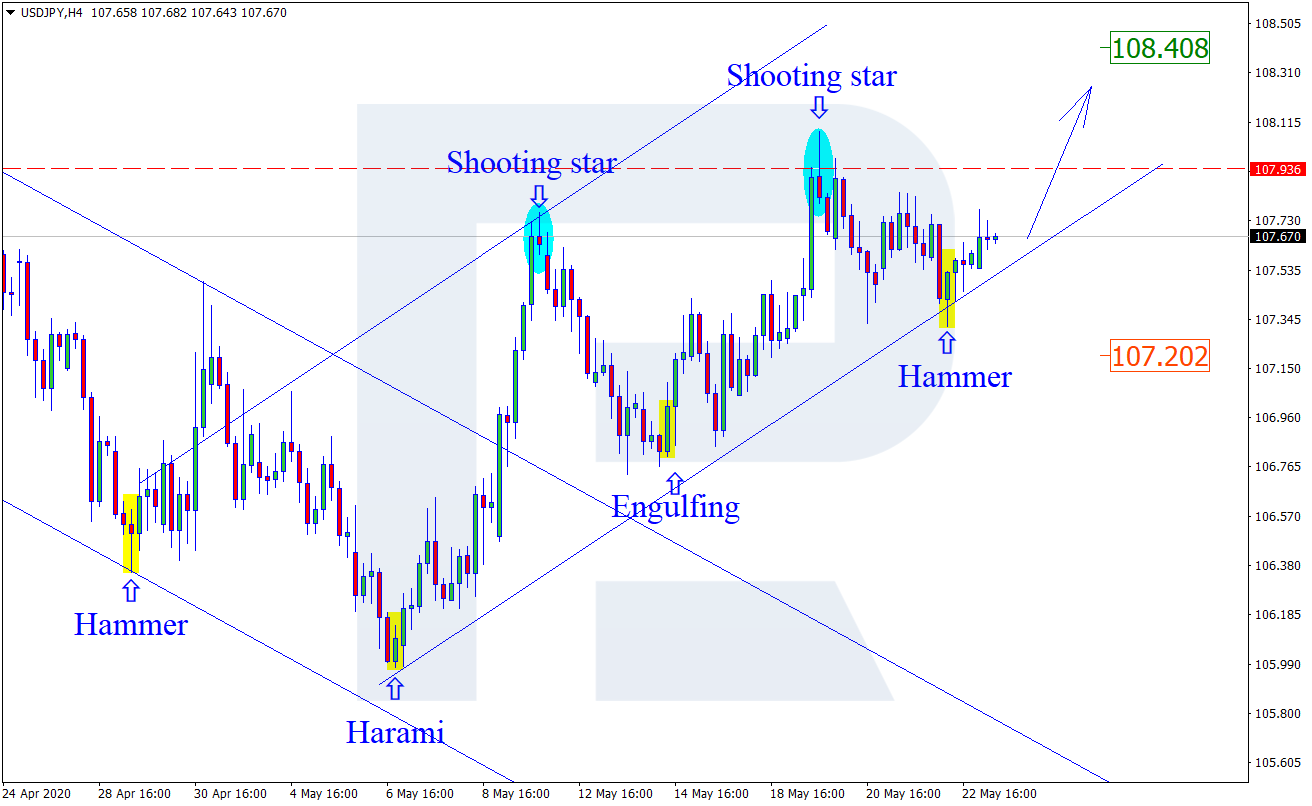
USDJPY, “US Dollar vs Japanese Yen”
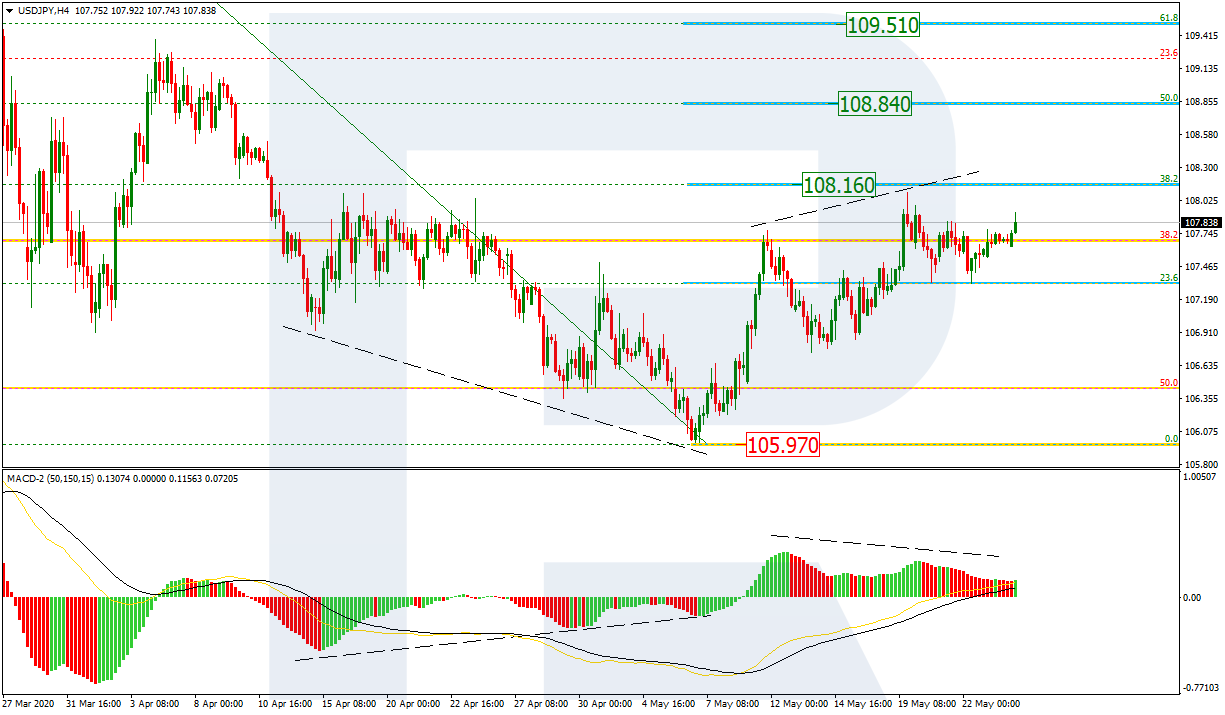
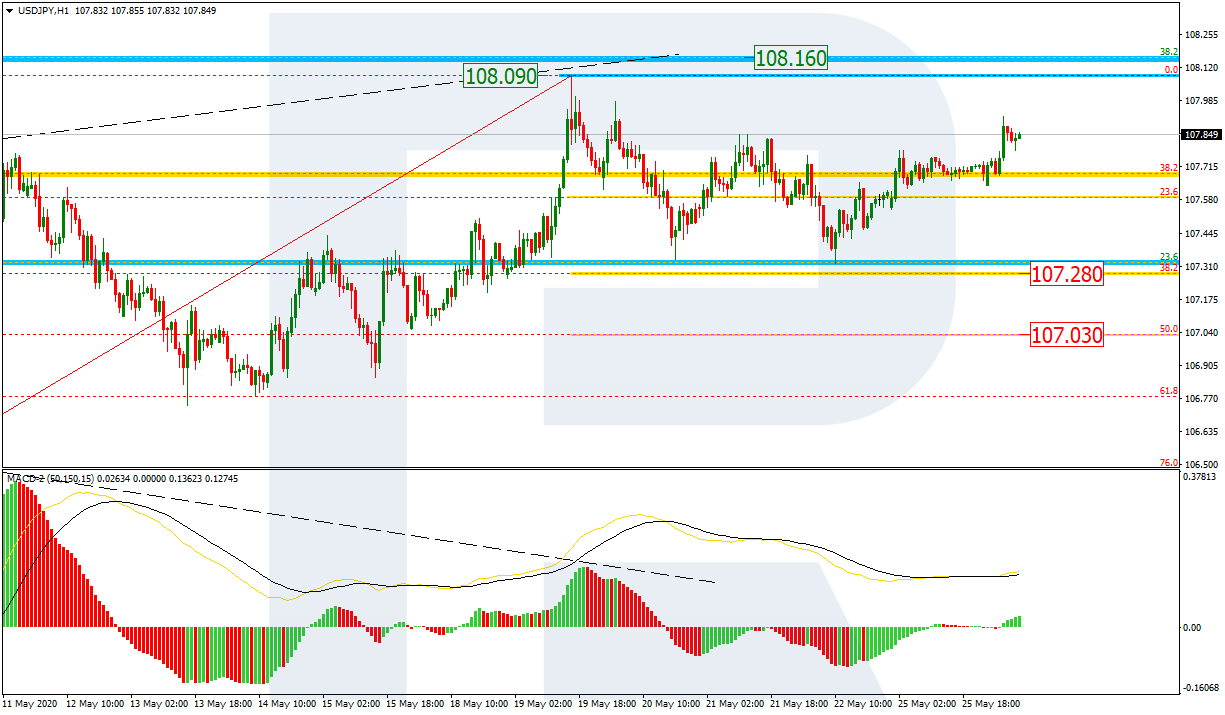
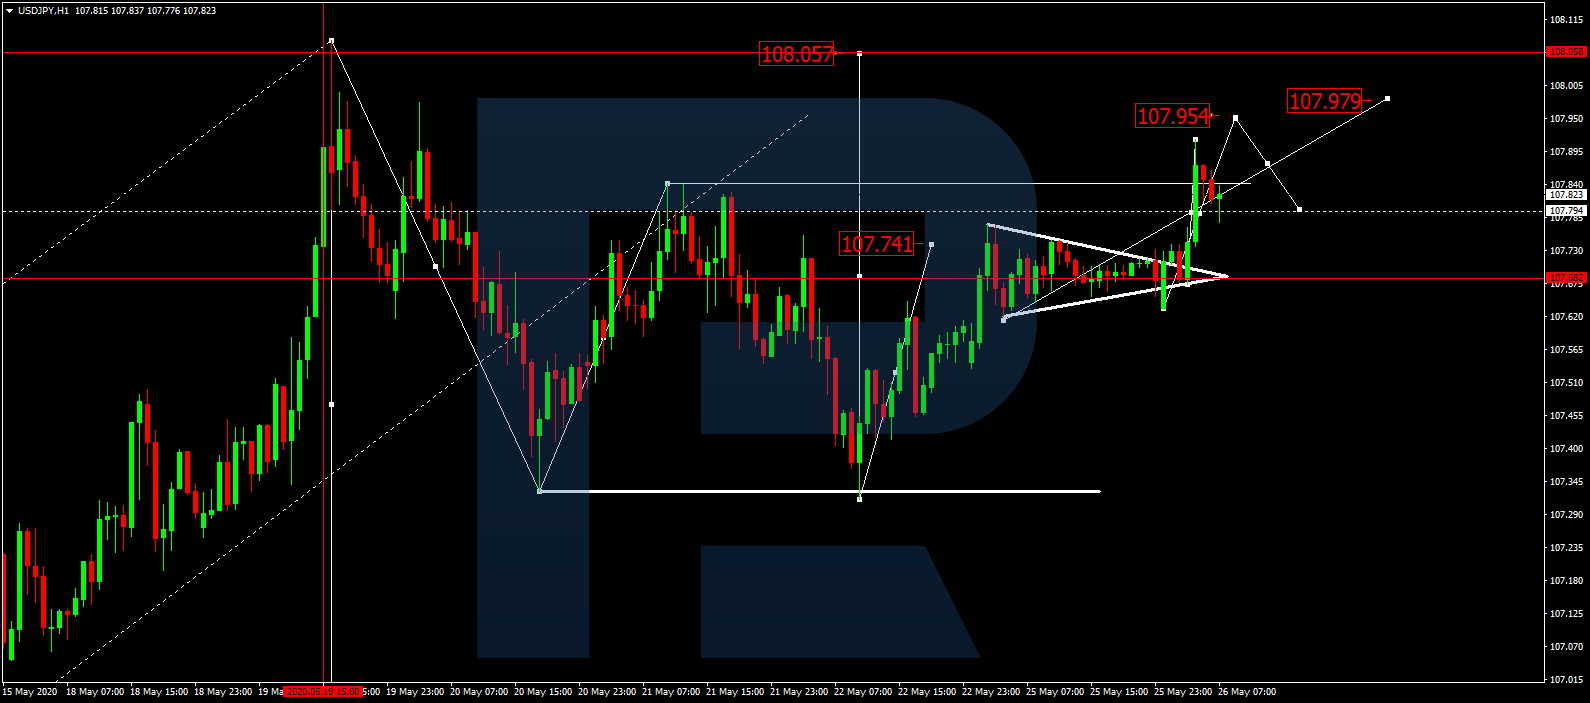
After breaking 107.70 to the upside, USDJPY is expected to continue the correction towards 107.97. After that, the instrument may form a new descending structure to break 107.70 and then continue falling with the target at 106.60.
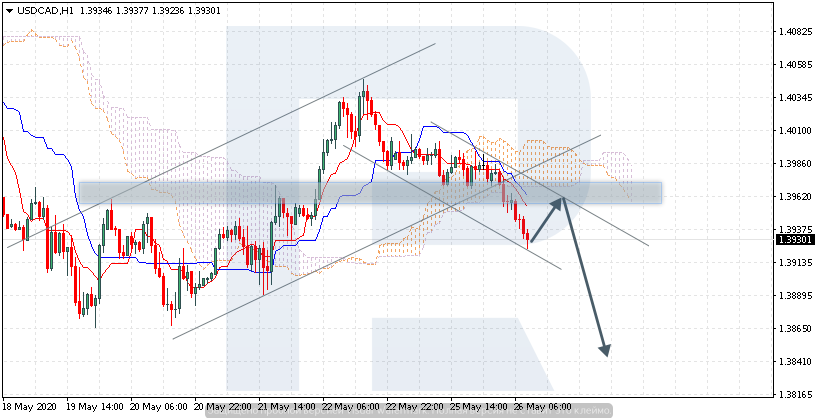
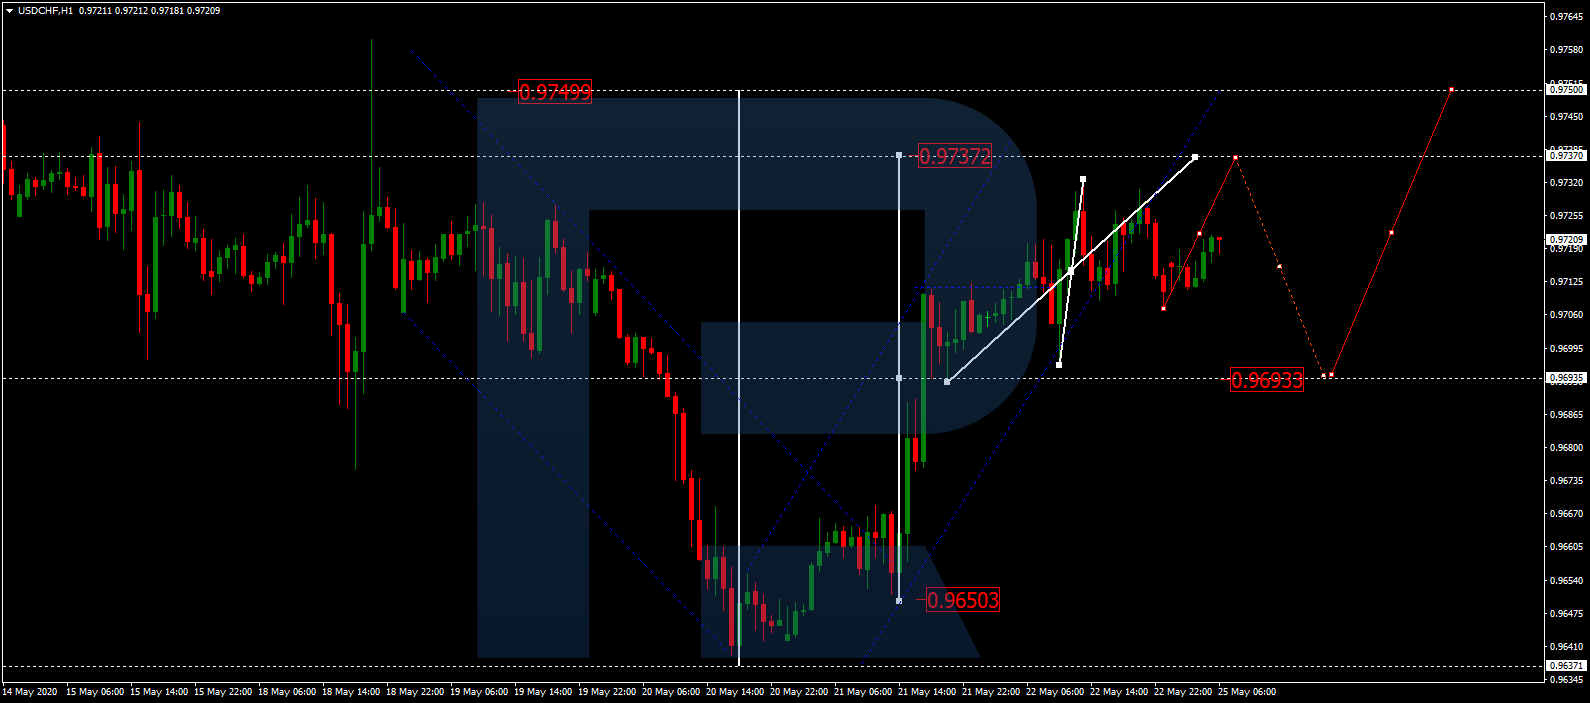
USDCHF, “US Dollar vs Swiss Franc”
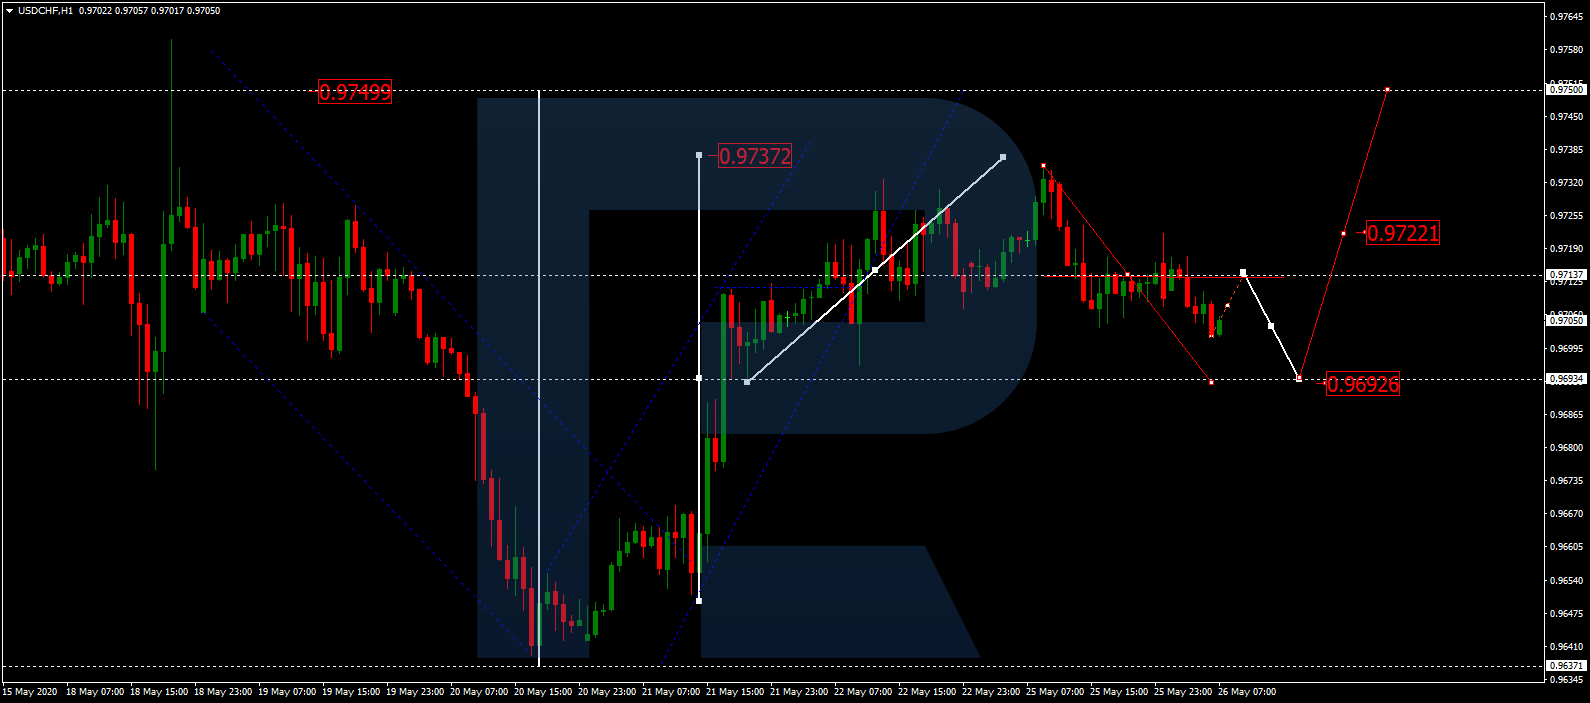
USDCHF is moving downwards. Today, the pair may finish the correction towards 0.9692 and then resume growing to break 0.9722. Later, the market may continue growing with the target at 0.9750.
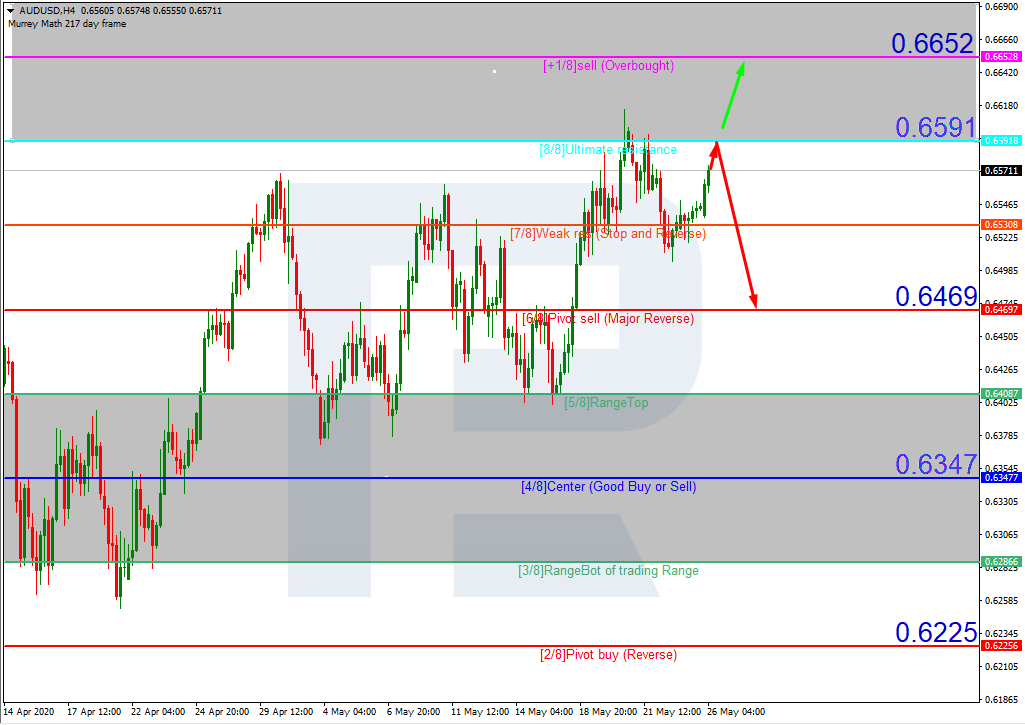
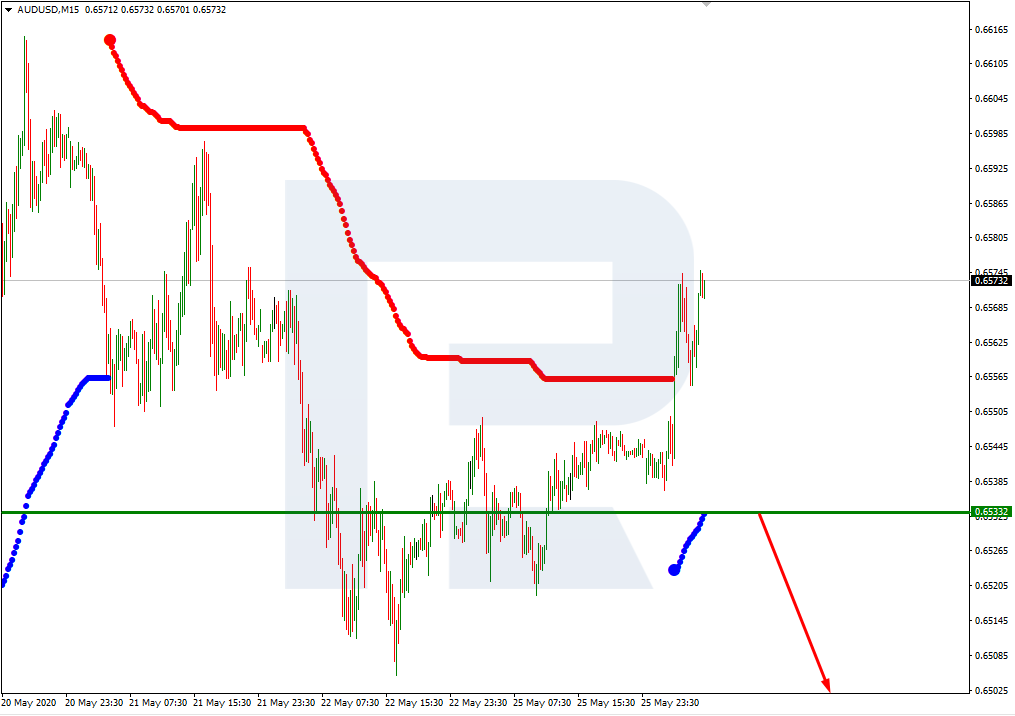
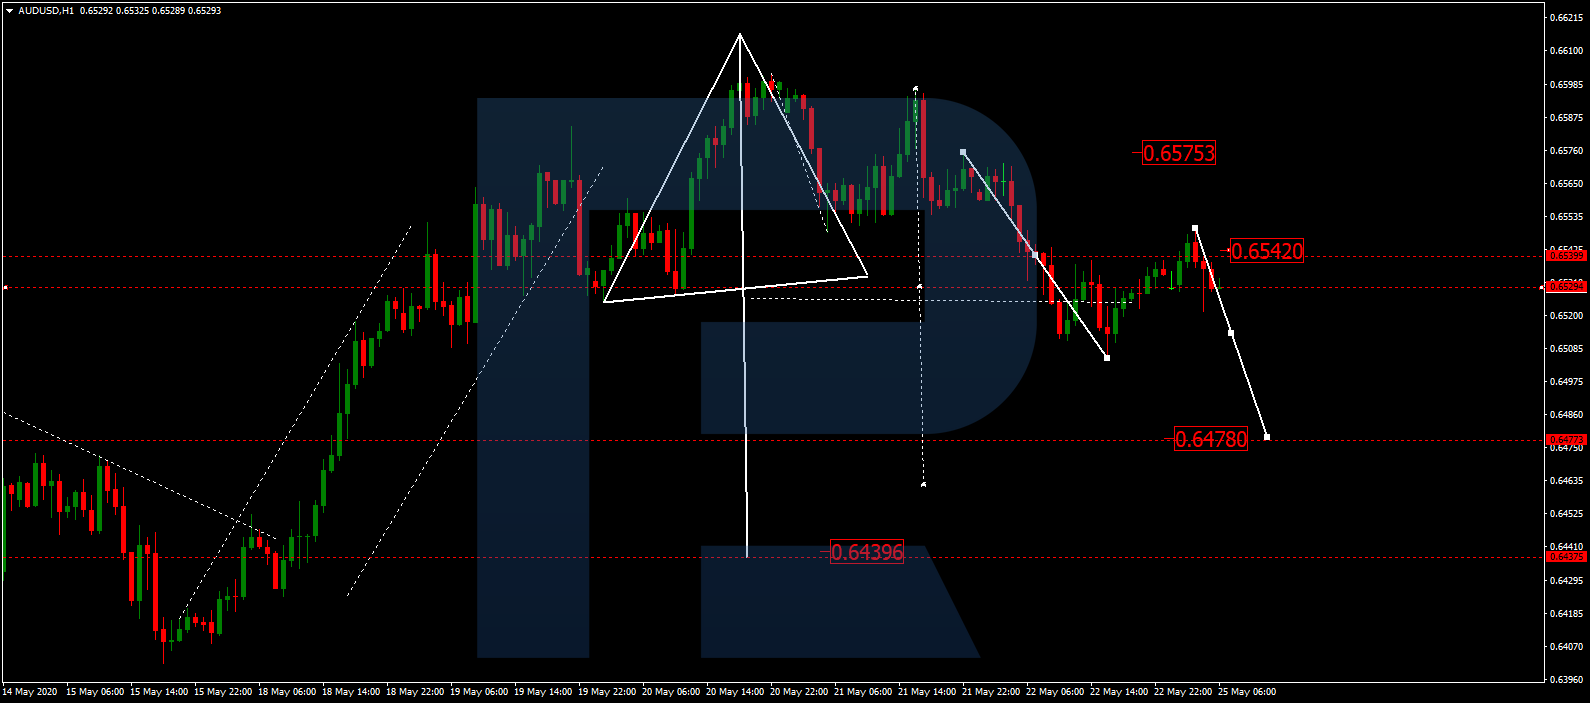
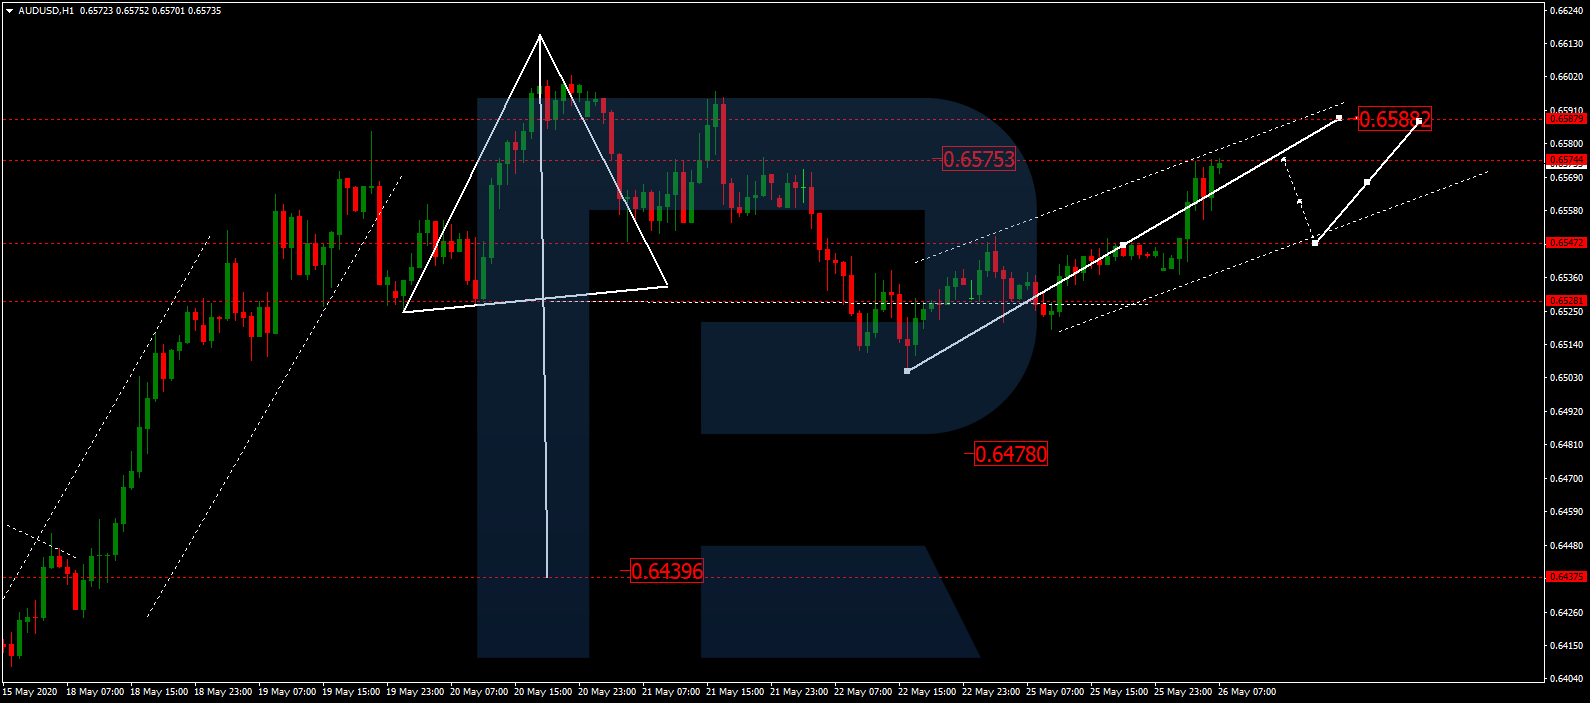
AUDUSD, “Australian Dollar vs US Dollar”
After forming another consolidation range below 0.6545 and breaking it to the upside, AUDUSD is expected to continue the correction towards 0.6589. Later, the market may start a new decline to break 0.6545 and then continue trading downwards with the target at 0.6474.
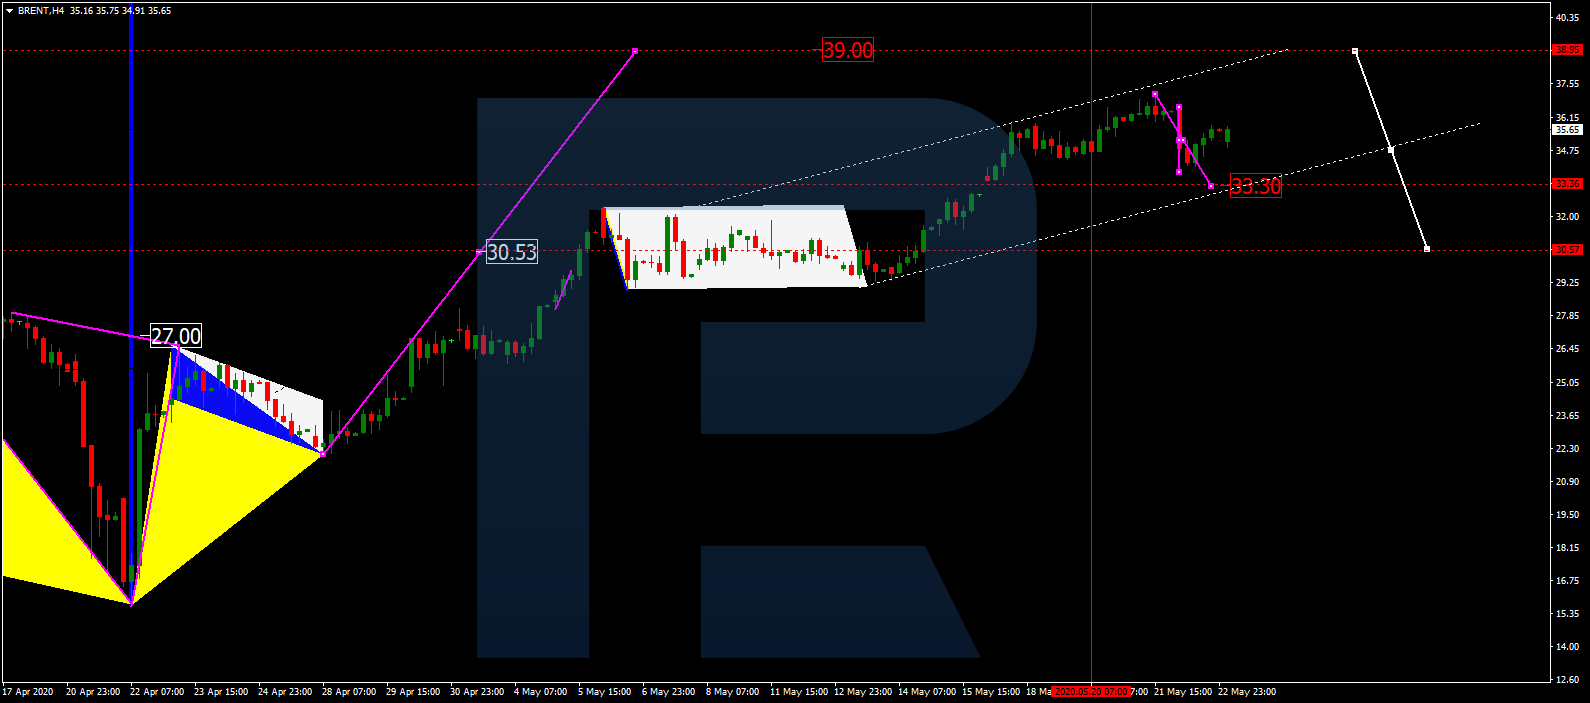
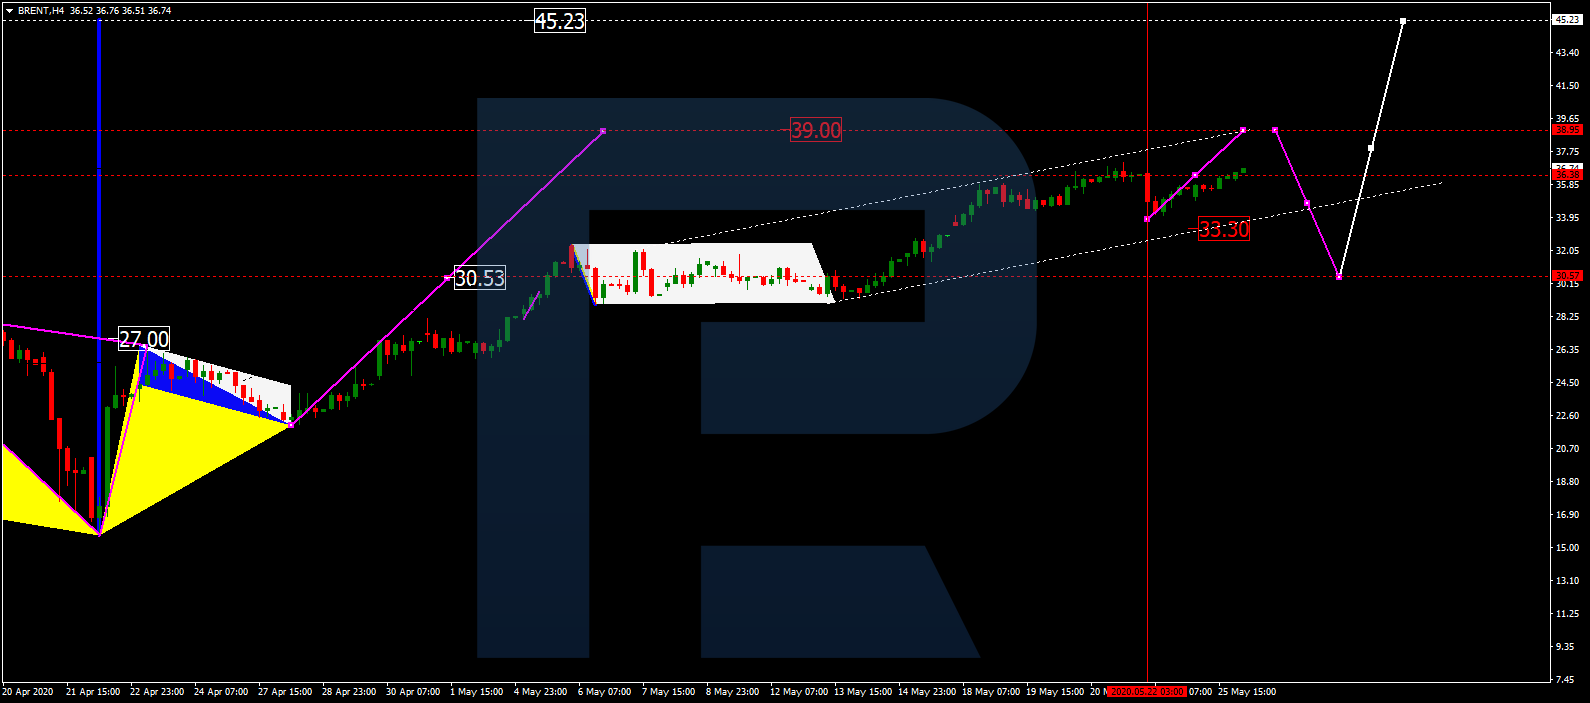
BRENT
Brent is growing. Possibly, today the pair may reach 39.00 and then start a new correction towards 30.50. After that, the instrument may resume trading upwards with the target at 45.50.
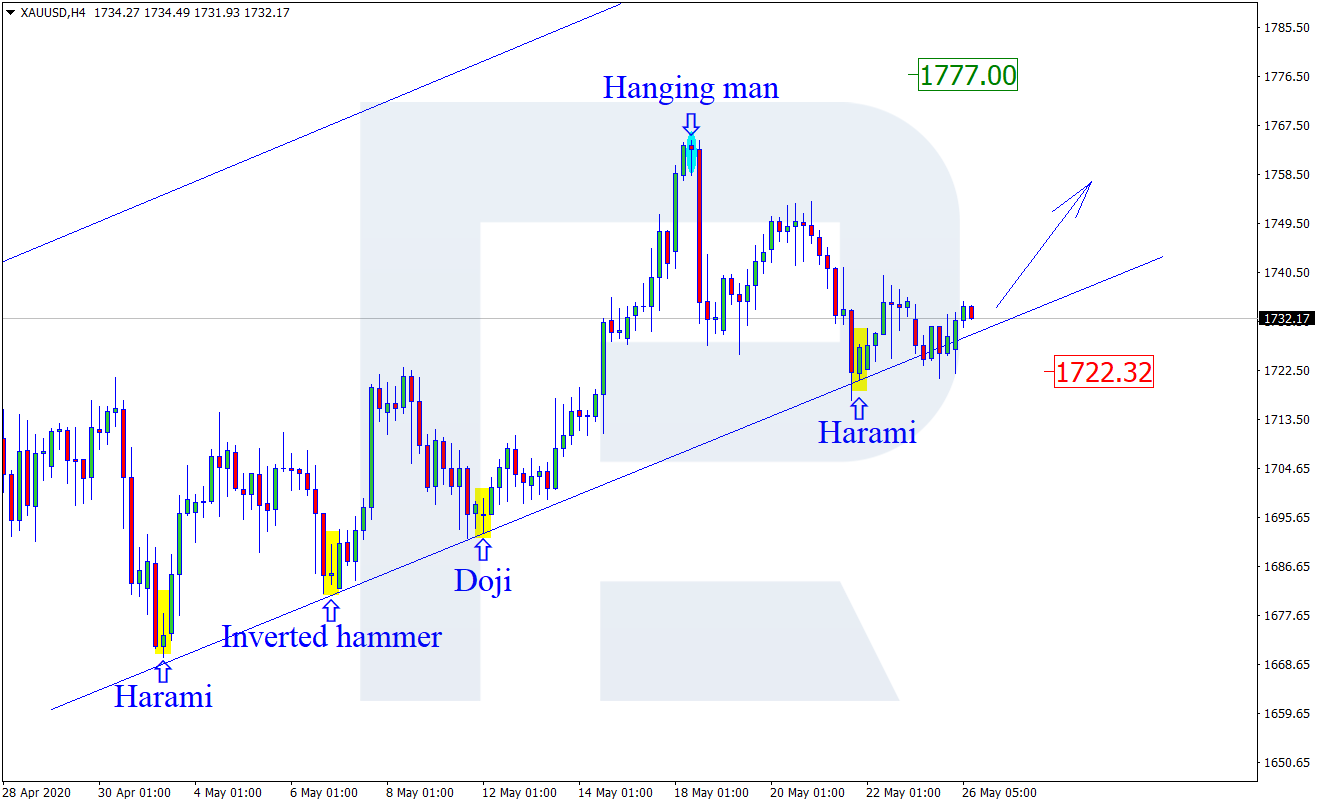
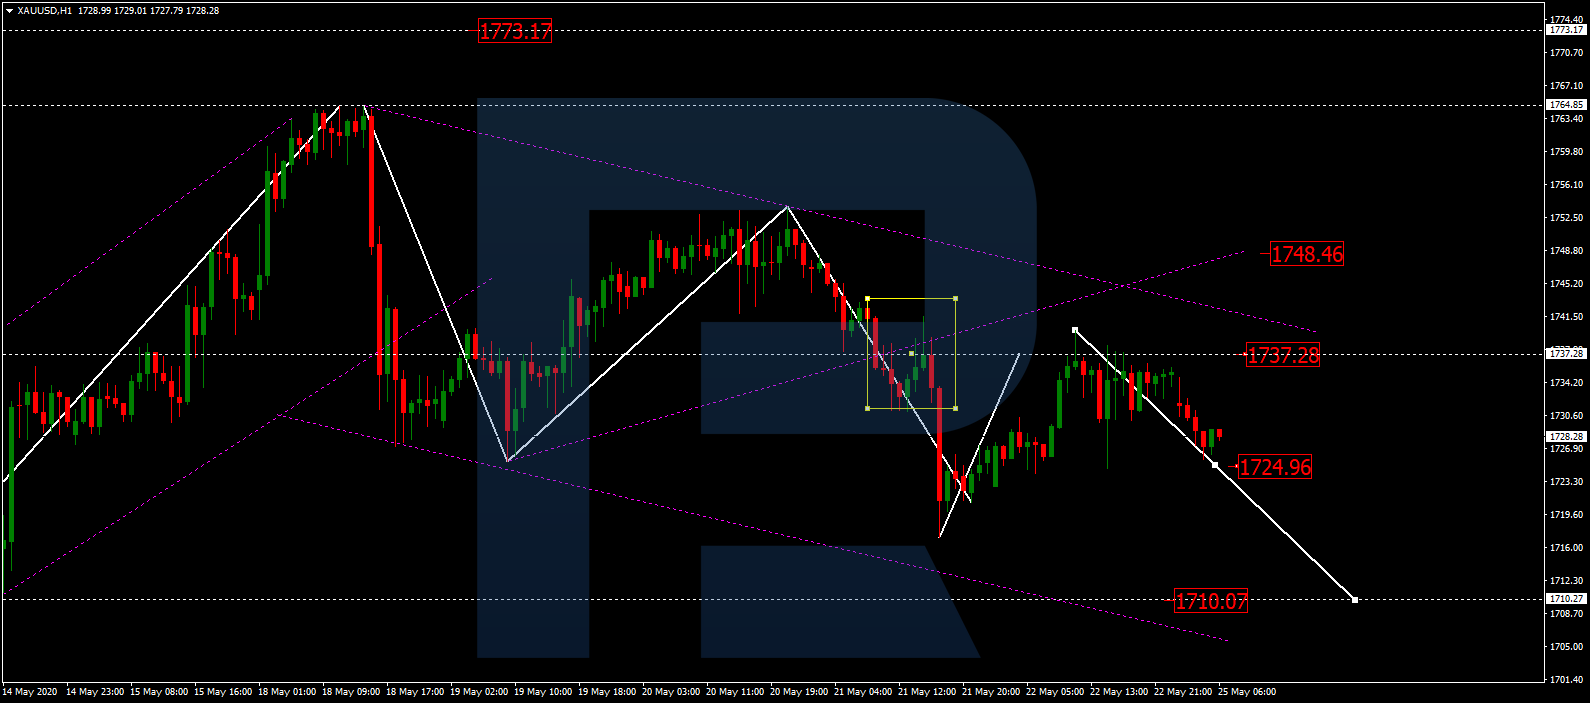
XAUUSD, “Gold vs US Dollar”
Gold is still consolidating around 1728.50. Today, the pair may start another growth to reach 1737.27 and then form a new descending structure to complete the correction at 1710.10. After that, the instrument resume trading upwards with the target at 1750.50.

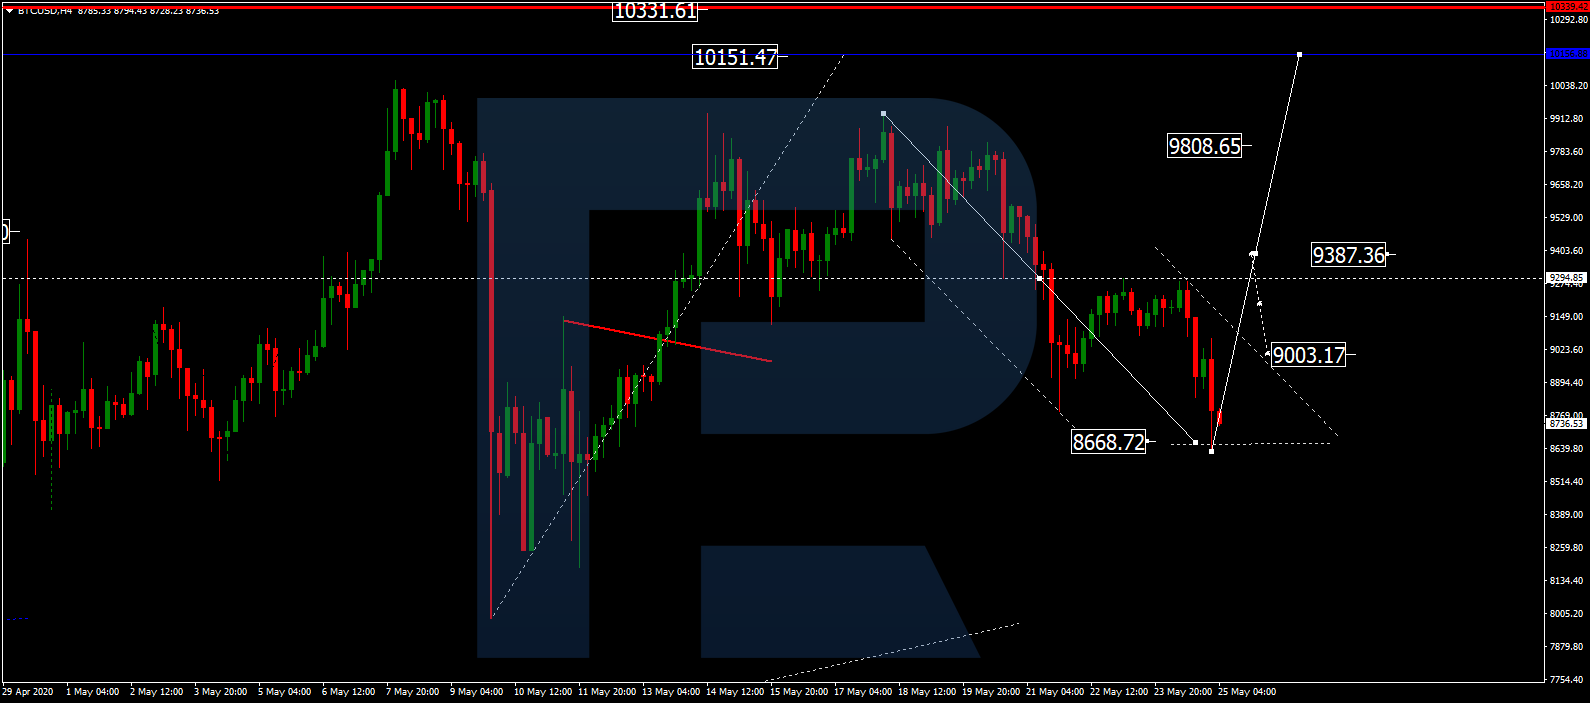
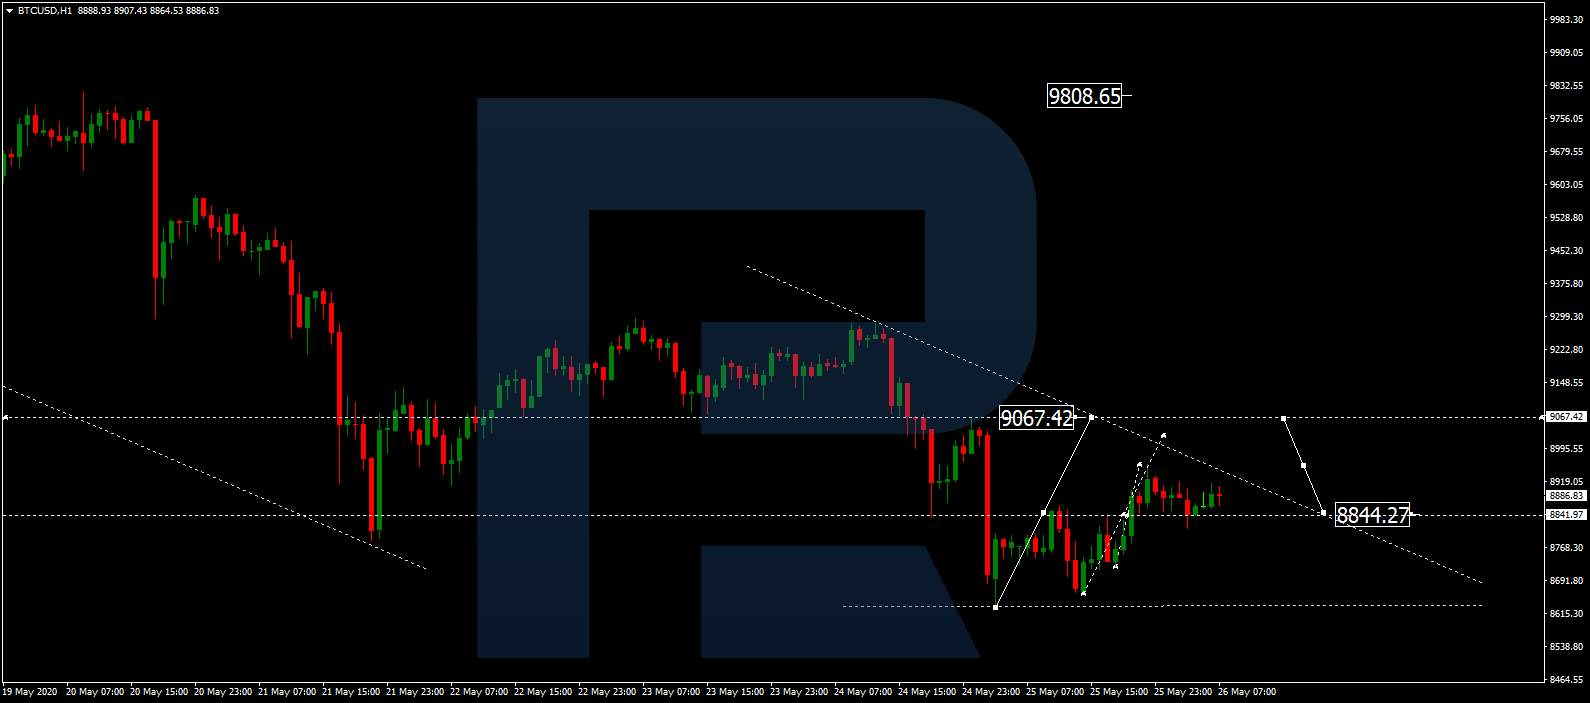
BTCUSD, “Bitcoin vs US Dollar”
After breaking 8844.00 to the upside, BTCUSD is expected to continue growing towards 9067.00. Later, the market may correct to return to 8844.00 and then resume trading upwards to break 9200.00. After that, the instrument may continue growing with the target at 9800.00.
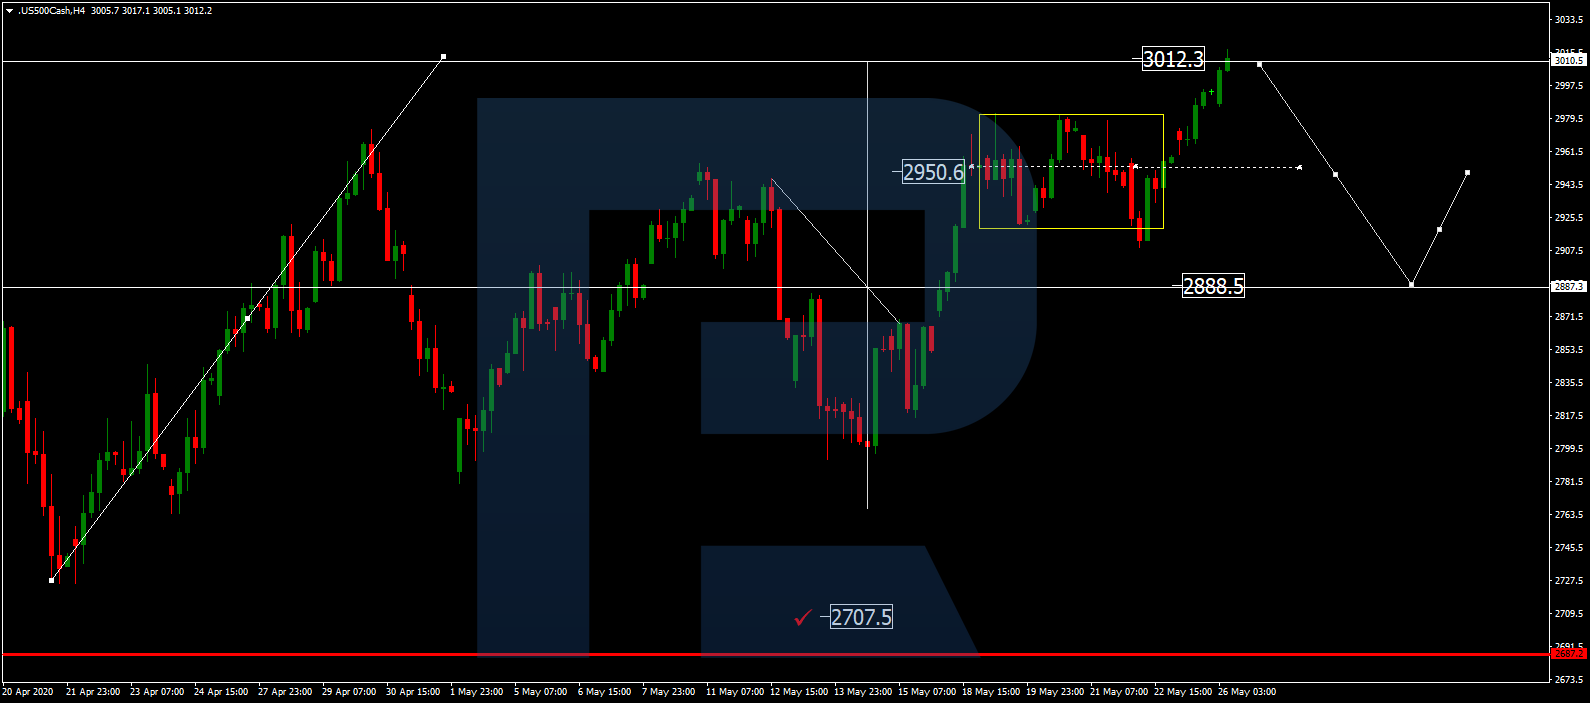
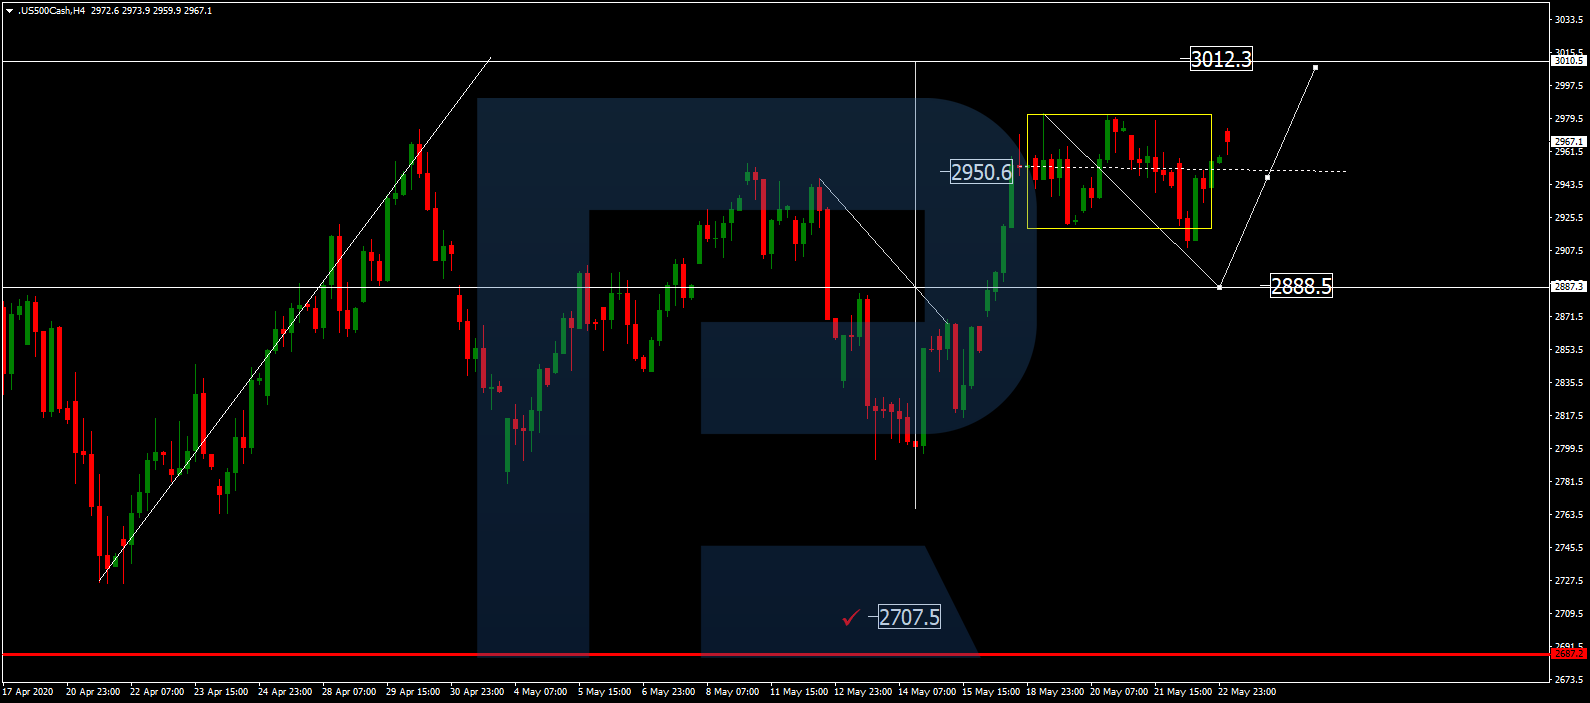
S&P 500
After reaching 3012.3, the Index is expected to consolidate near the highs. If later the price breaks this range to the downside, the market may correct with the target at 2888.5, at least.