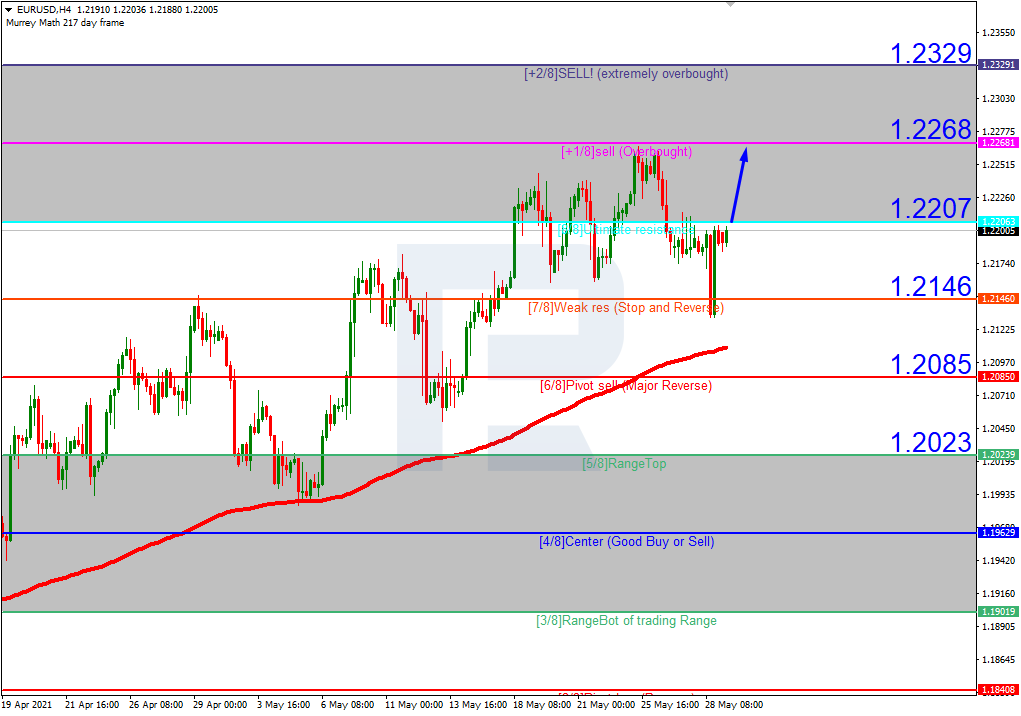
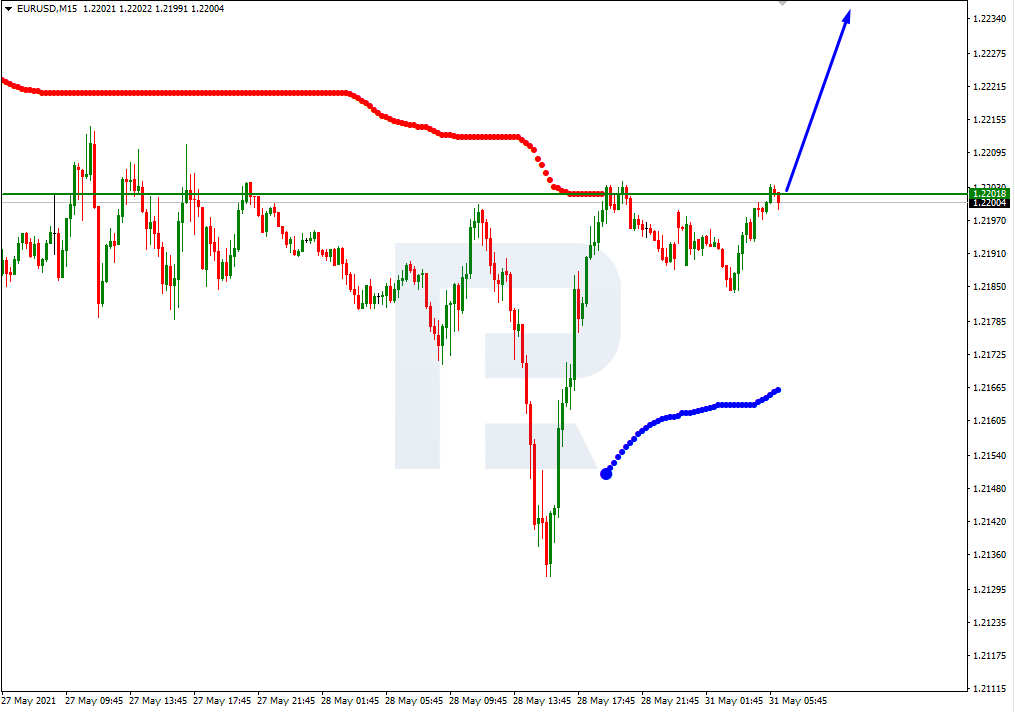
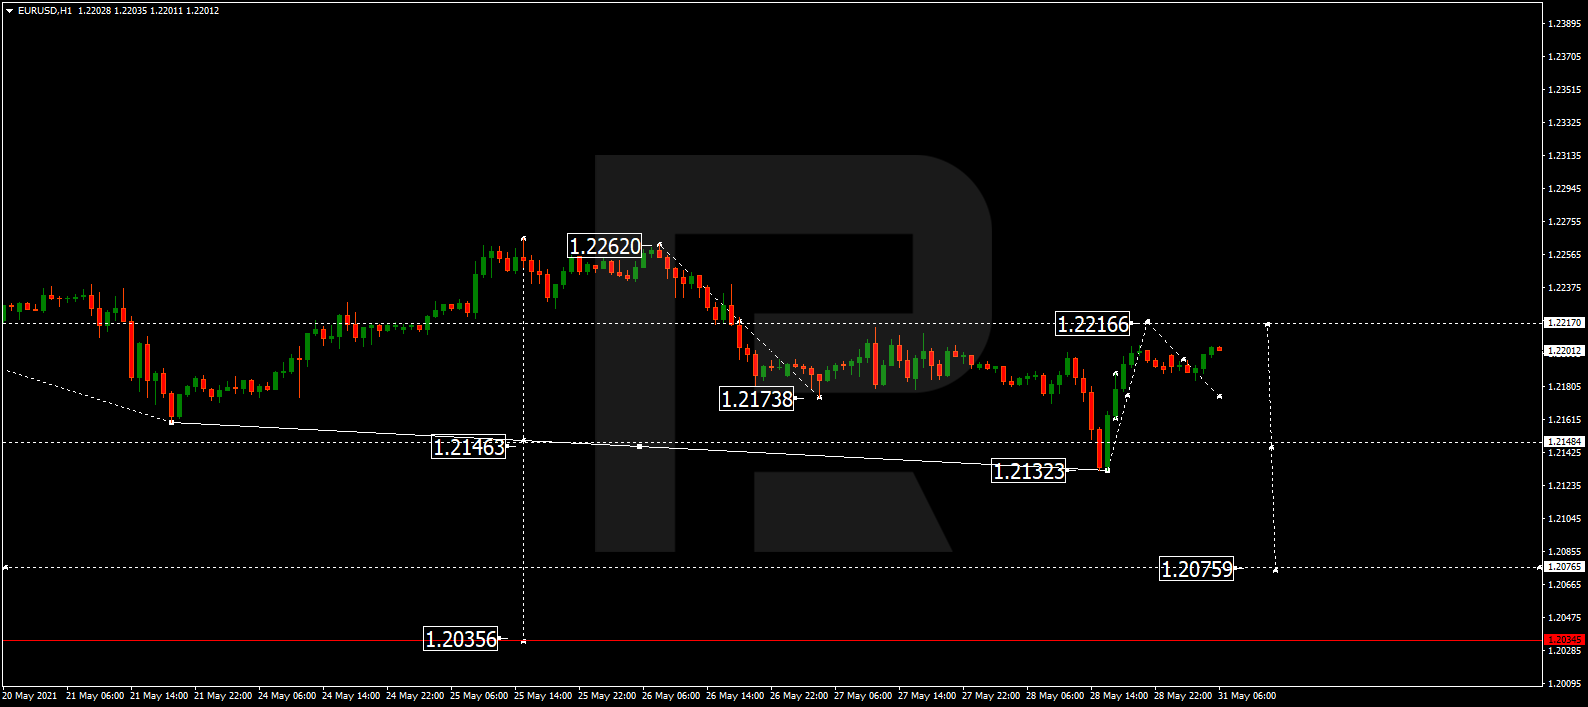
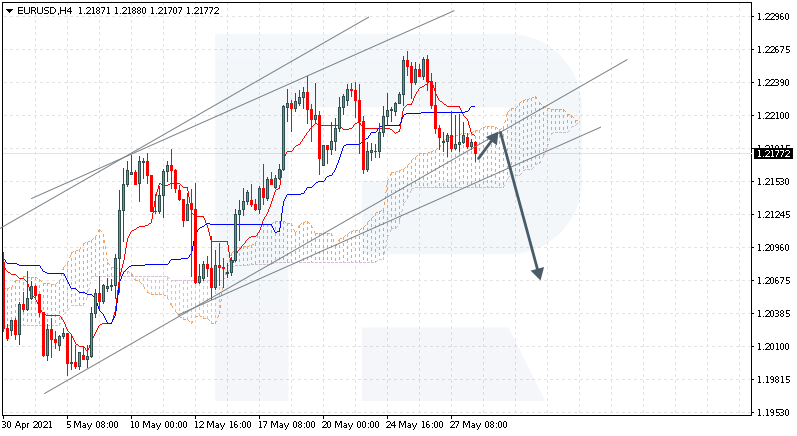
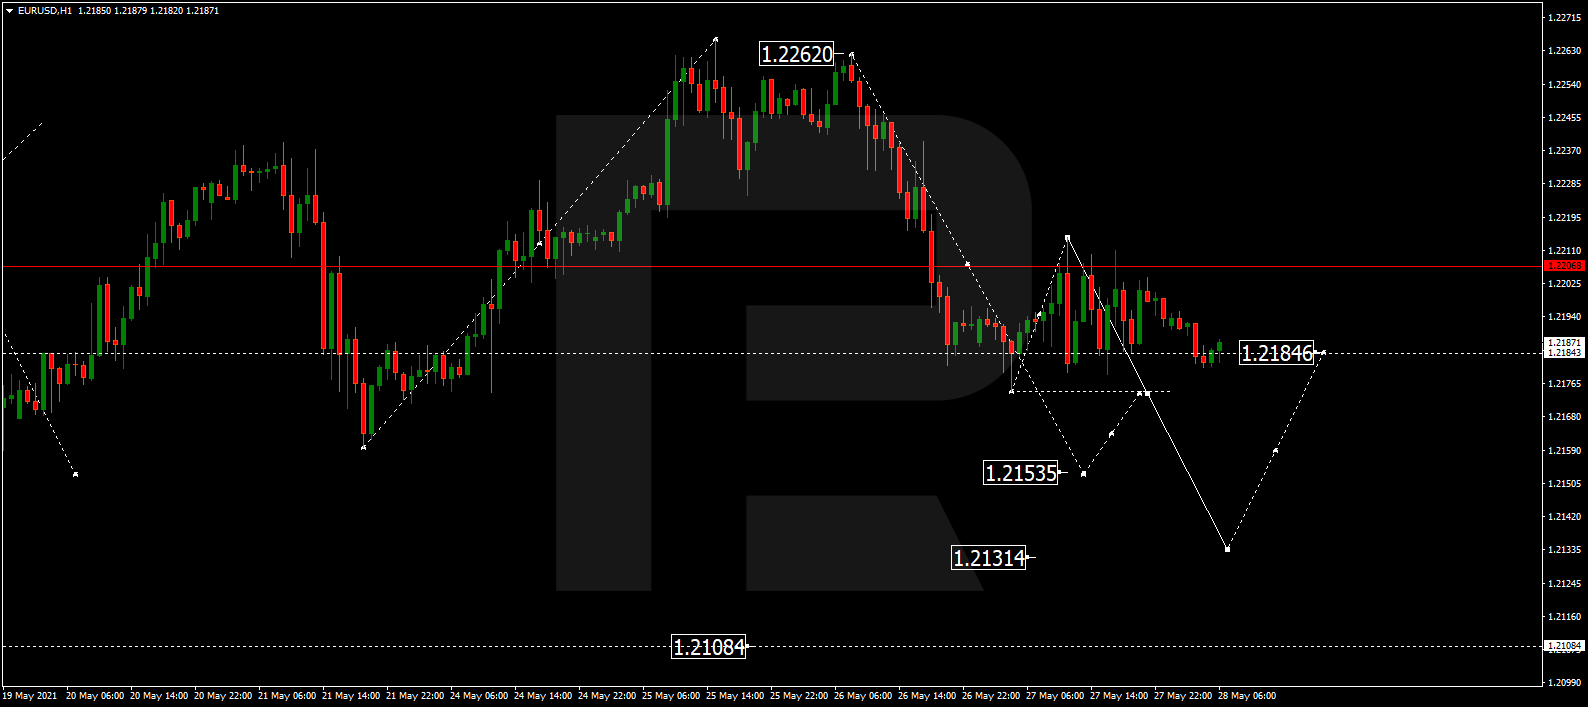
EURUSD, “Euro vs US Dollar”
EURUSD is still forming a new consolidation range above 1.2184. Possibly, today the pair may break this range to the downside and resume falling to reach 1.2132. Later, the market may start another correction to return to 1.2184 and then resume trading downwards with the target at 1.2108.

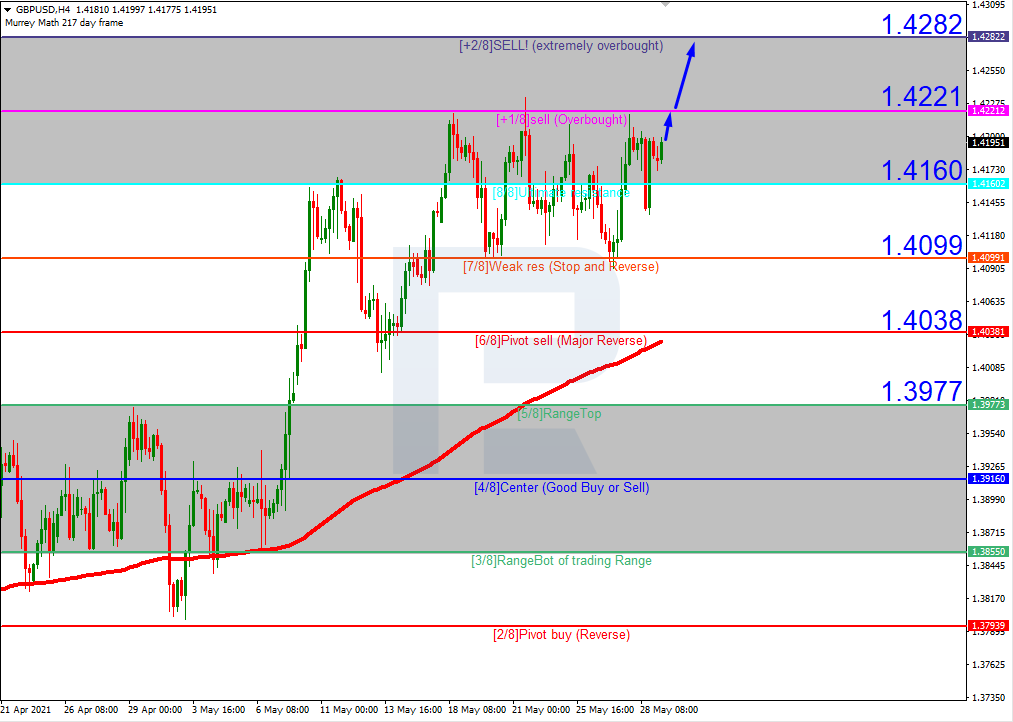
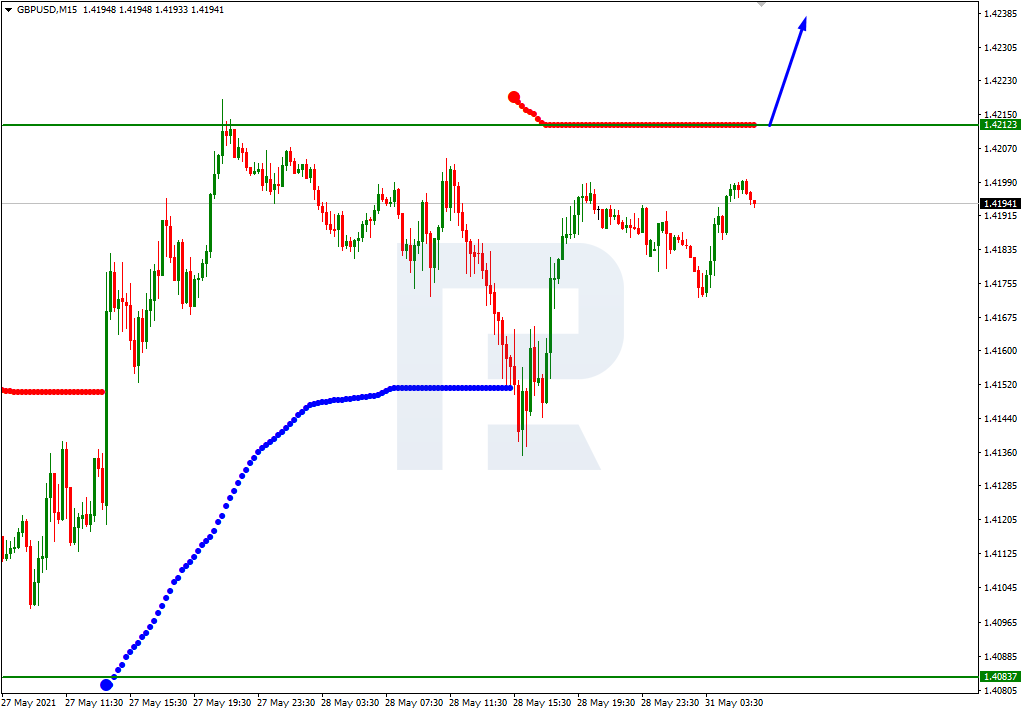
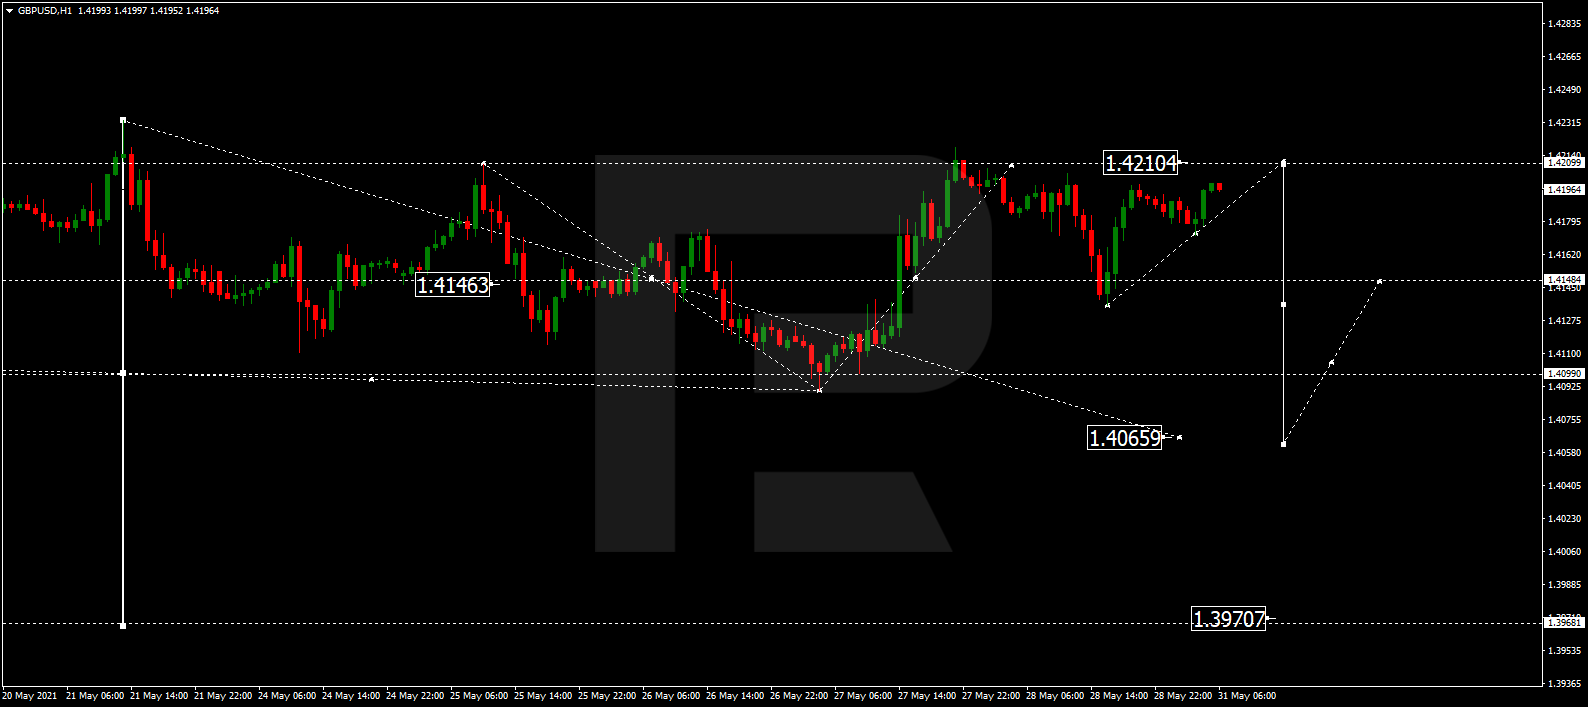
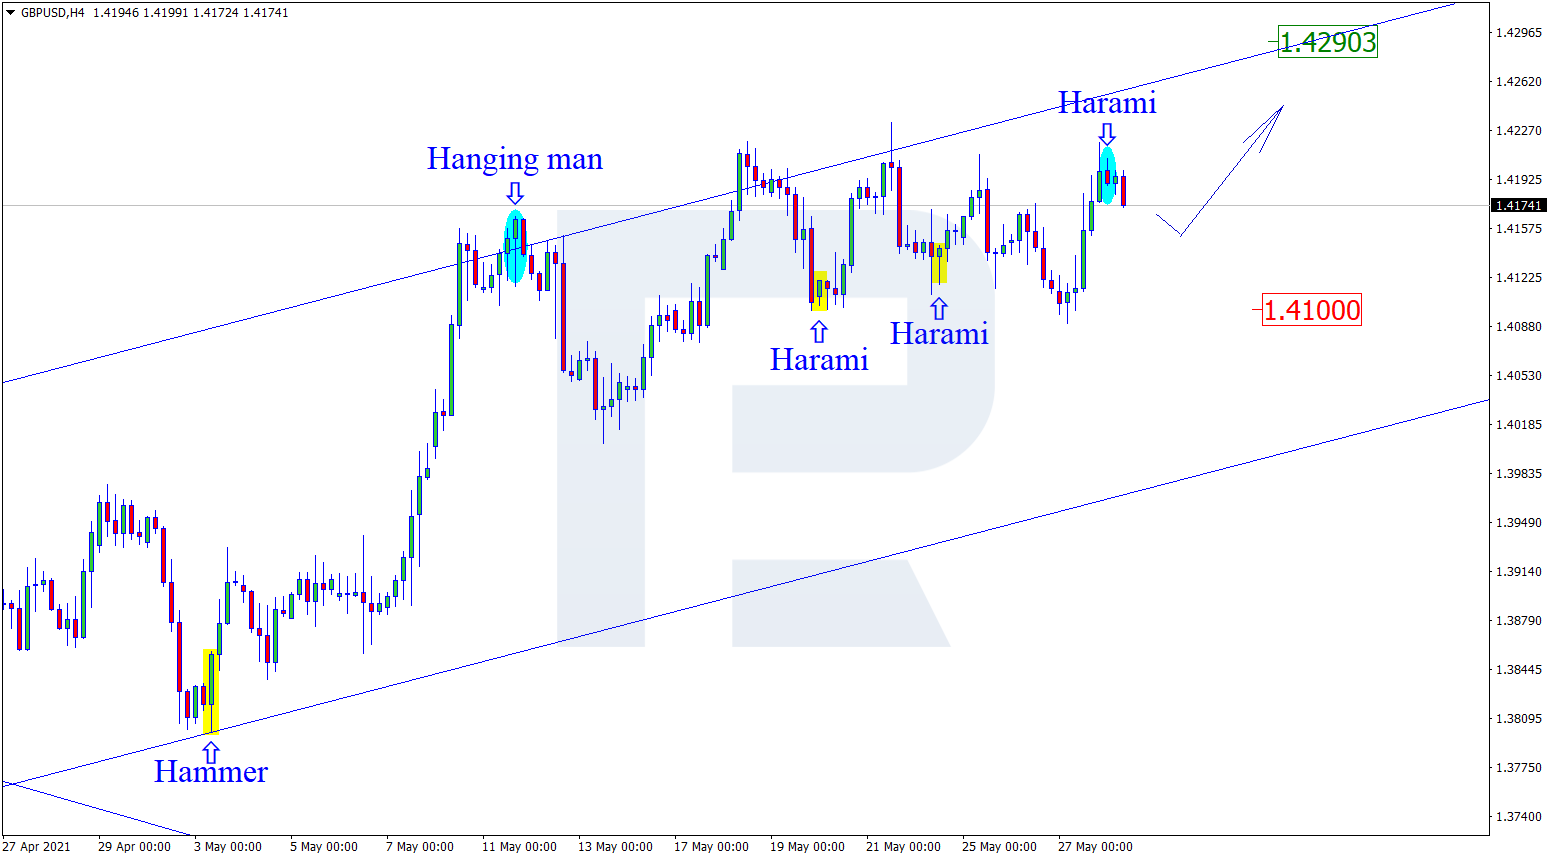
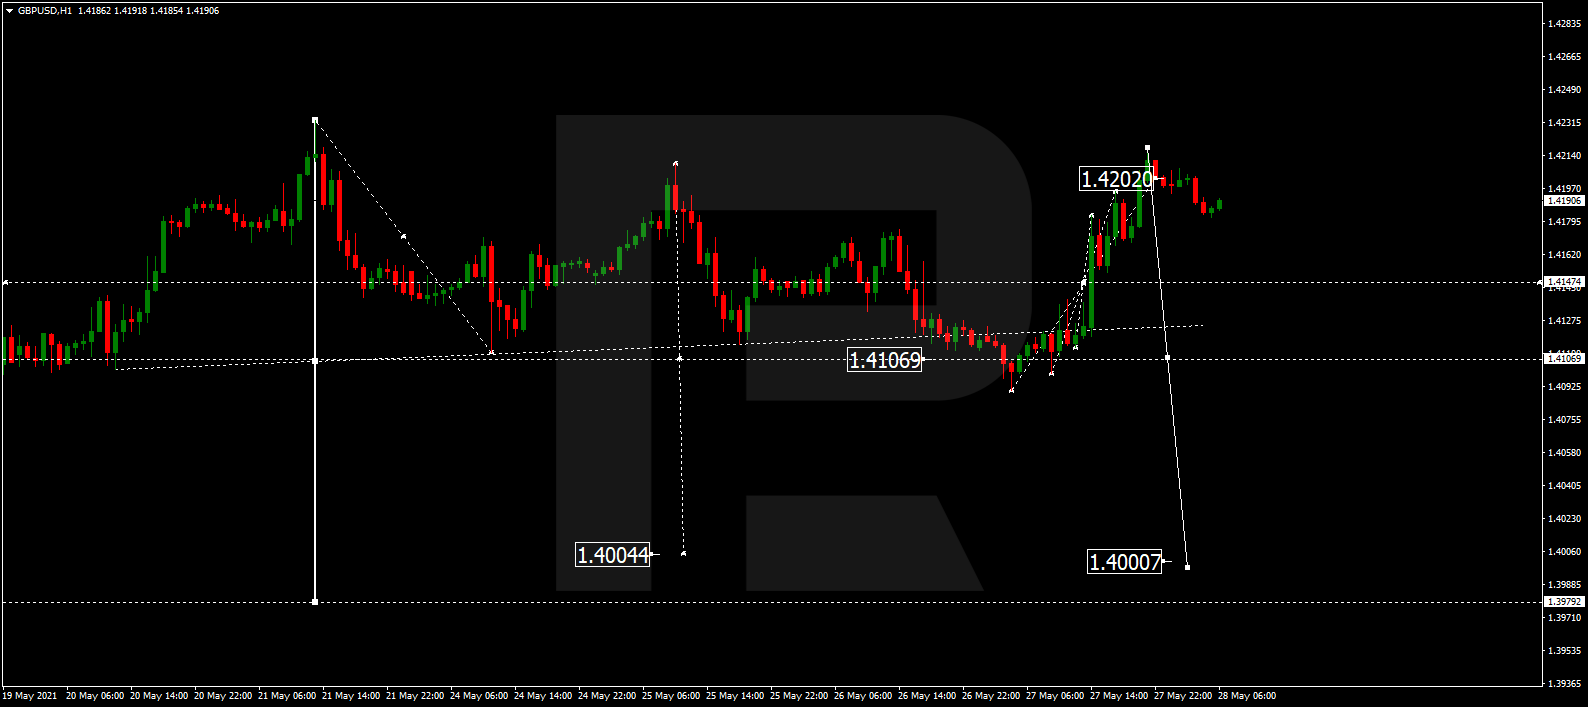
GBPUSD, “Great Britain Pound vs US Dollar”
GBPUSD is still consolidating around 1.4146; it has already expanded the range up to 1.4202. Today, the pair may fall to break the downside border at 1.4107 and then continue trading downwards with the first target at 1.4000.
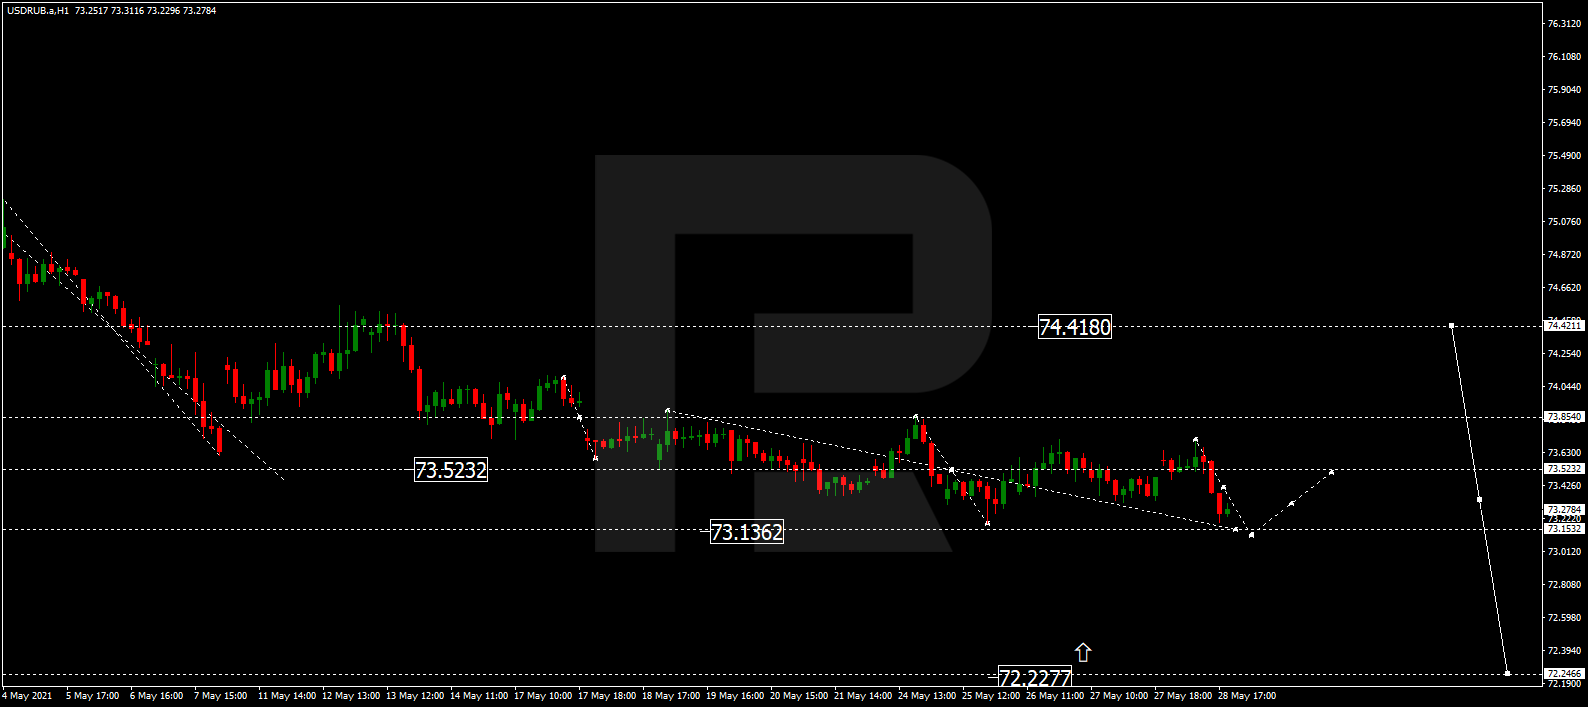
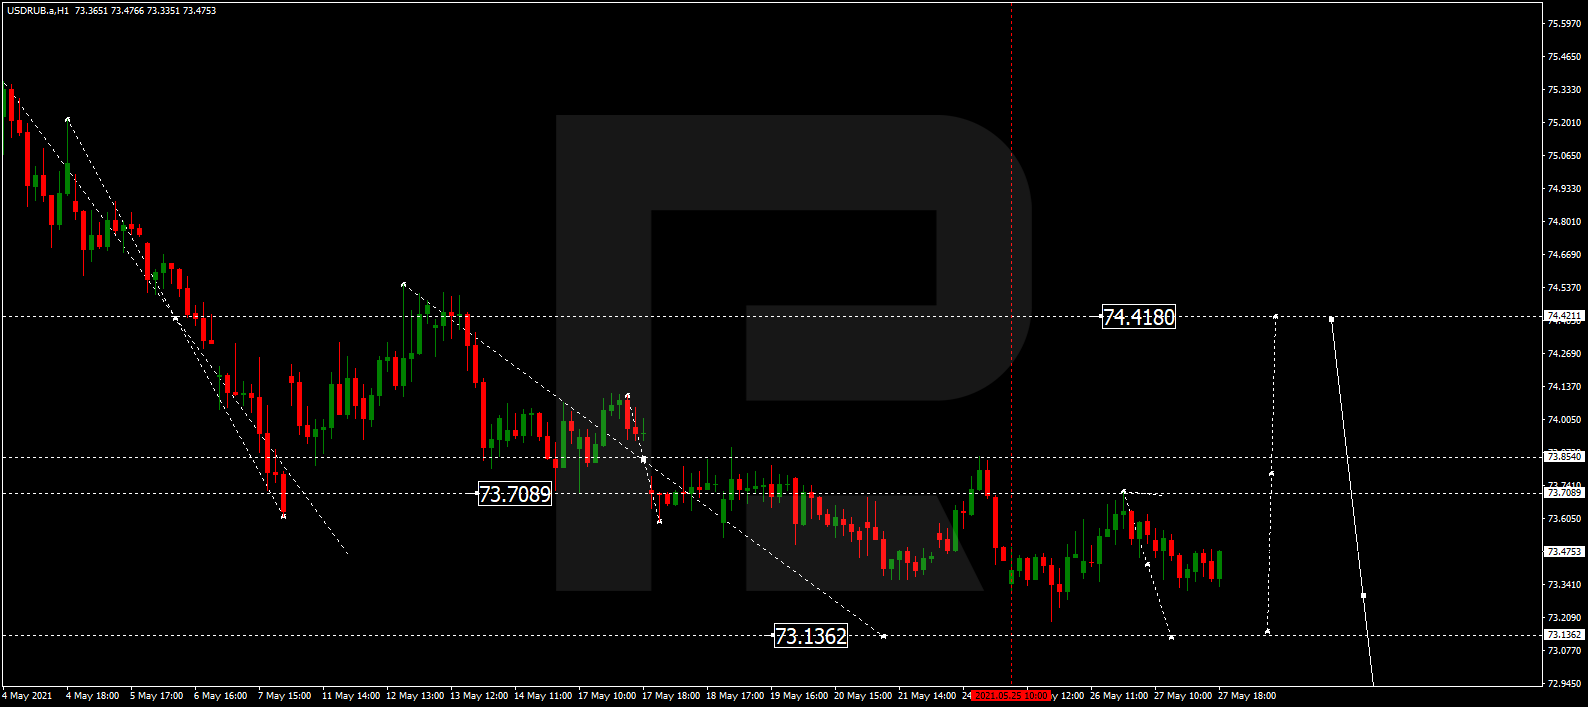
USDRUB, “US Dollar vs Russian Ruble”
After rebounding from 73.70, USDRUB is still falling towards 73.13. After that, the instrument may start another correction to reach 74.41 and then resume trading downwards with the target at 72.22.
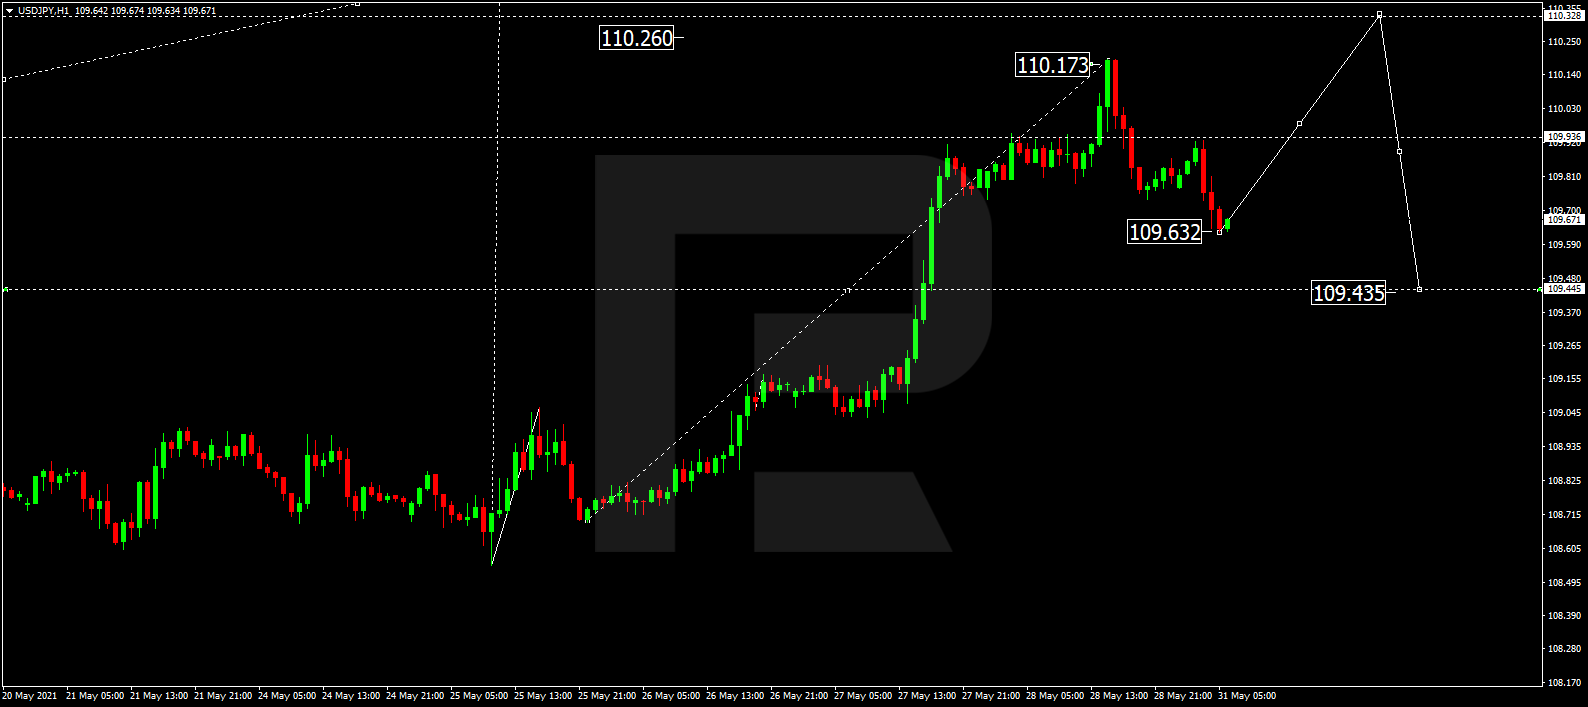
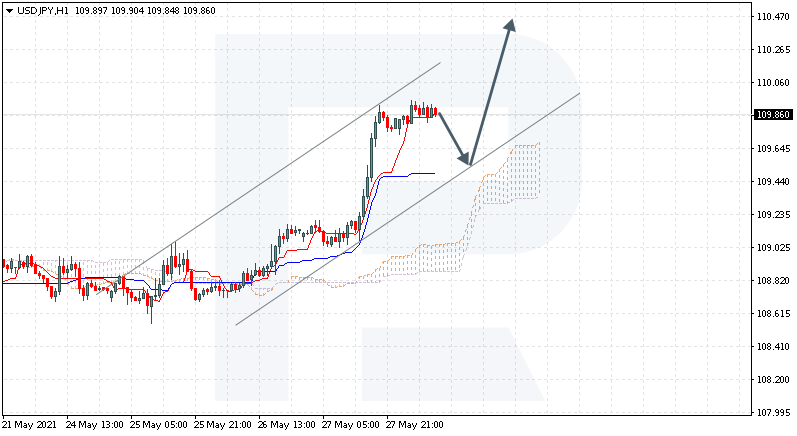
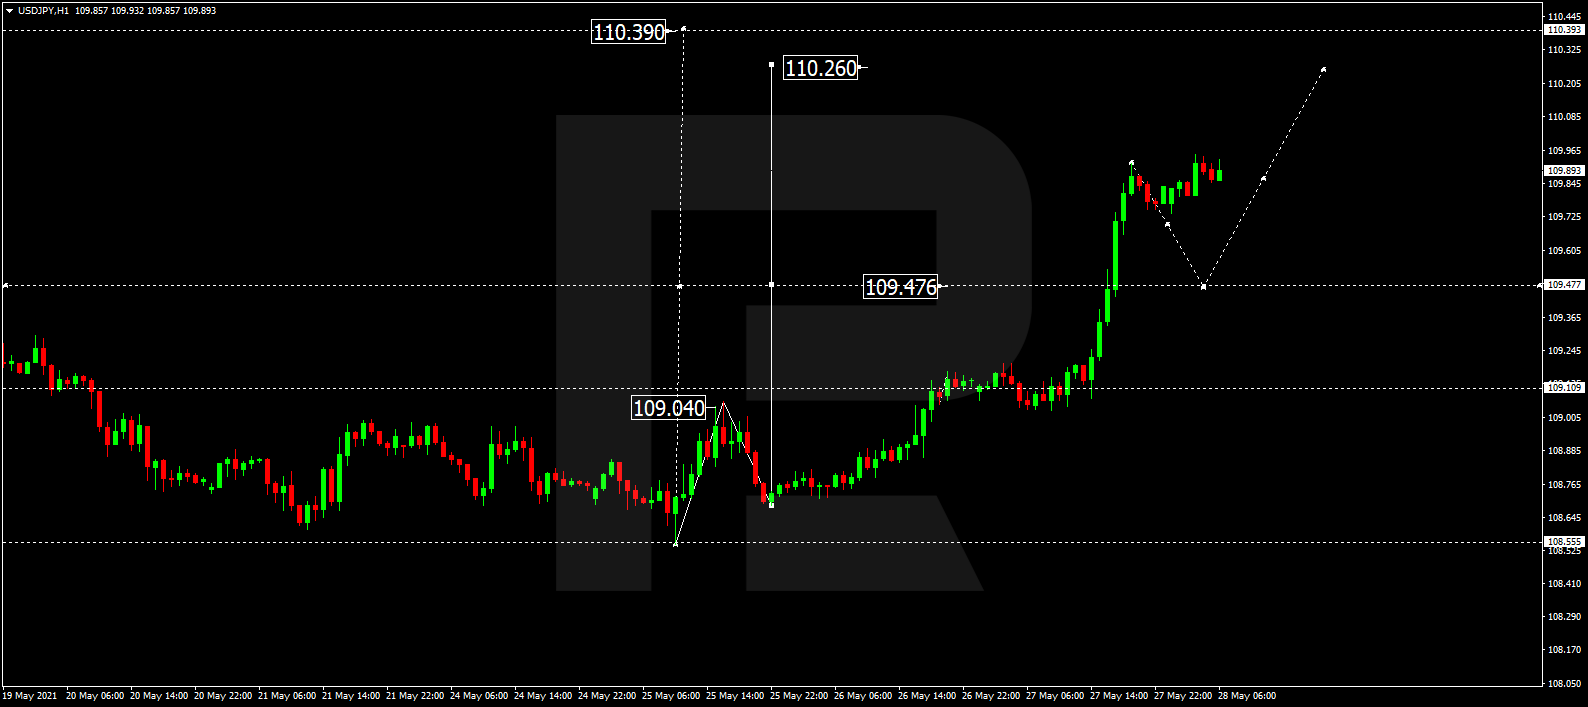
USDJPY, “US Dollar vs Japanese Yen”
After finishing the ascending impulse at 109.90, USDJPY is consolidating below it. Possibly, the pair may correct towards 109.50 and then form one more ascending structure with the short-term target at 110.25. Later, the market may start another correction to return to 109.50 and then resume growing to reach 110.40.
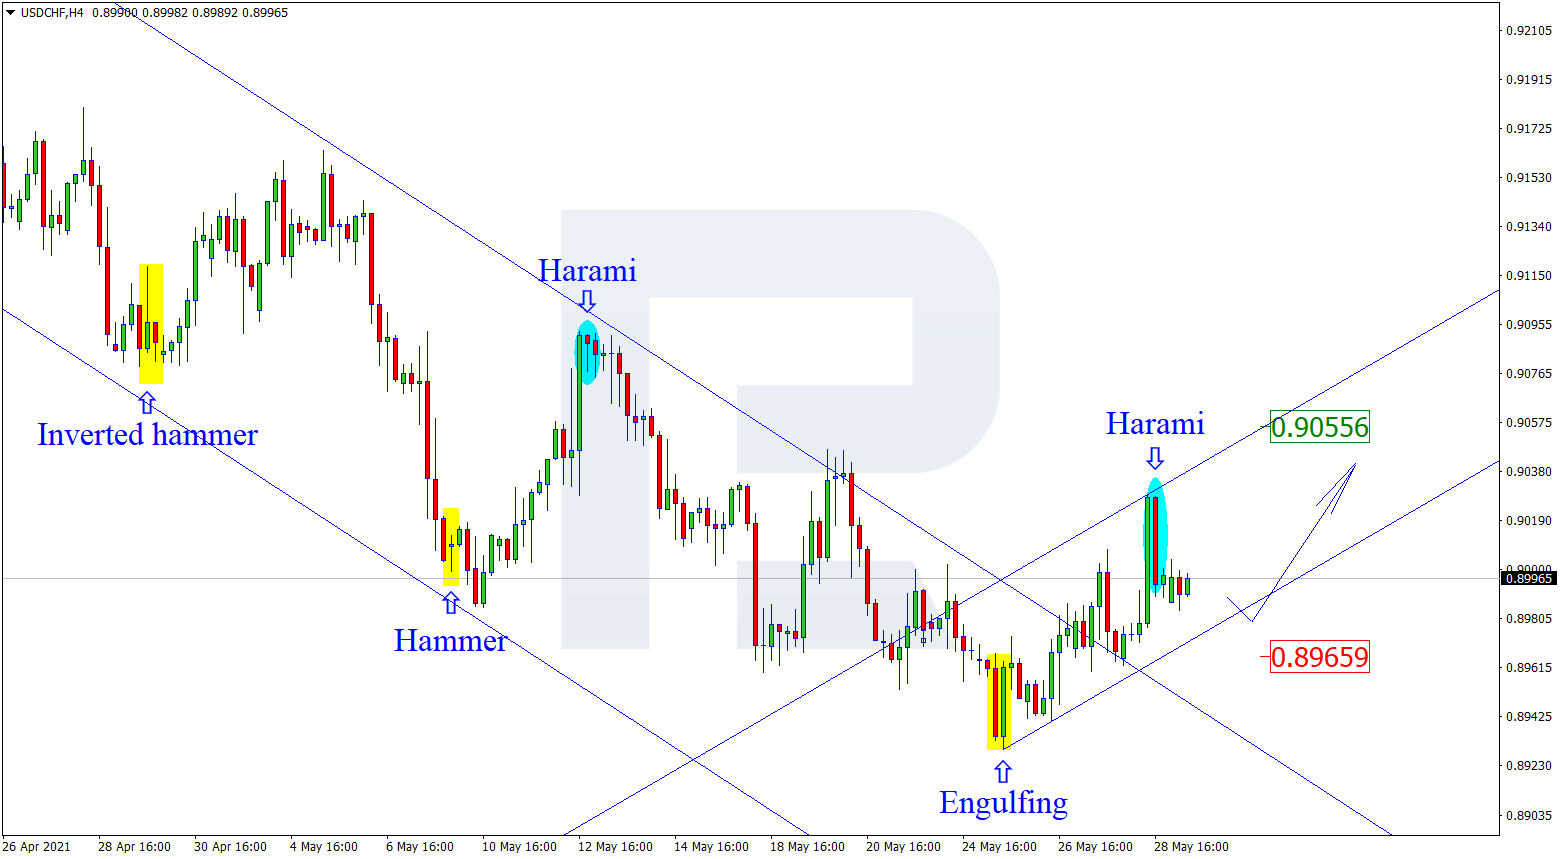
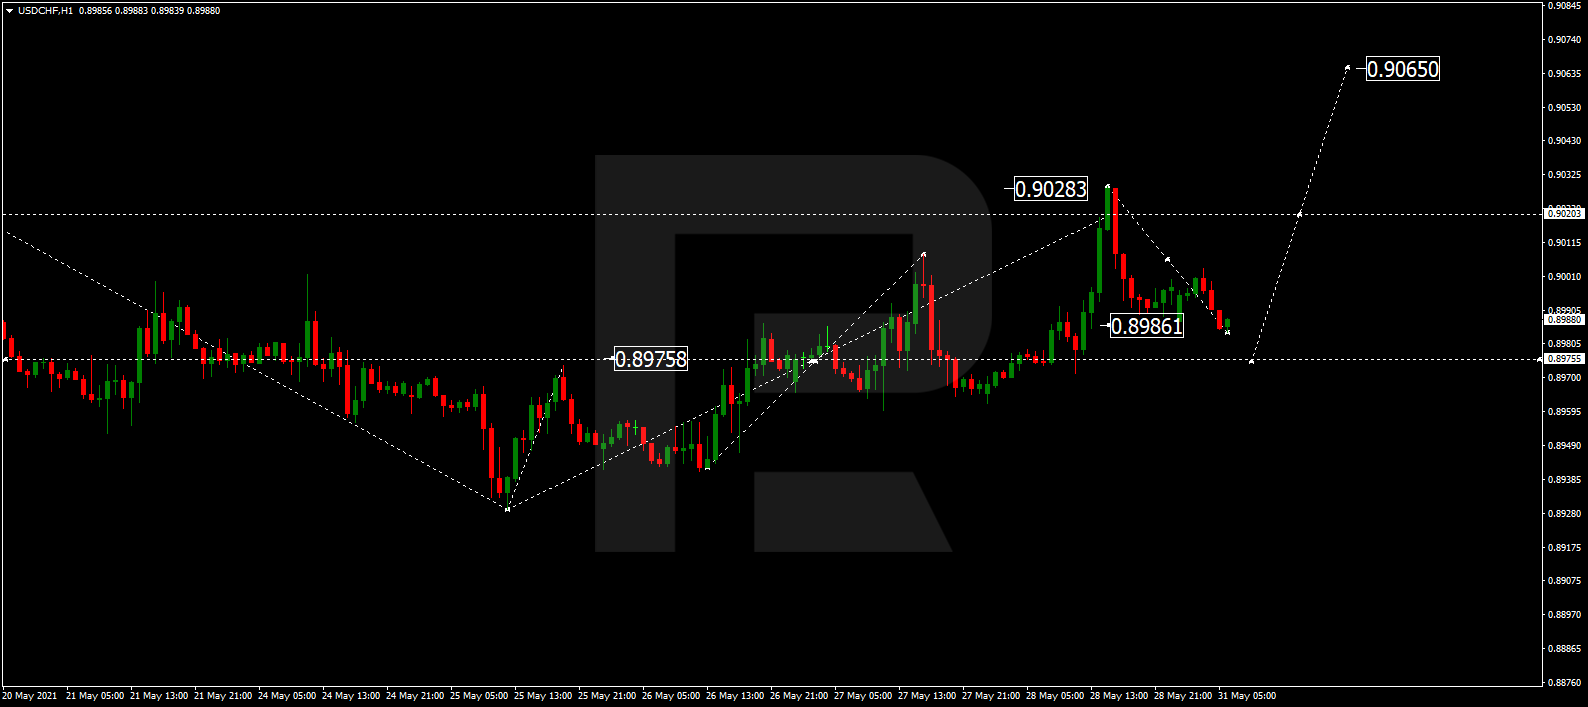
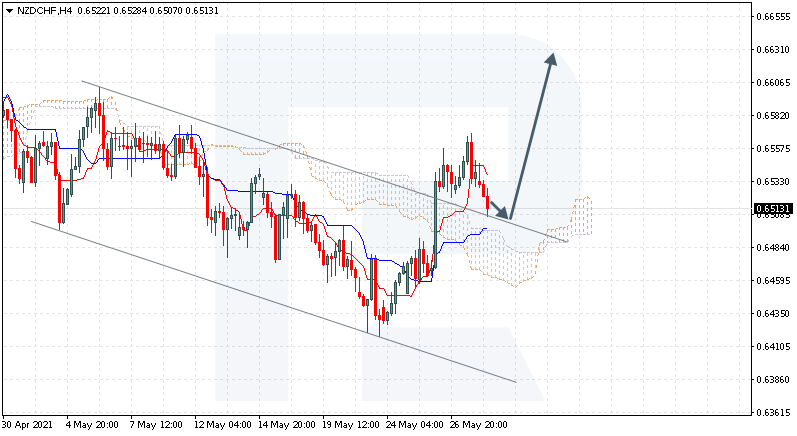
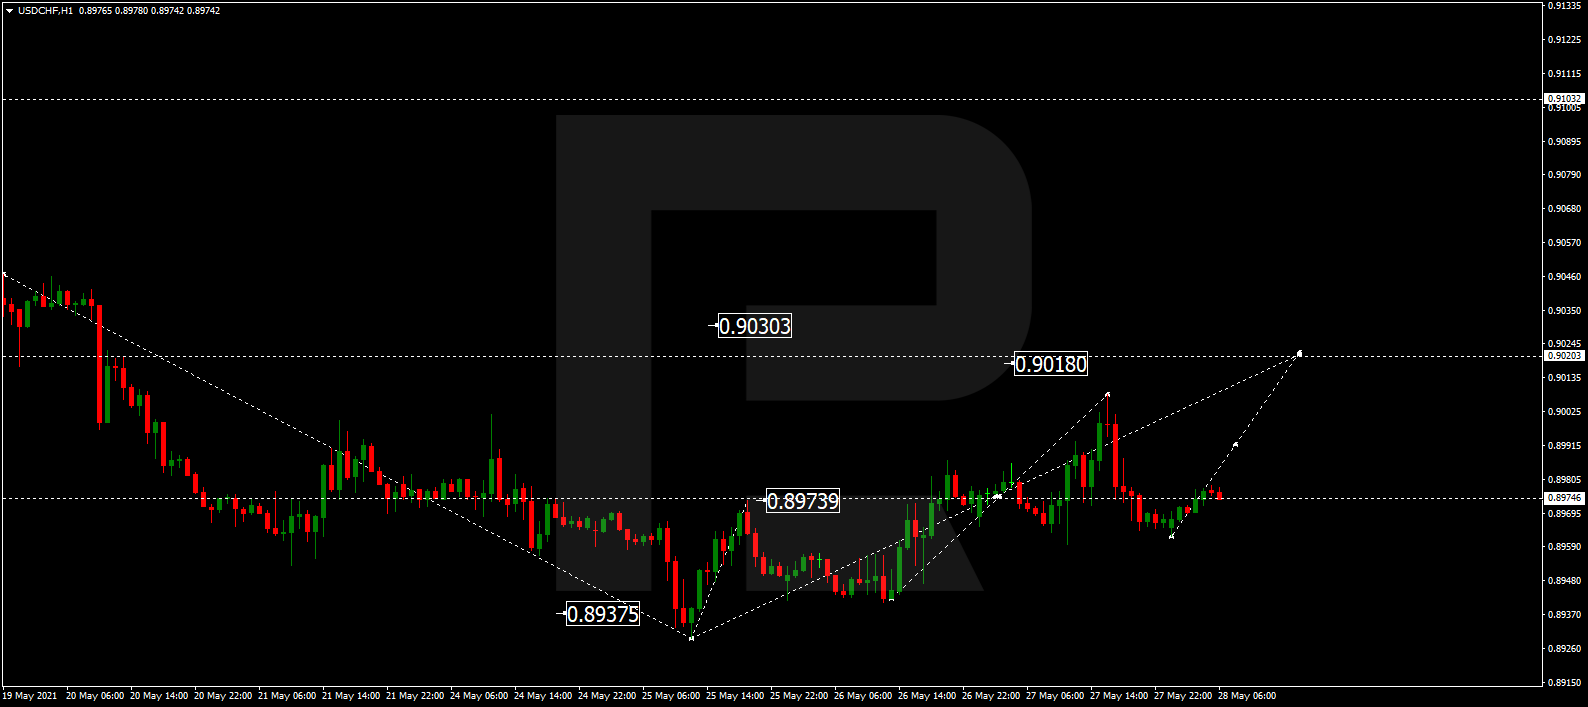
USDCHF, “US Dollar vs Swiss Franc”
After completing the ascending wave at 0.9006 along with the correction towards 0.8970, USDCHF is expected to resume trading upwards with the first target at 0.9019.
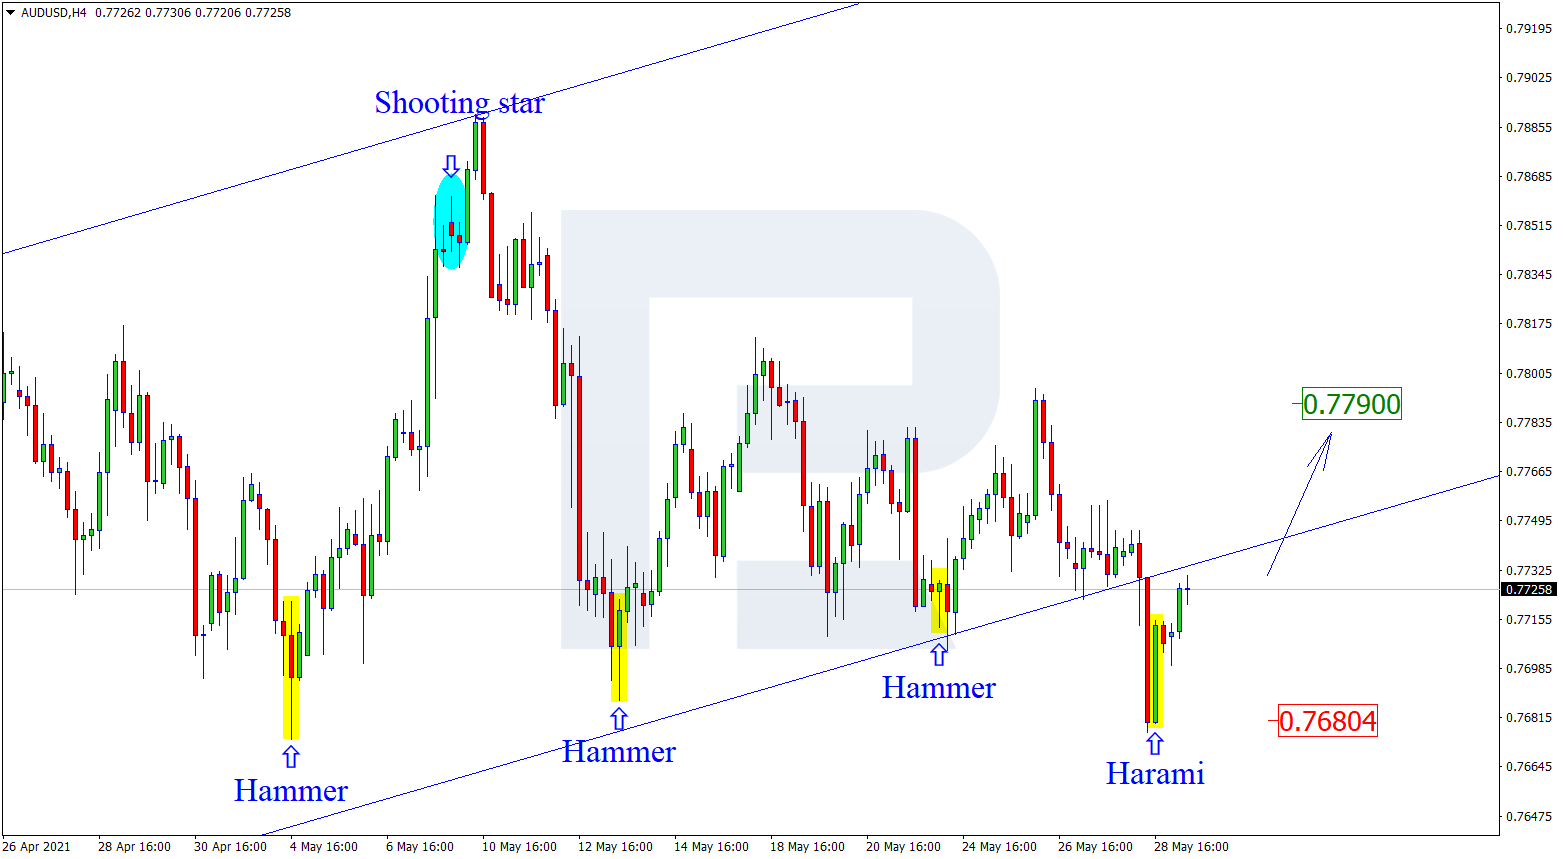
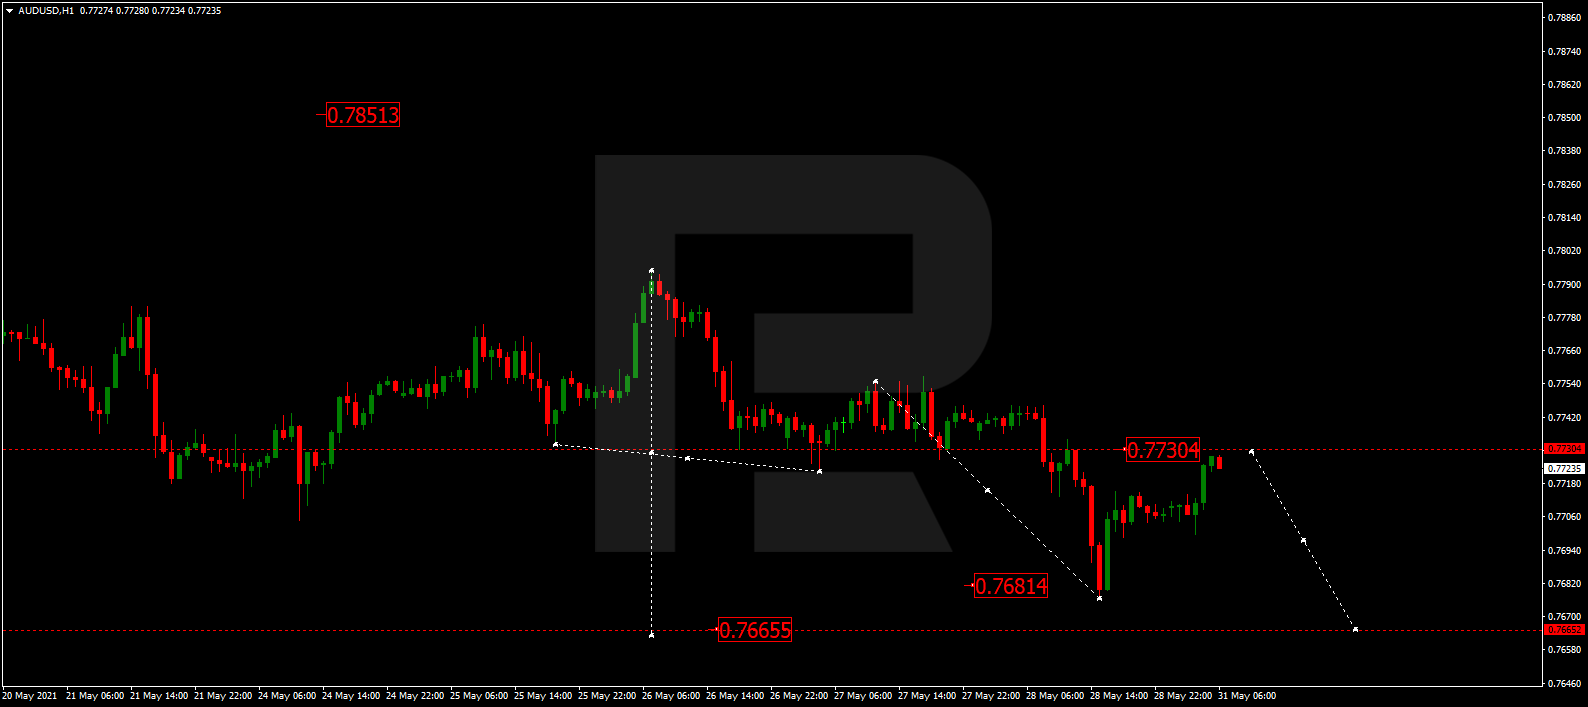
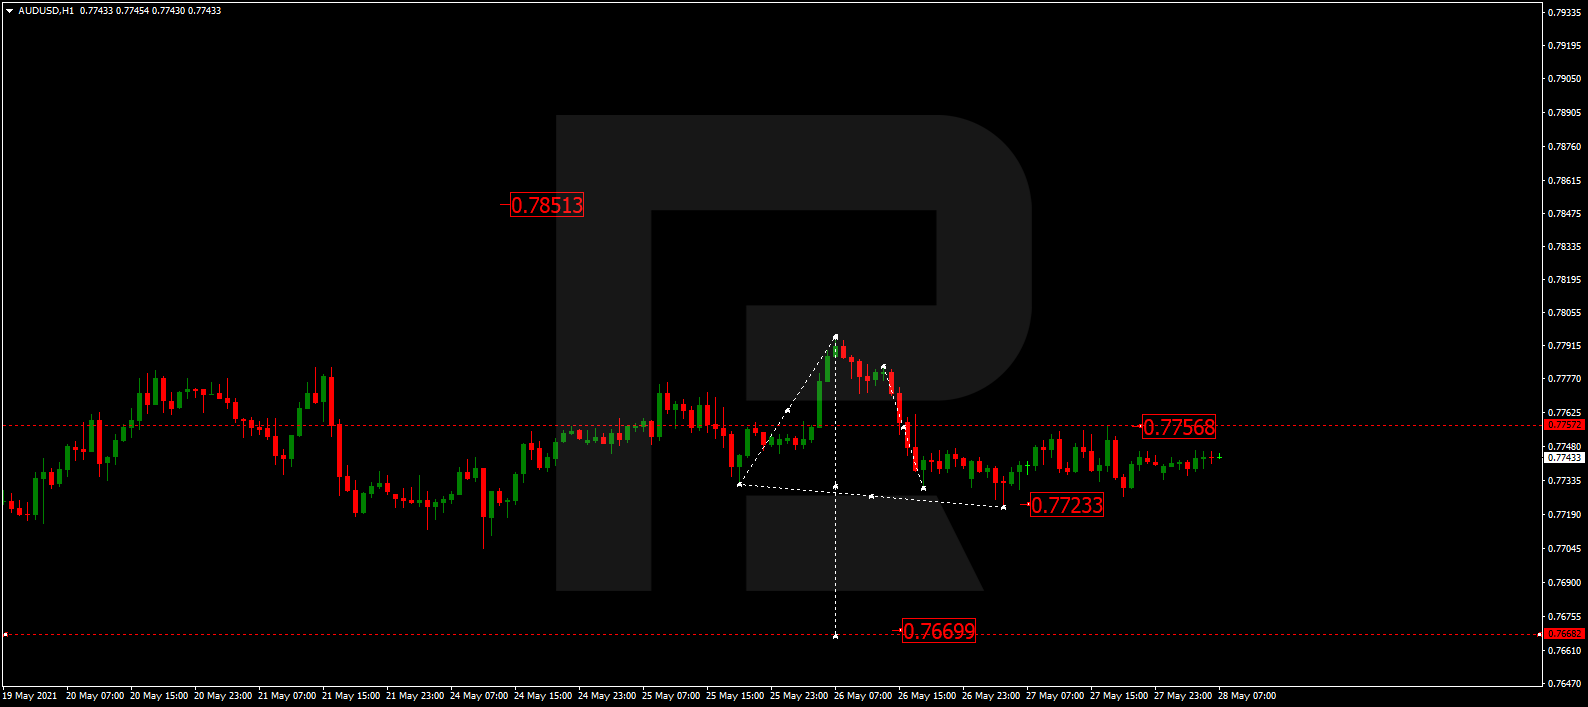
AUDUSD, “Australian Dollar vs US Dollar”
AUDUSD has finished the correctional wave at 0.7755. Today, the pair may resume falling to break 0.7722 and then continue trading downwards with the target at 0.7669.
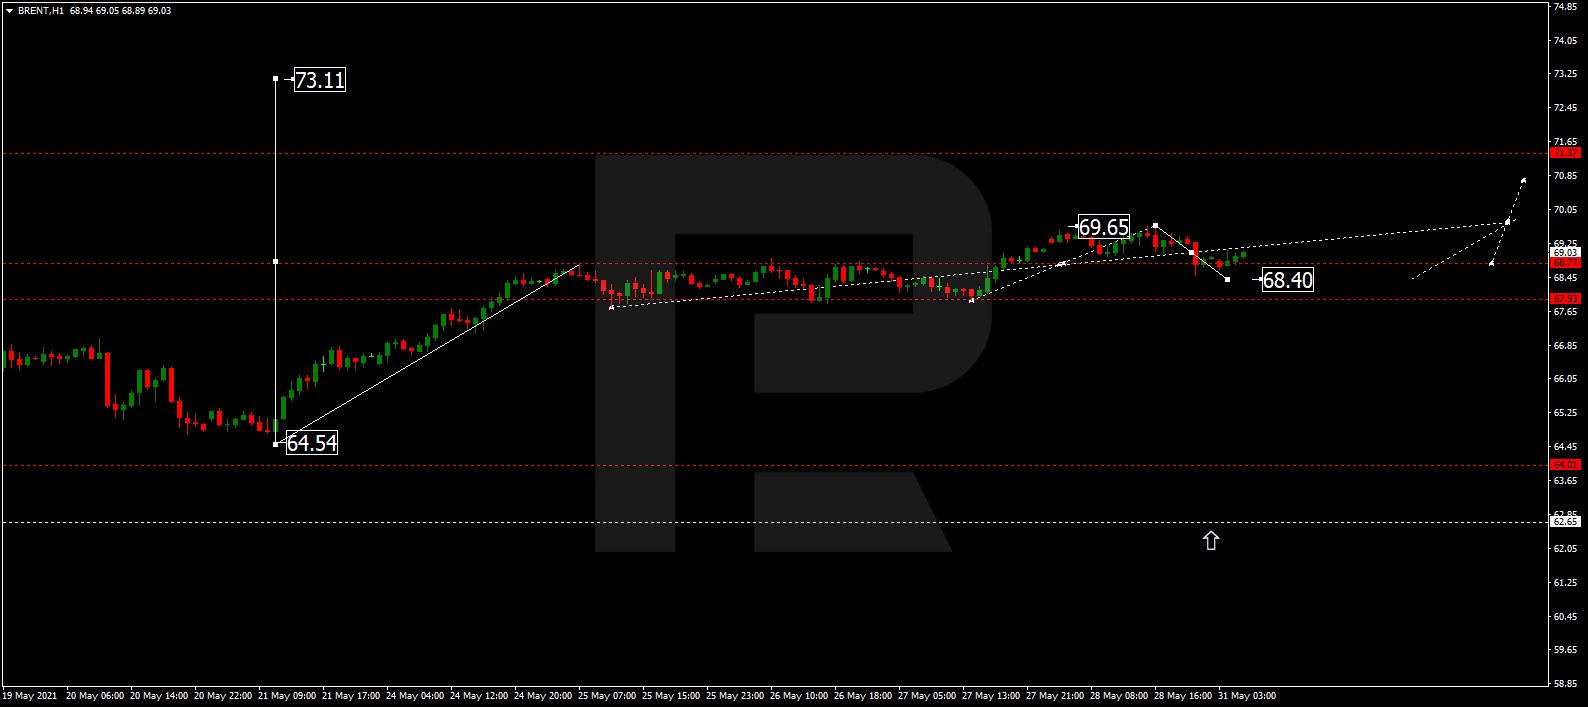
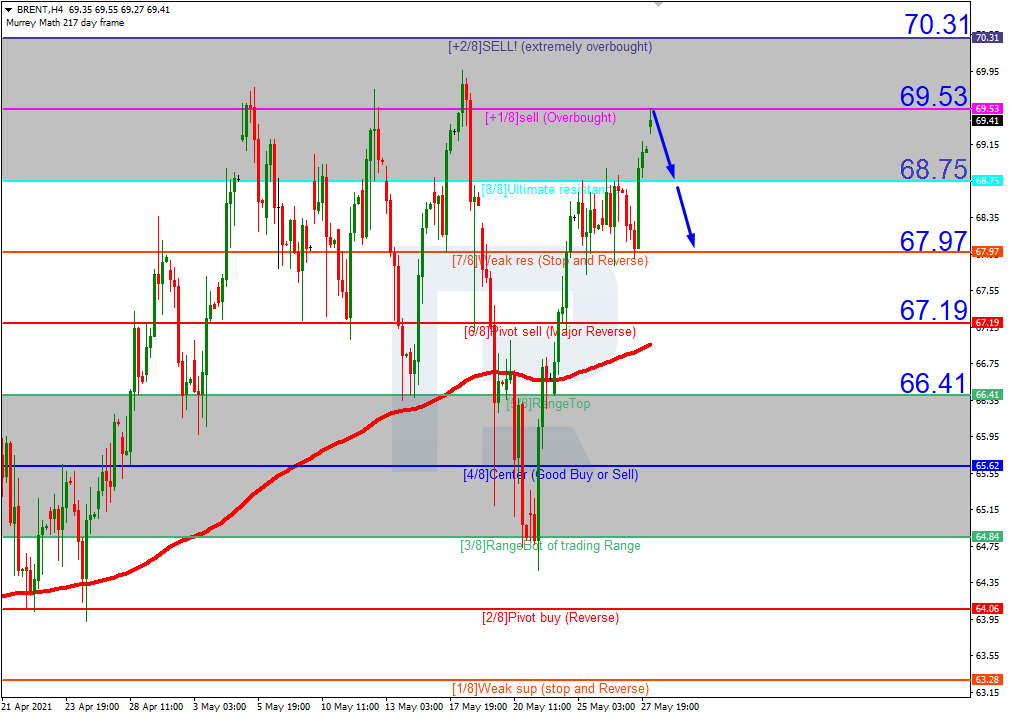
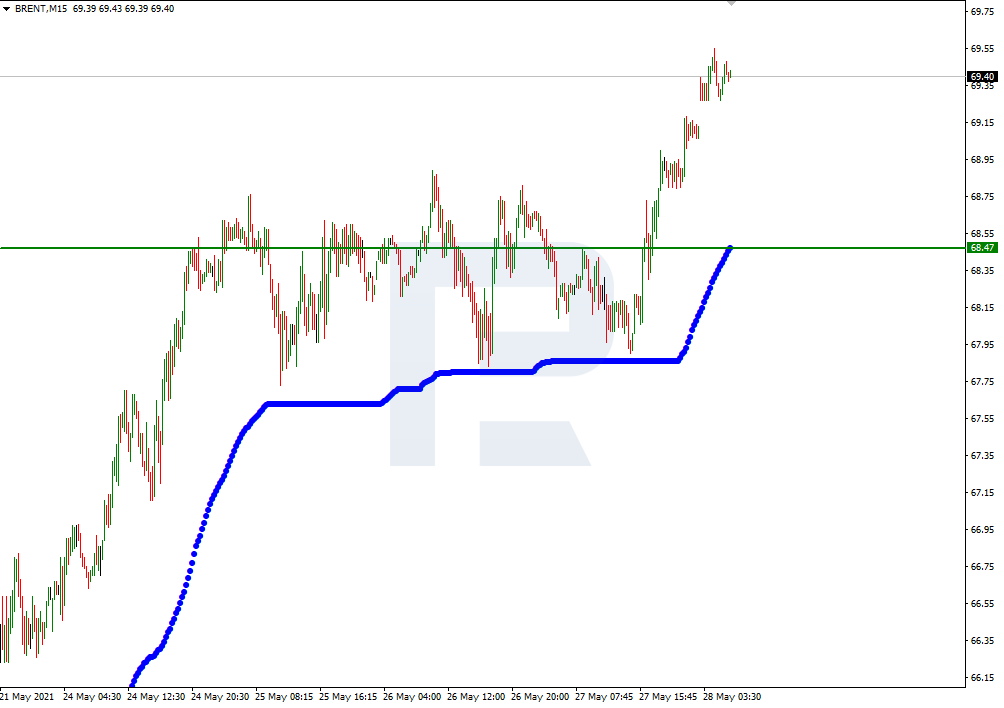
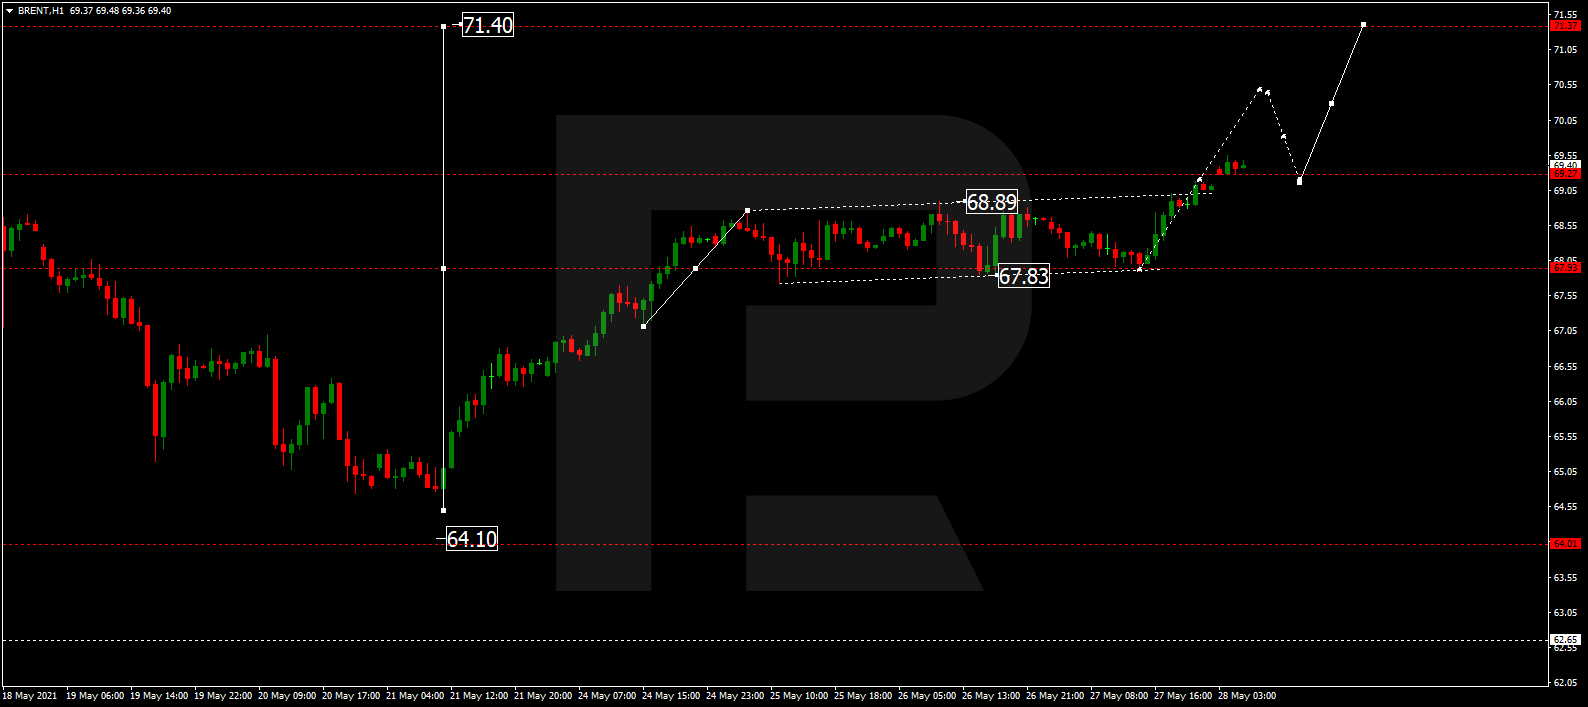
BRENT
After rebounding from 67.83 and then breaking 69.00, Brent is still moving upwards; right now, it is consolidating around the latter level. If later the price breaks this range to the upside, the market may form one more ascending structure with the target at 71.40.
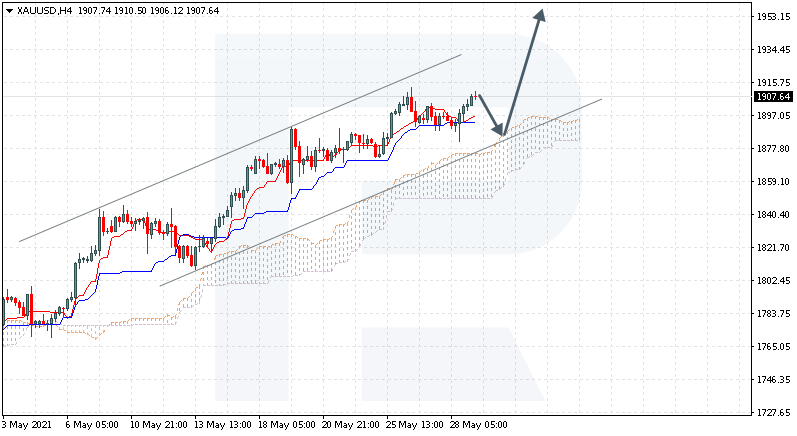
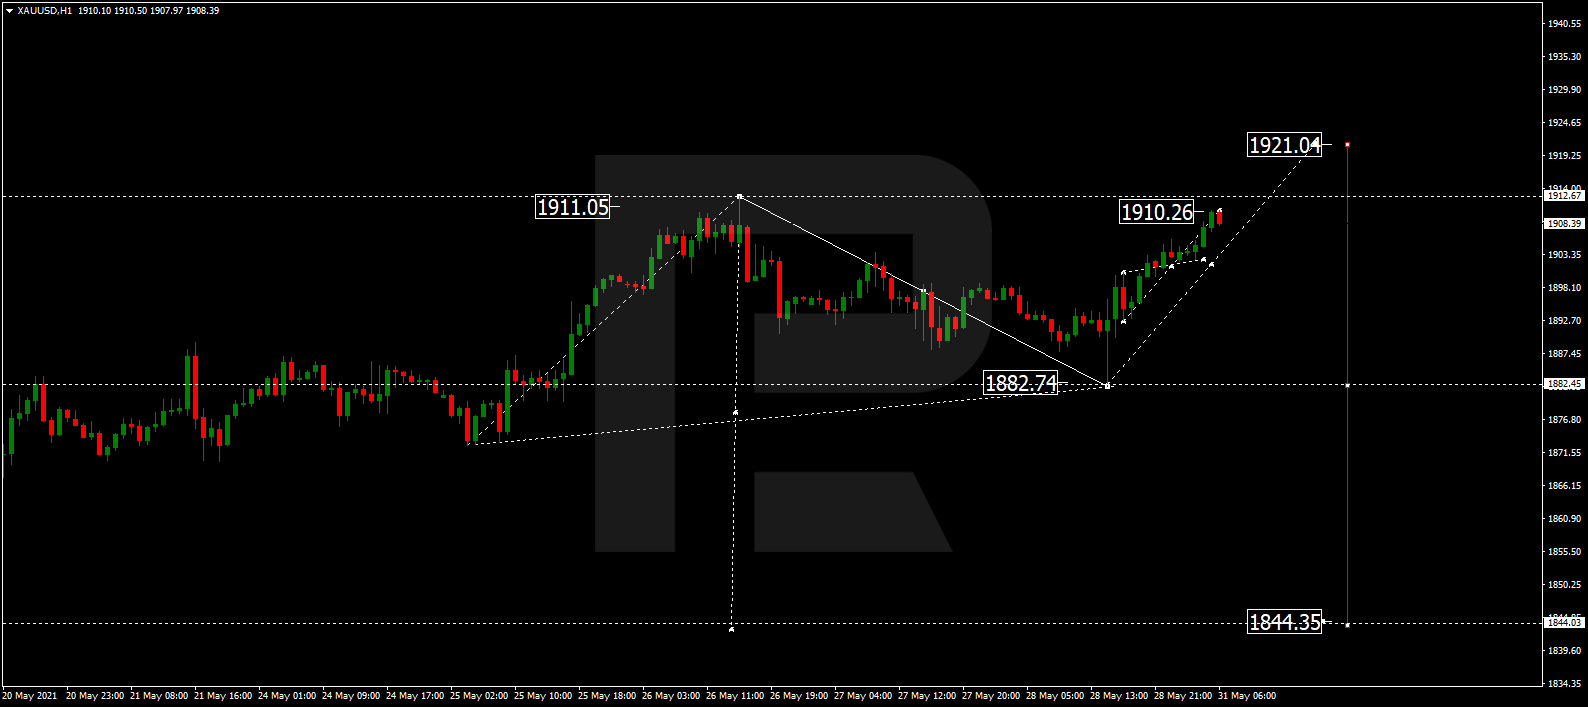
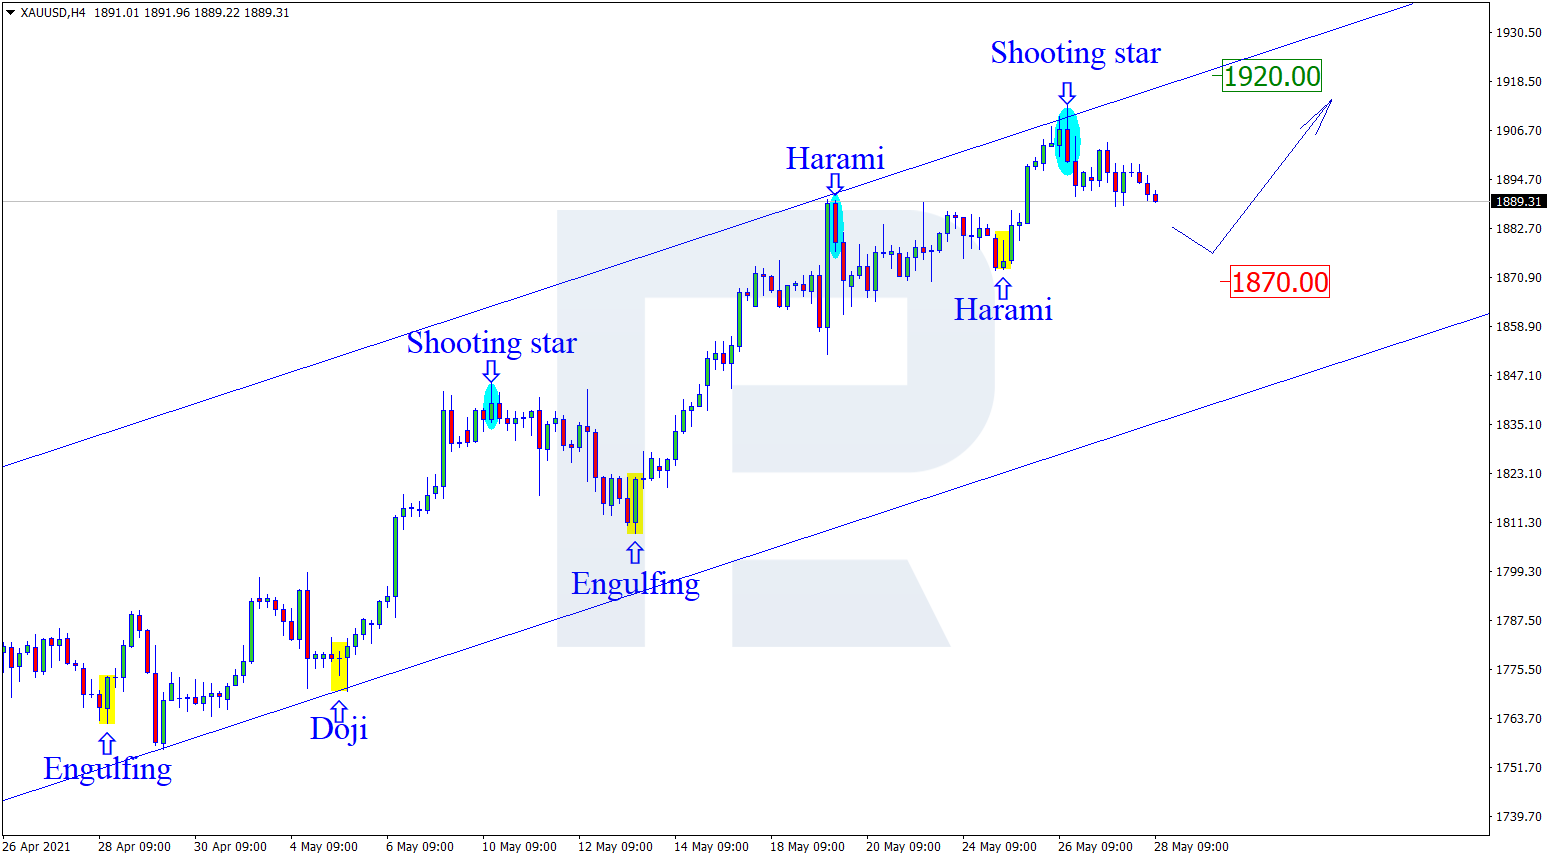
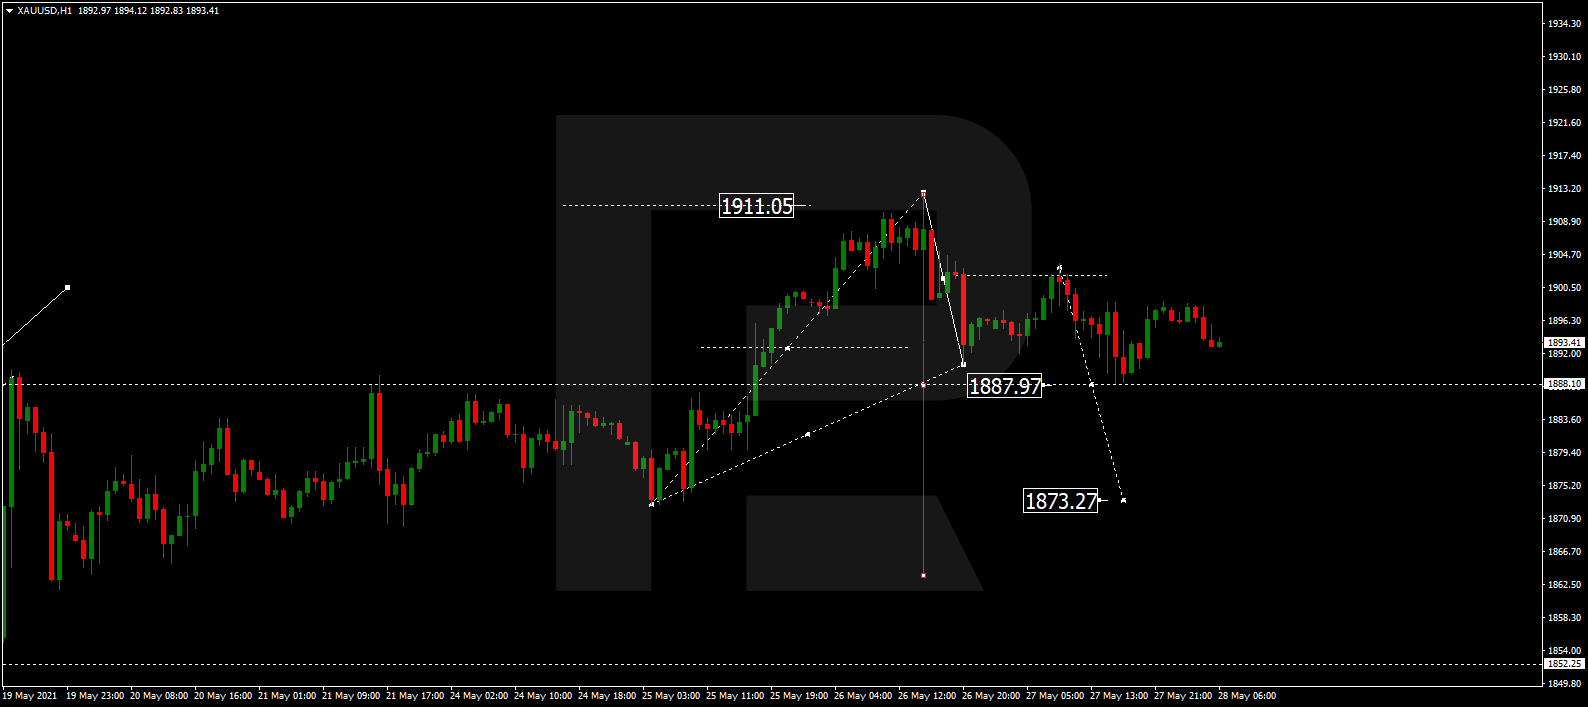
XAUUSD, “Gold vs US Dollar”
After finishing the descending impulse at 1887.97 along with the correction towards 1897.70, Gold is expected to form a new descending structure to break 1888.00. After that, the instrument may continue trading downwards with the short-term target at 1873.27.
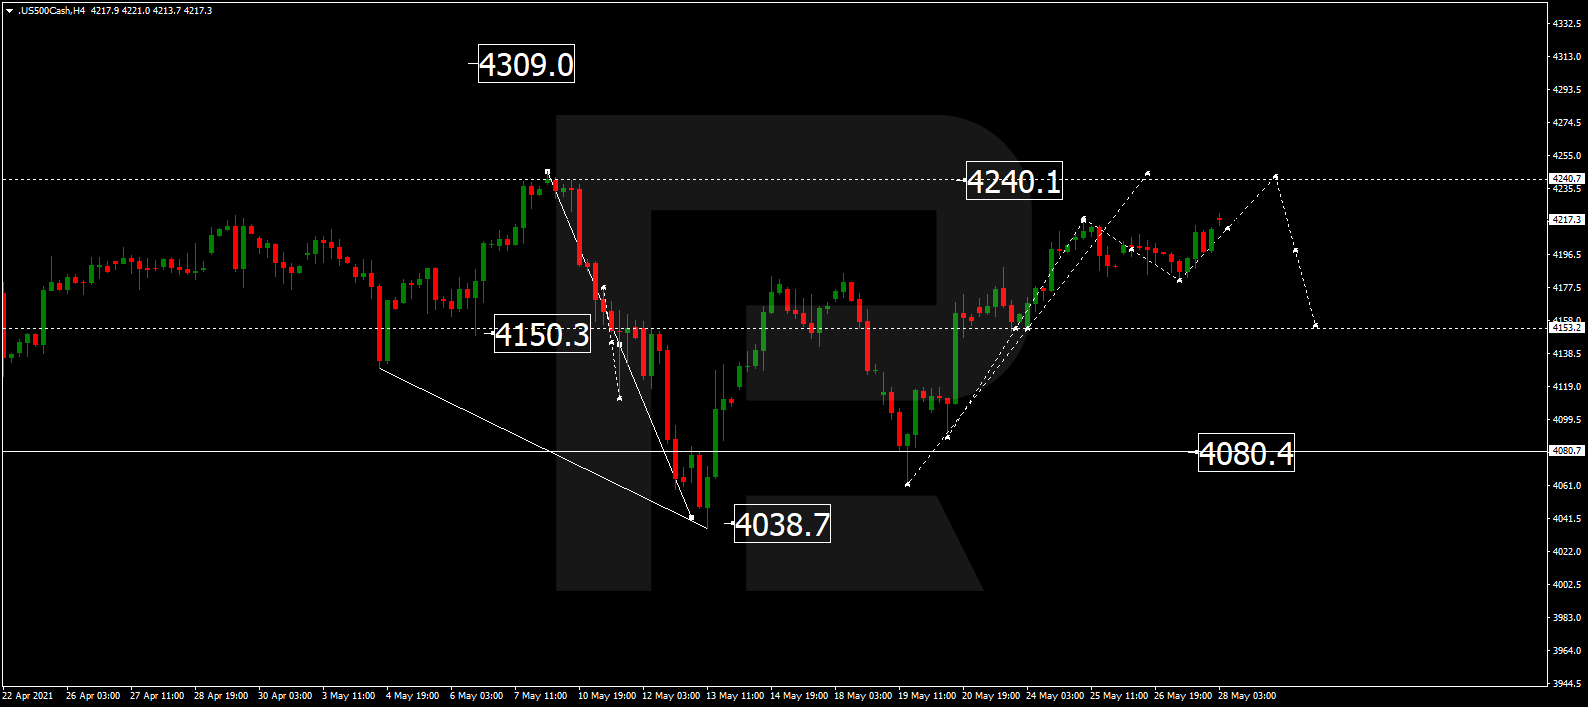
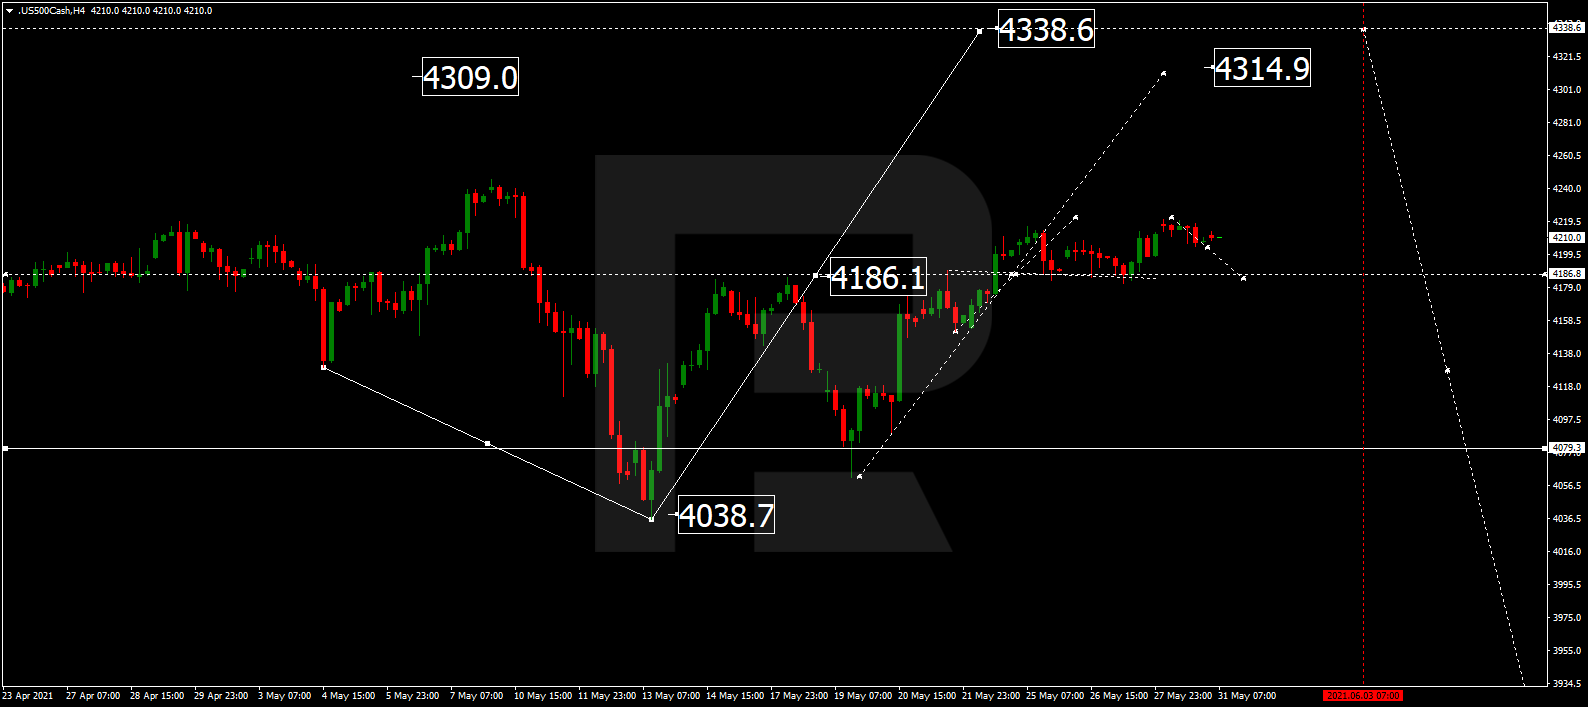
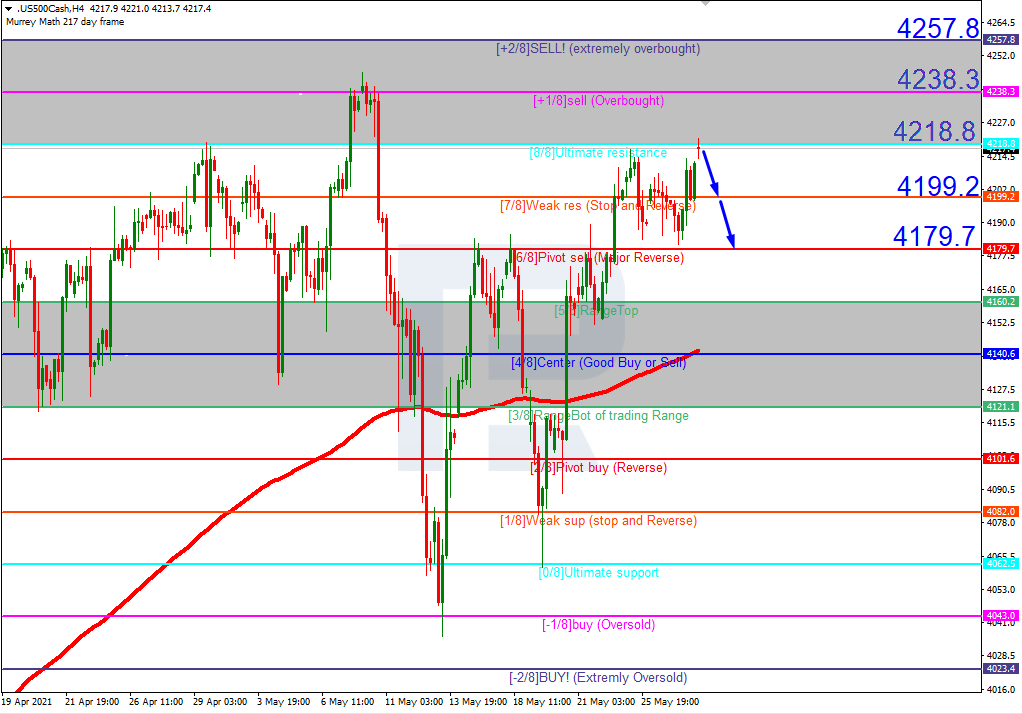
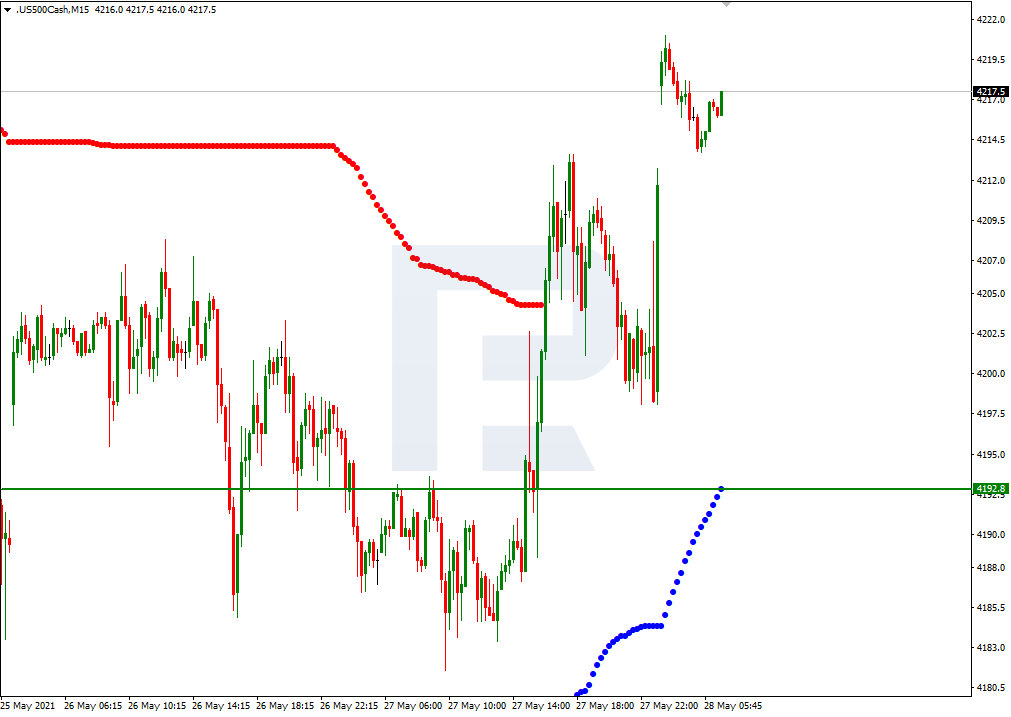
S&P 500
The S&P index is still consolidating around 4150.0. Today, the asset may expand the range up to 4240.1 and then resume trading downwards to reach the downside border of the range at 4080.4. After breaking it, the instrument may continue falling with the target at 4000.0.