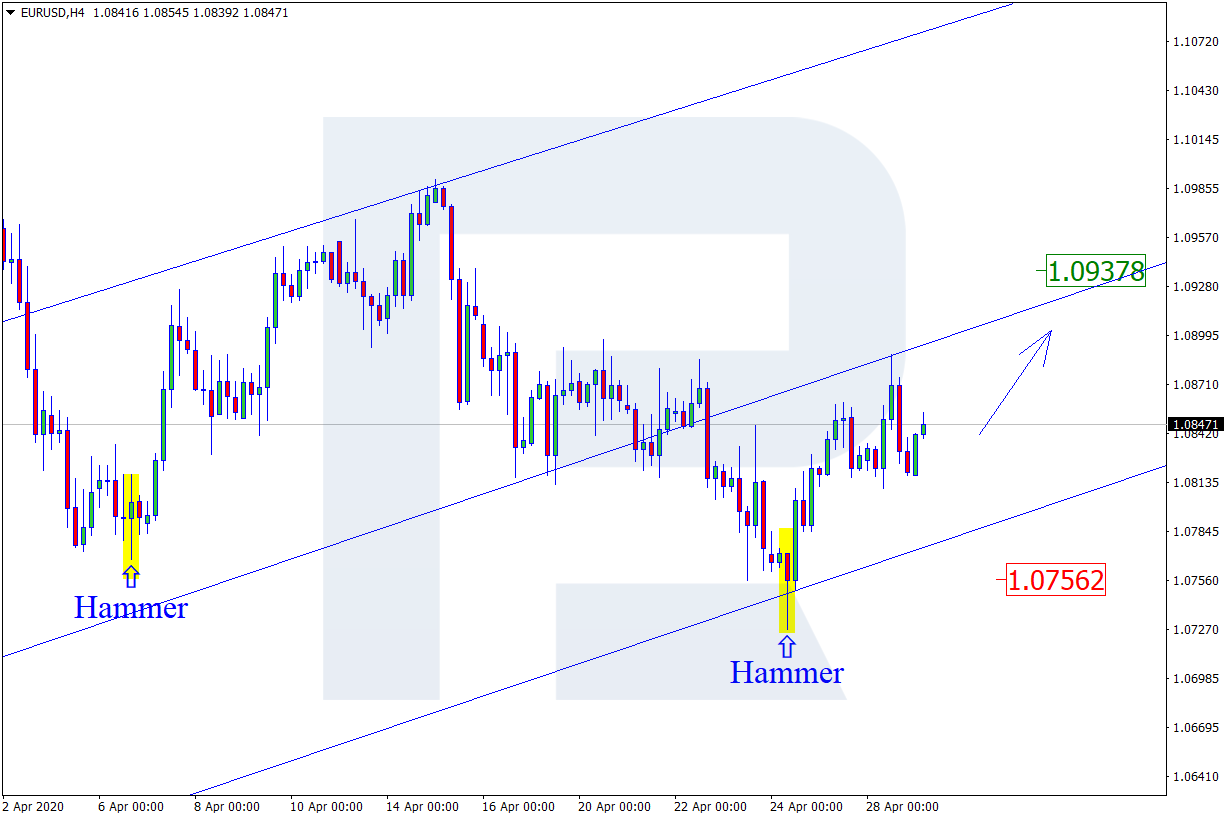
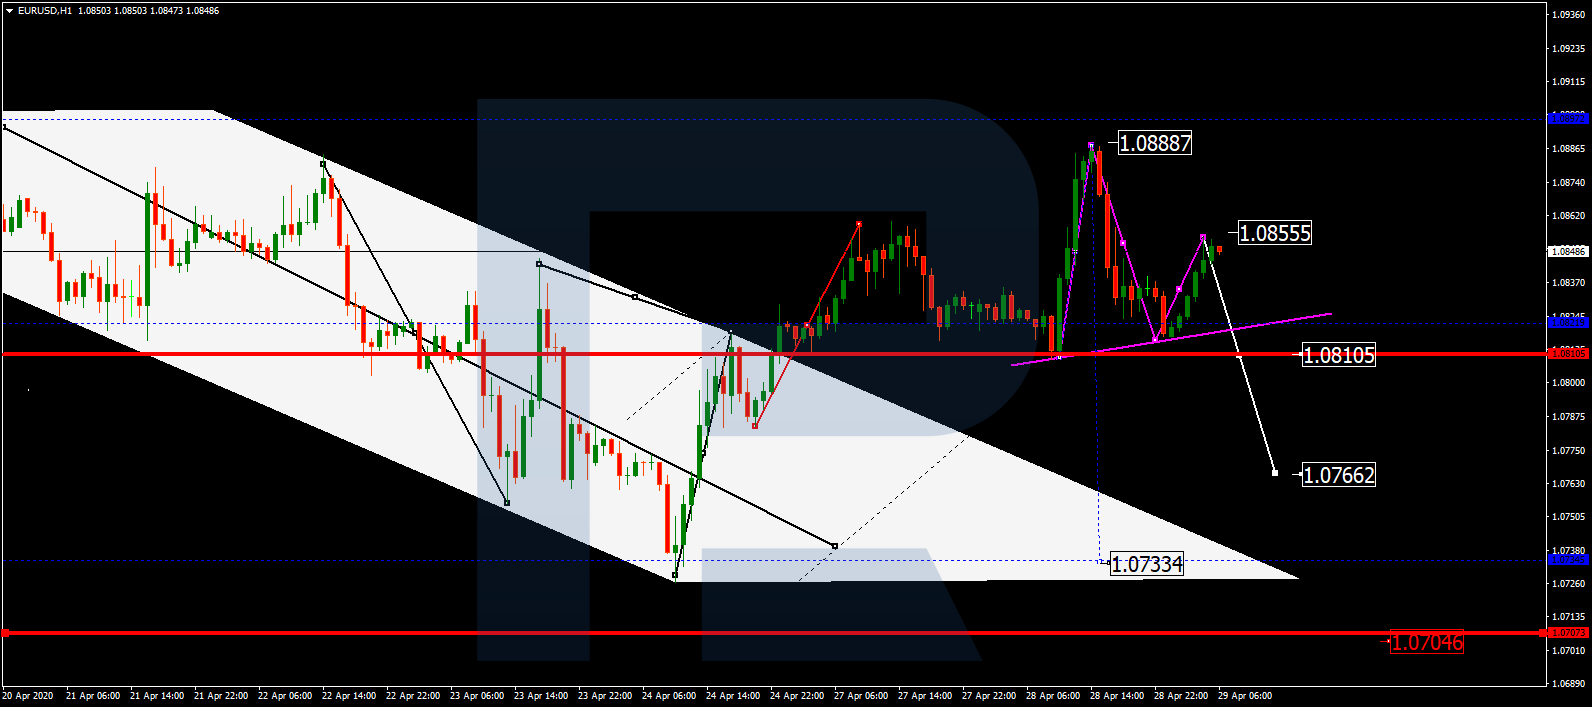
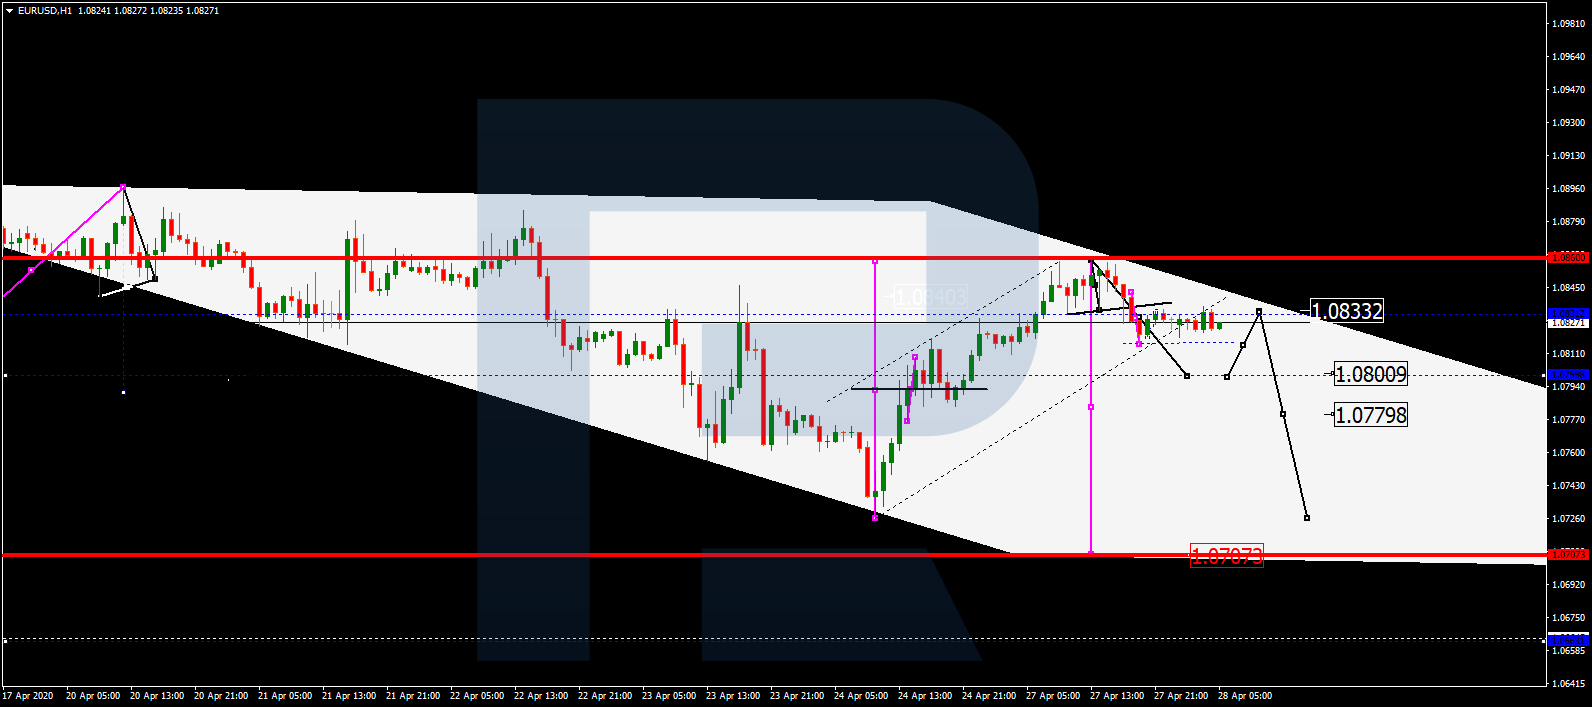
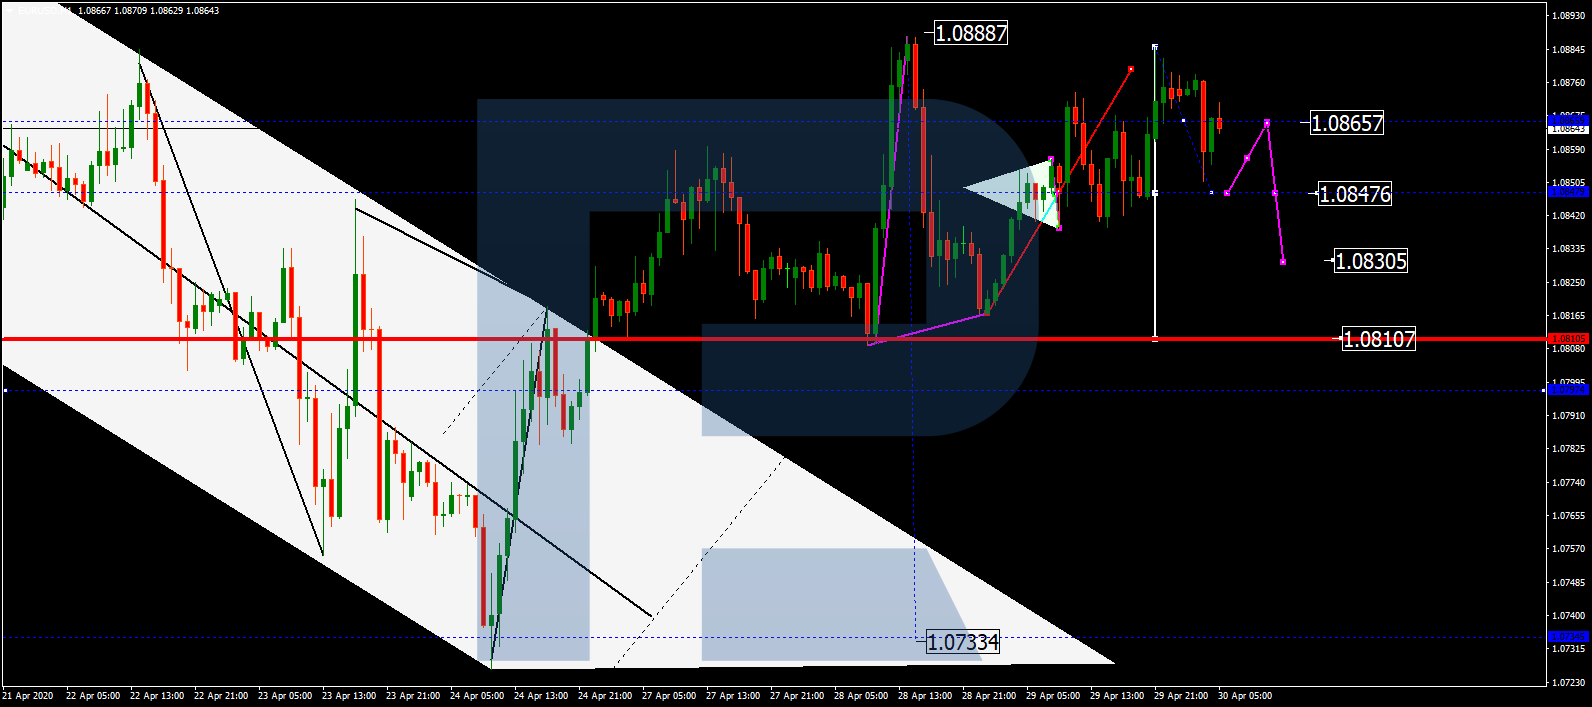
EURUSD, “Euro vs US Dollar”
After forming the consolidation range around 1.0847 and breaking it to the upside, EURUSD has reached 1.0880; right now, it is falling to return to 1.0847. Possibly, today the pair may reach this level and then grow towards 1.0865, thus forming a new consolidation range. If later the price breaks this range to the upside, the market may form one more ascending to reach 1.0915; if to the downside – start a new decline to break 1.0800 and then continue trading inside the downtrend with the target at 1.0740.

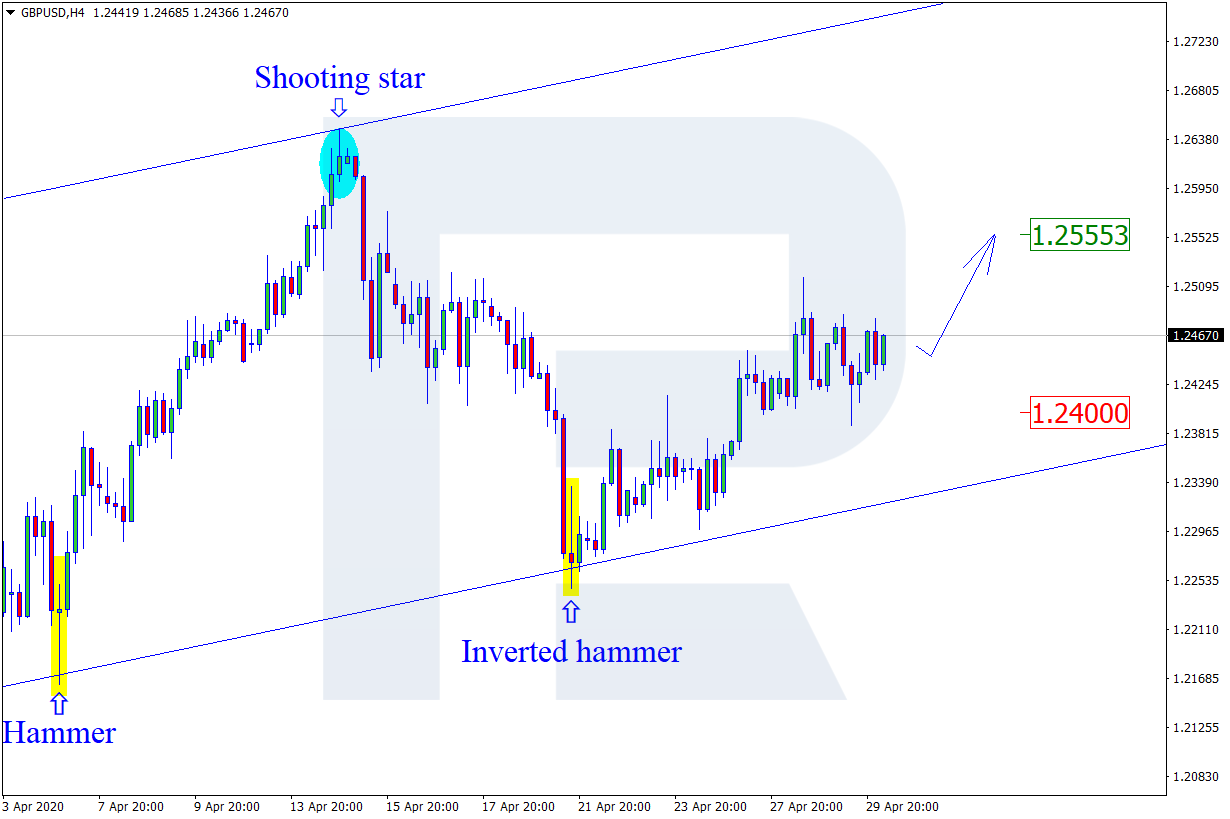
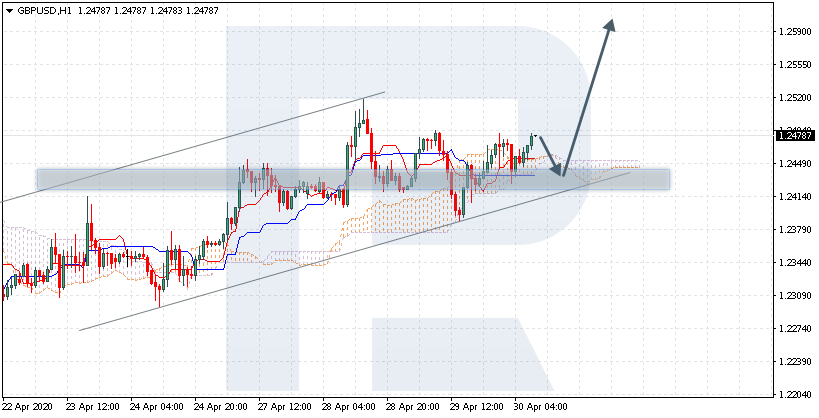
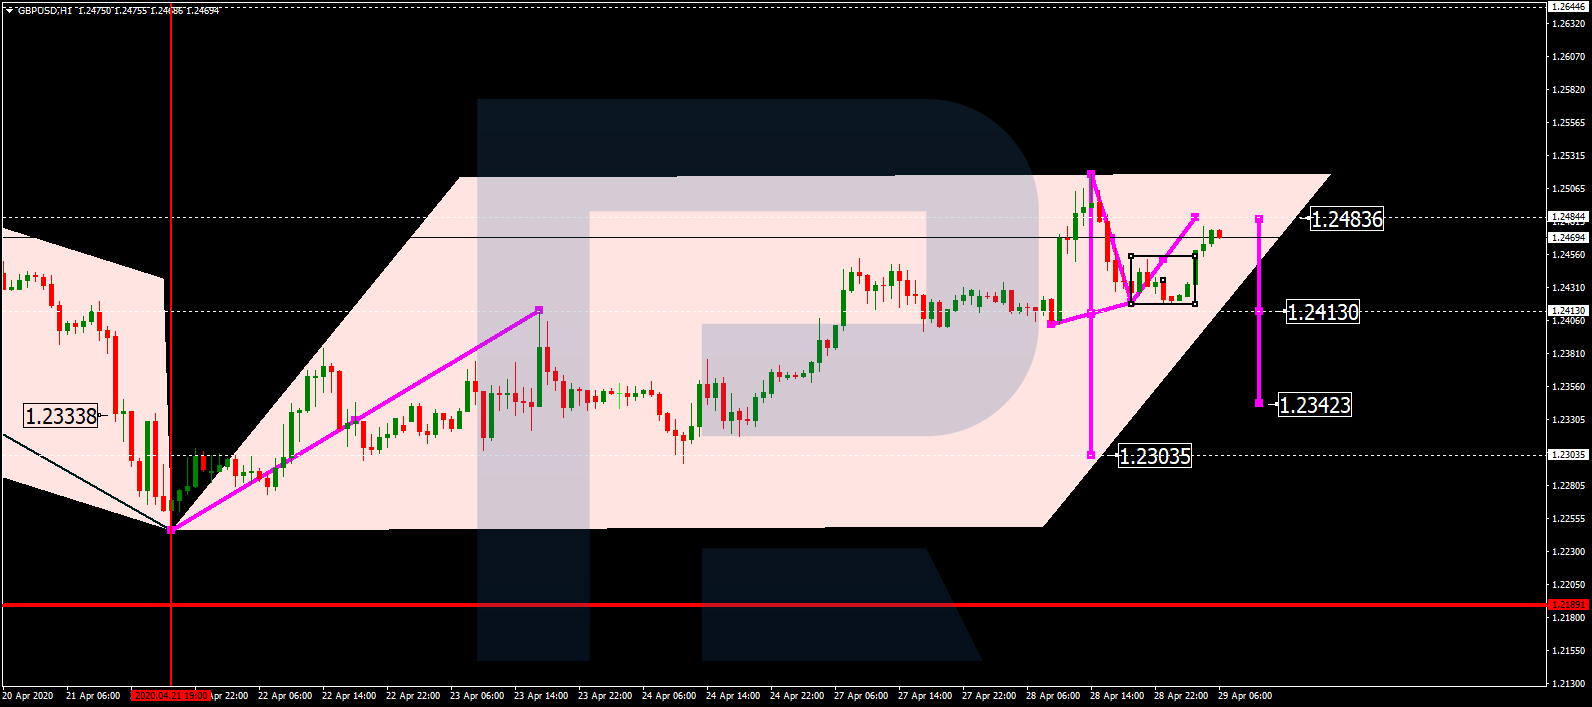
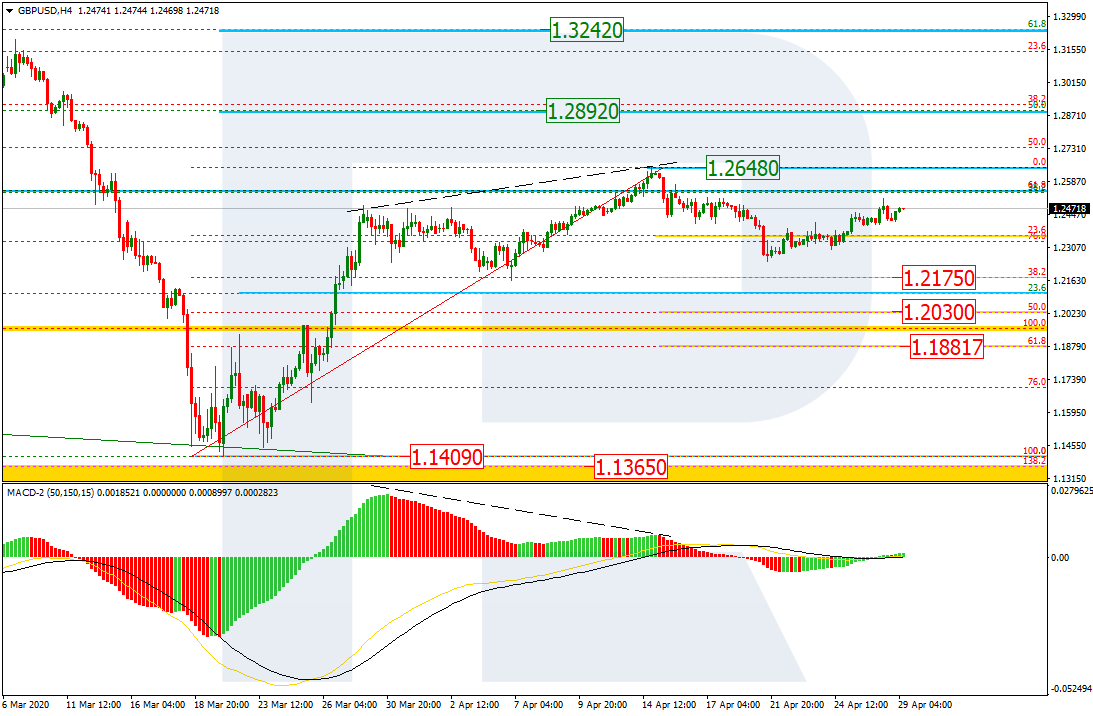
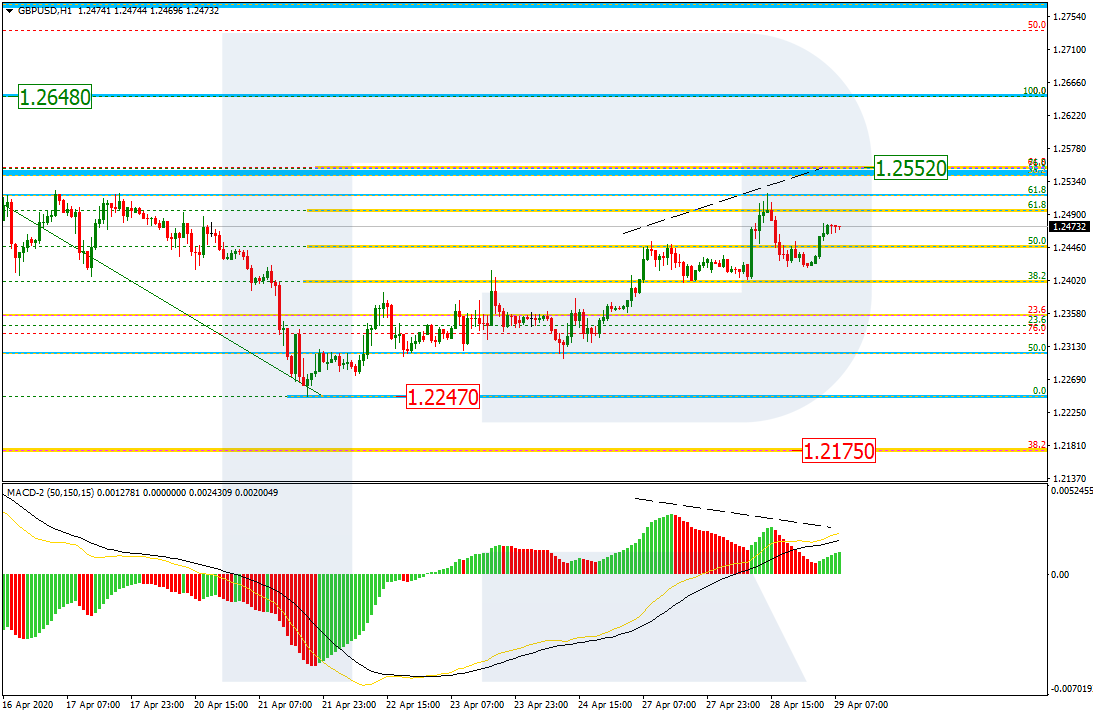
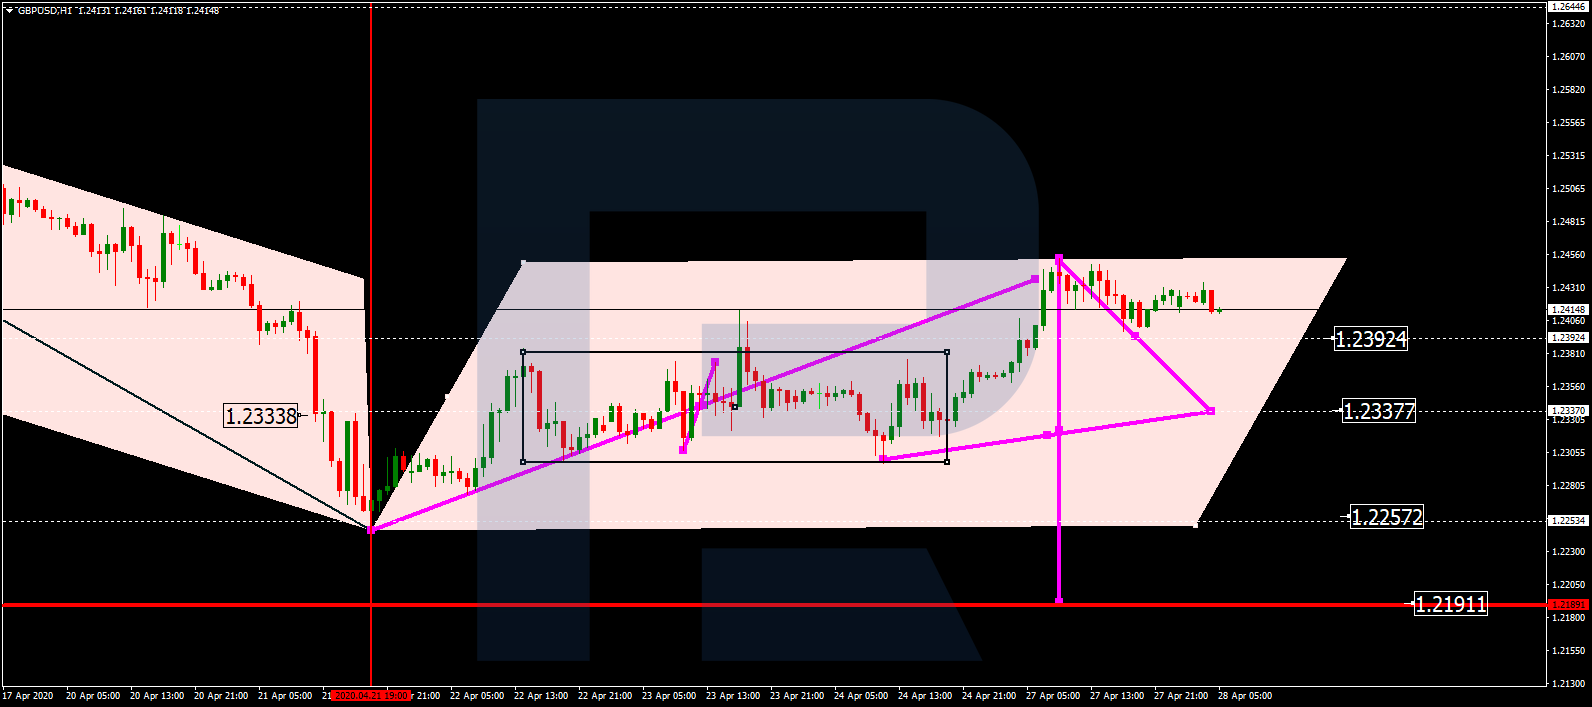
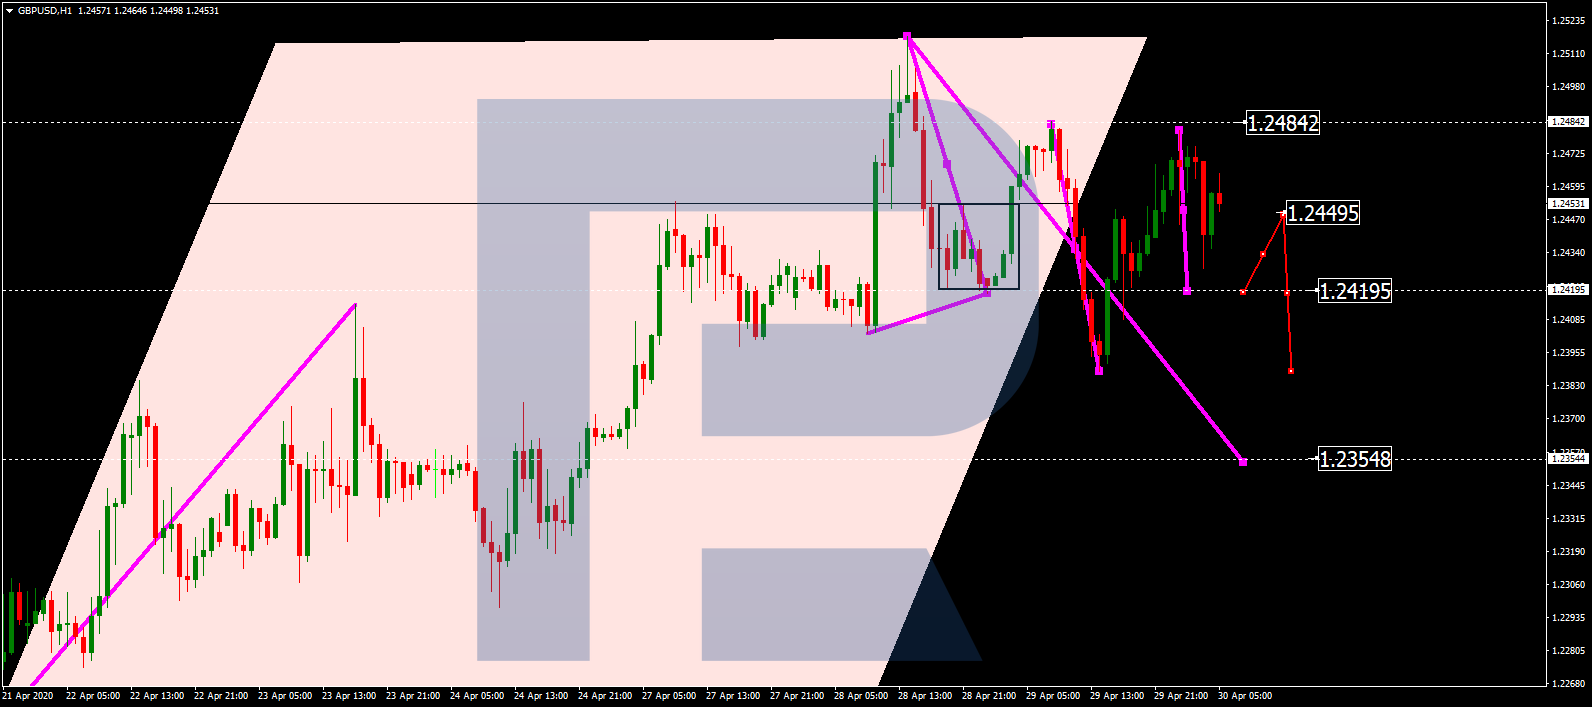
GBPUSD, “Great Britain Pound vs US Dollar”
GBPUSD is consolidating around 1.2440. Today, the pair may fall towards 1.2420 and then resume growing to reach 1.2450. If later the price breaks this range to the downside, the market may start another decline with the target at 1.2355; if to the upside – form one more ascending structure towards 1.2485 and then resume trading downwards to reach the above-mentioned target.
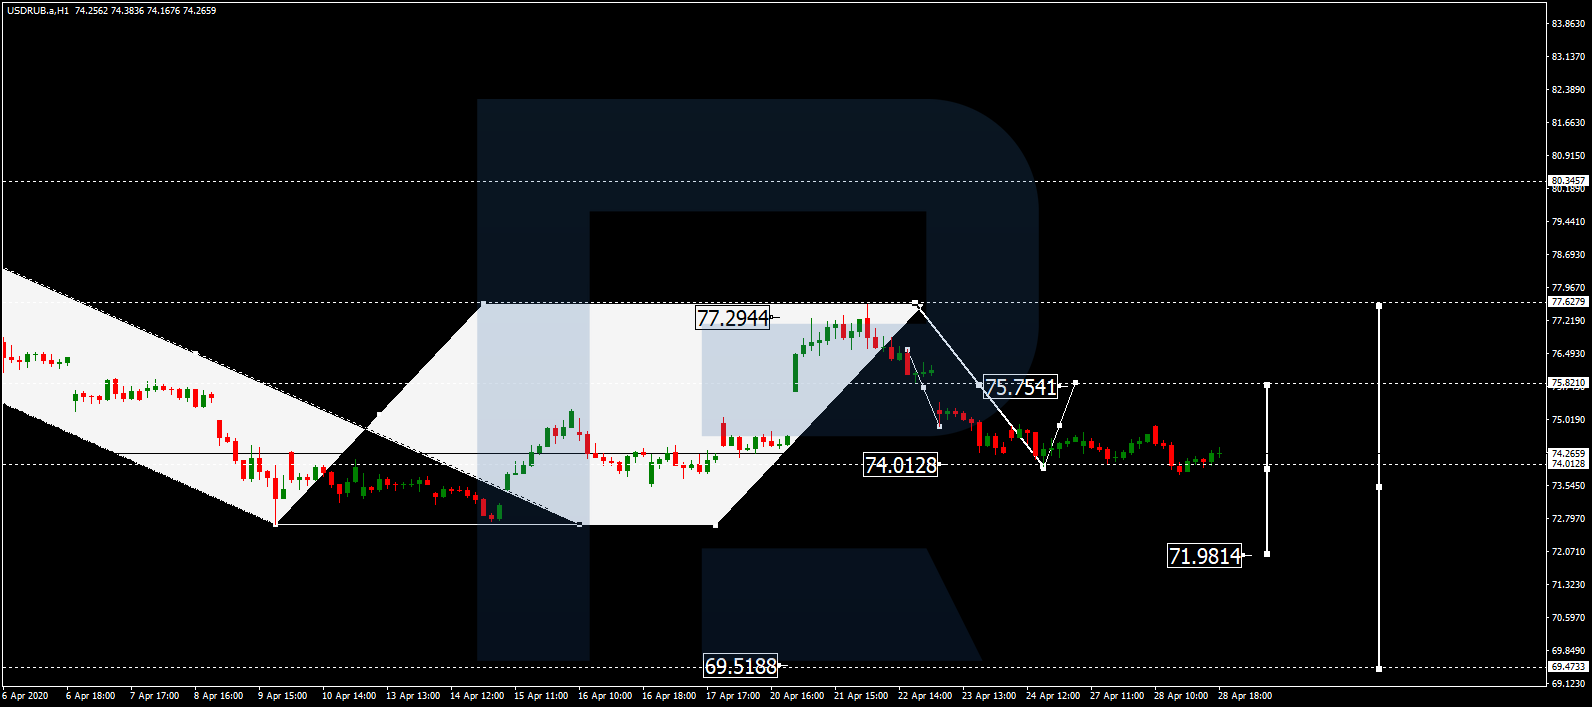
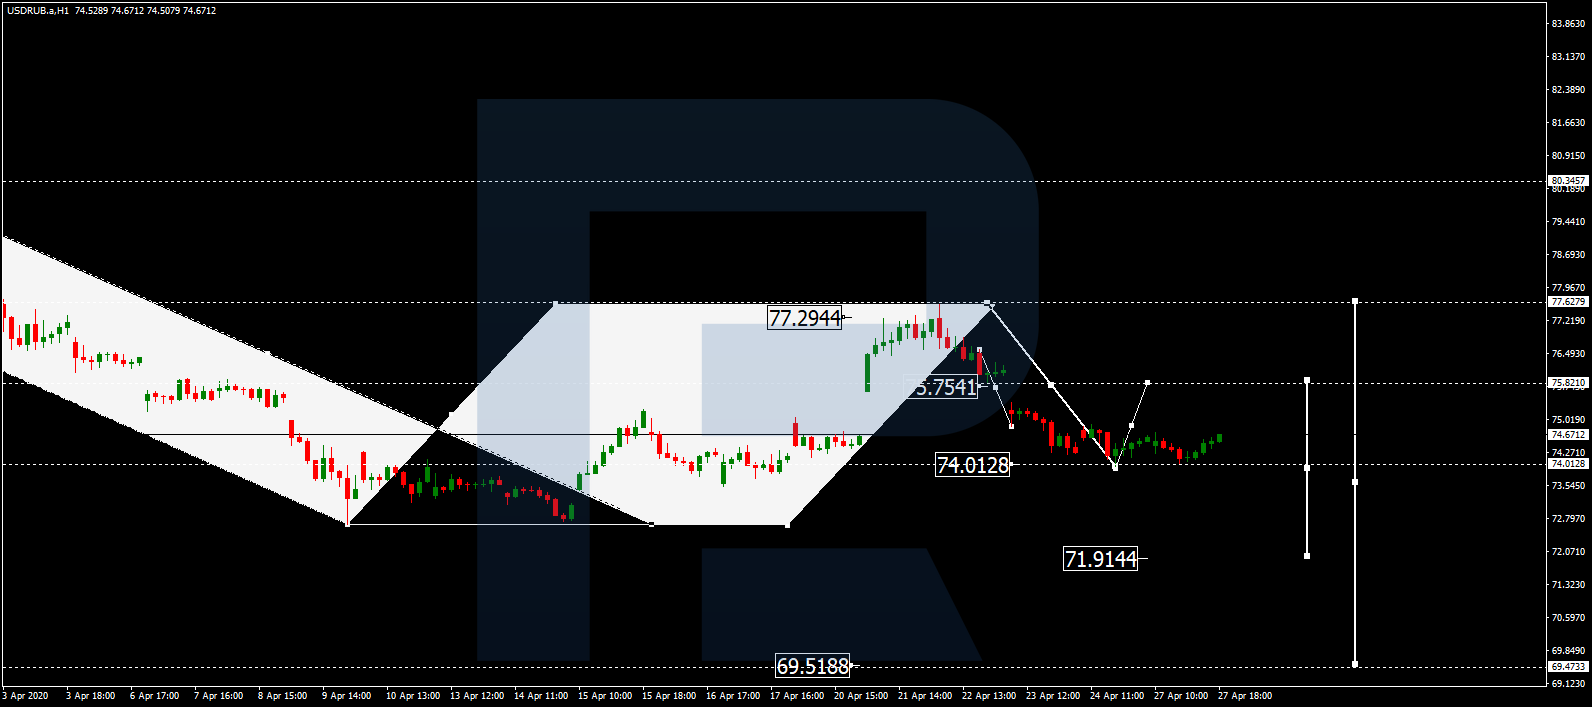
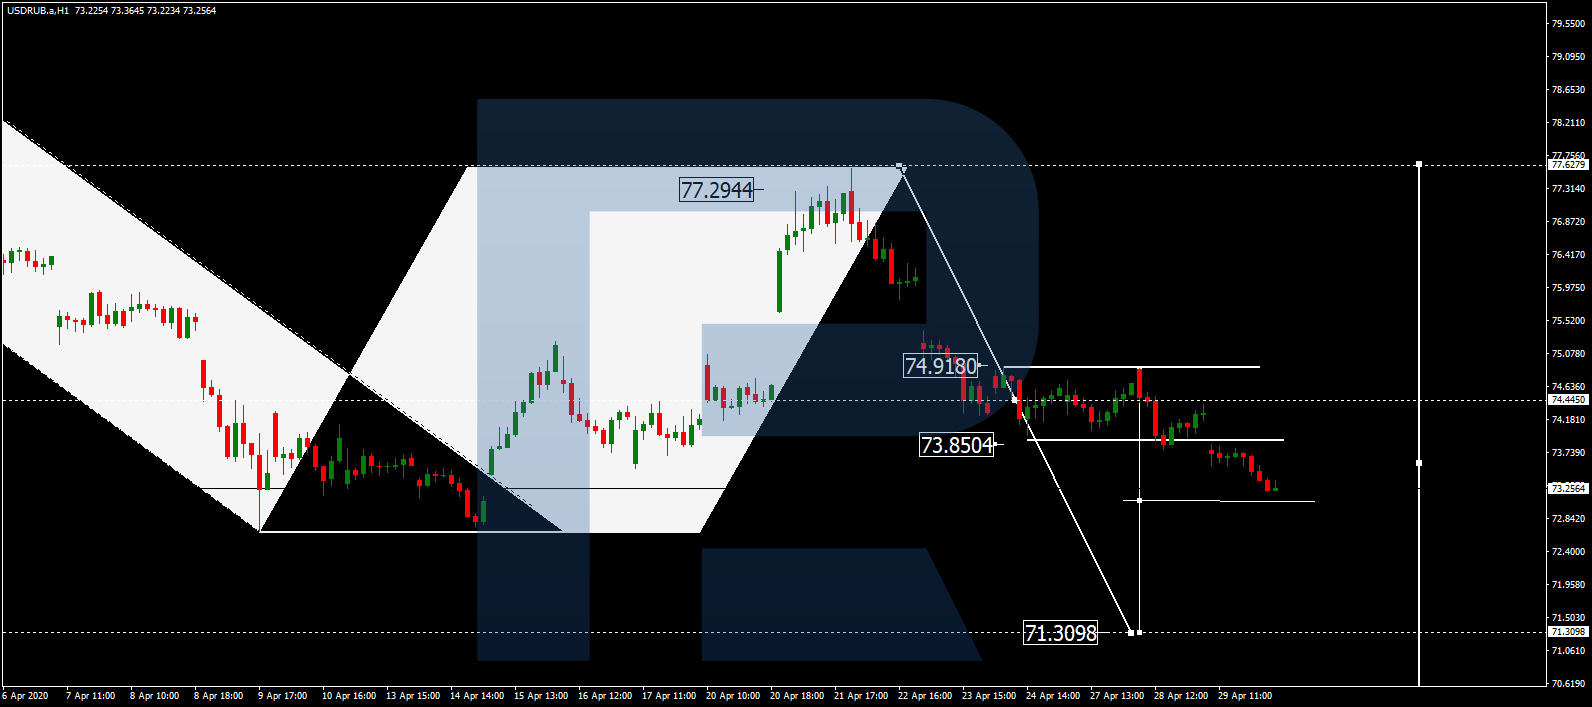
USDRUB, “US Dollar vs Russian Ruble”
After breaking 74.00 to the downside, USDRUB is expected to continue falling towards 71.30. After that, the instrument may correct to return to 74.00 and test it from below. Later, the market may resume trading downwards with the target at 69.50.
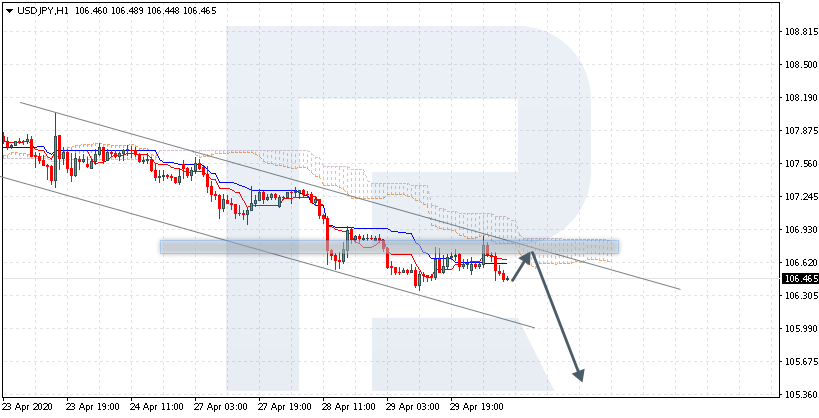
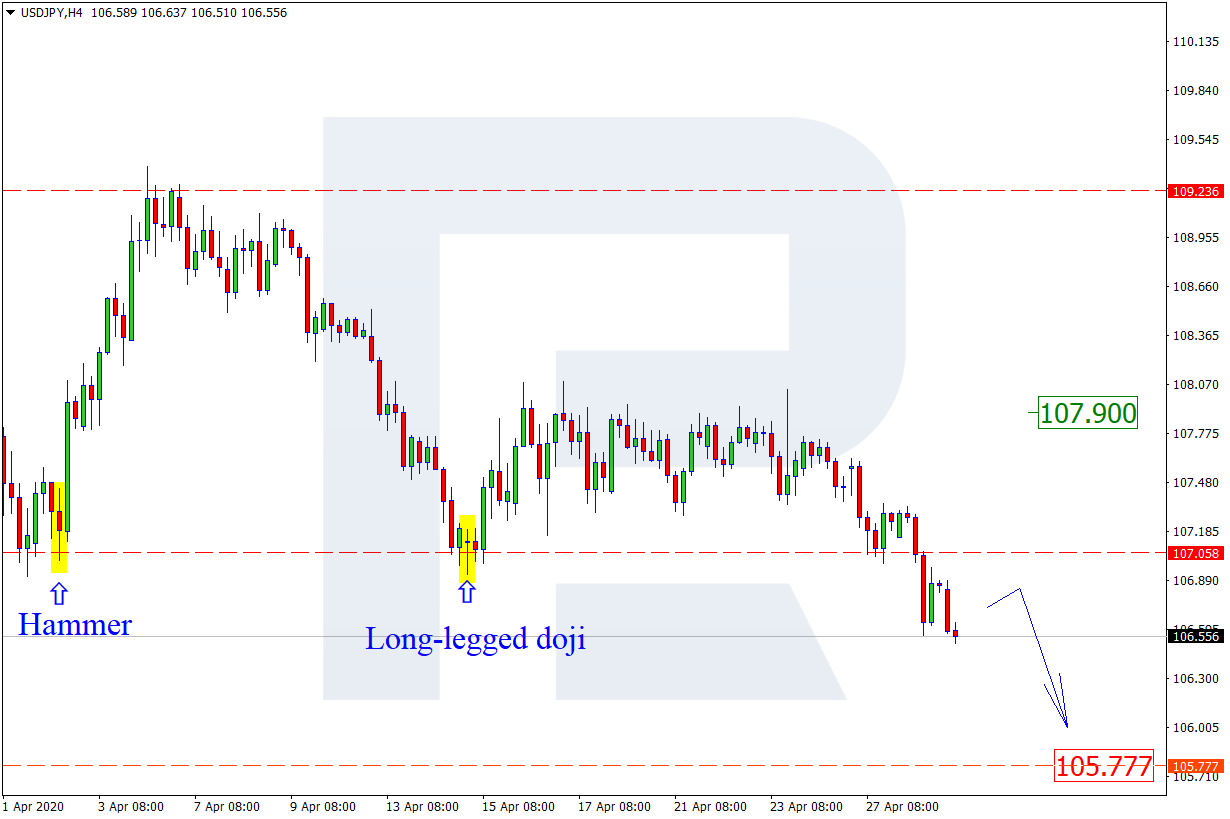
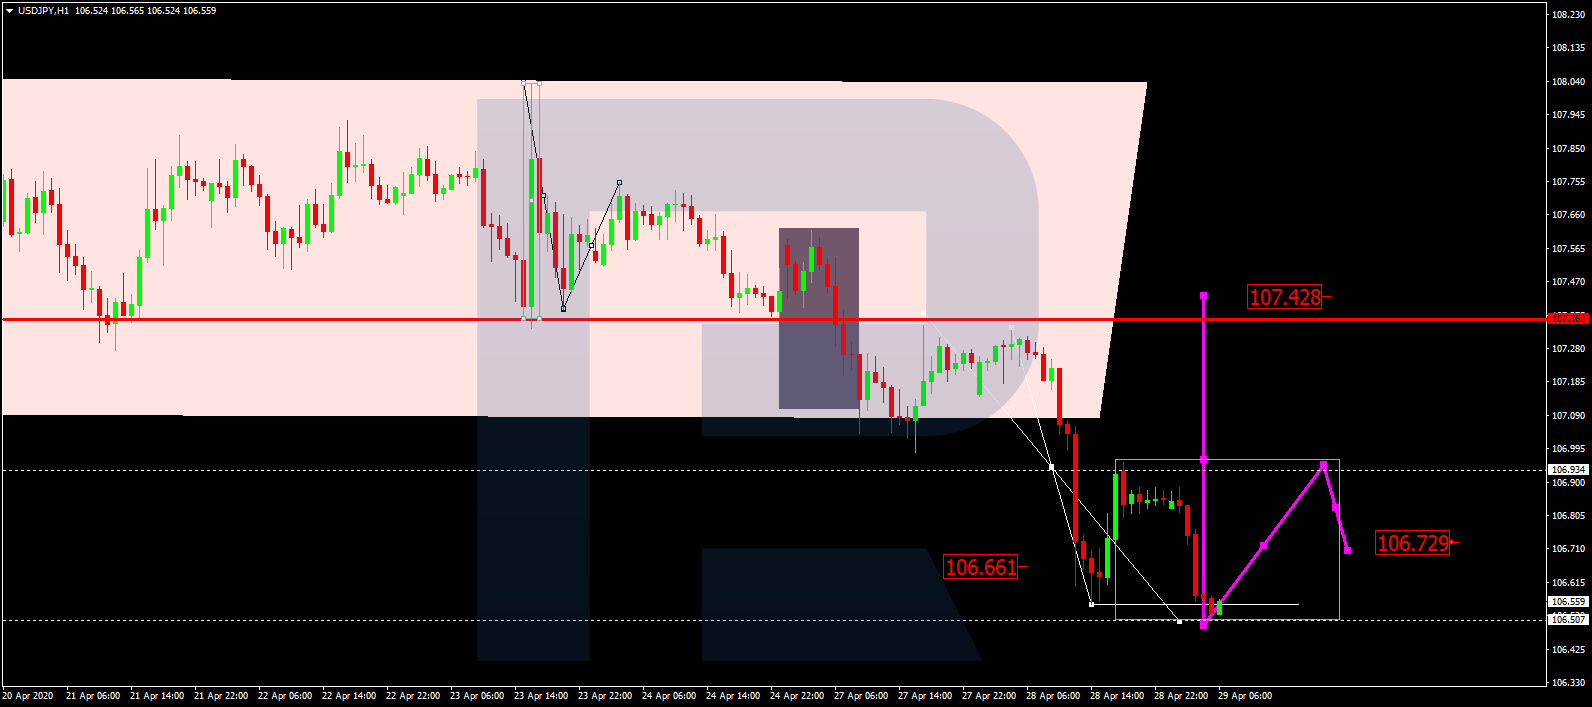
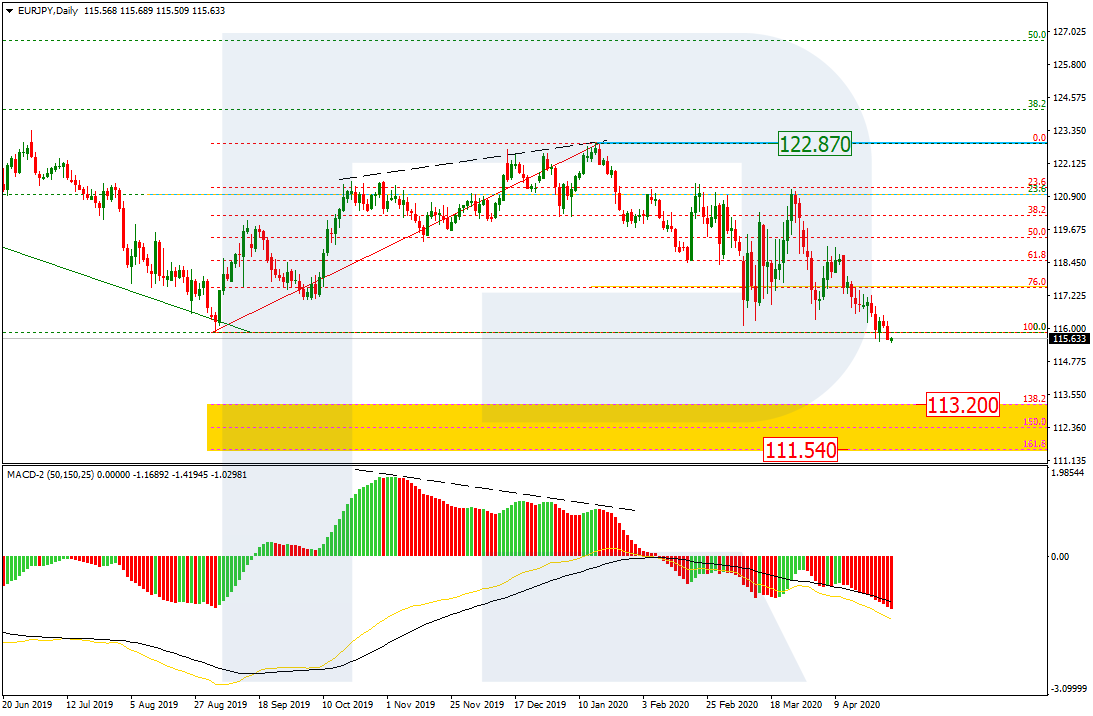
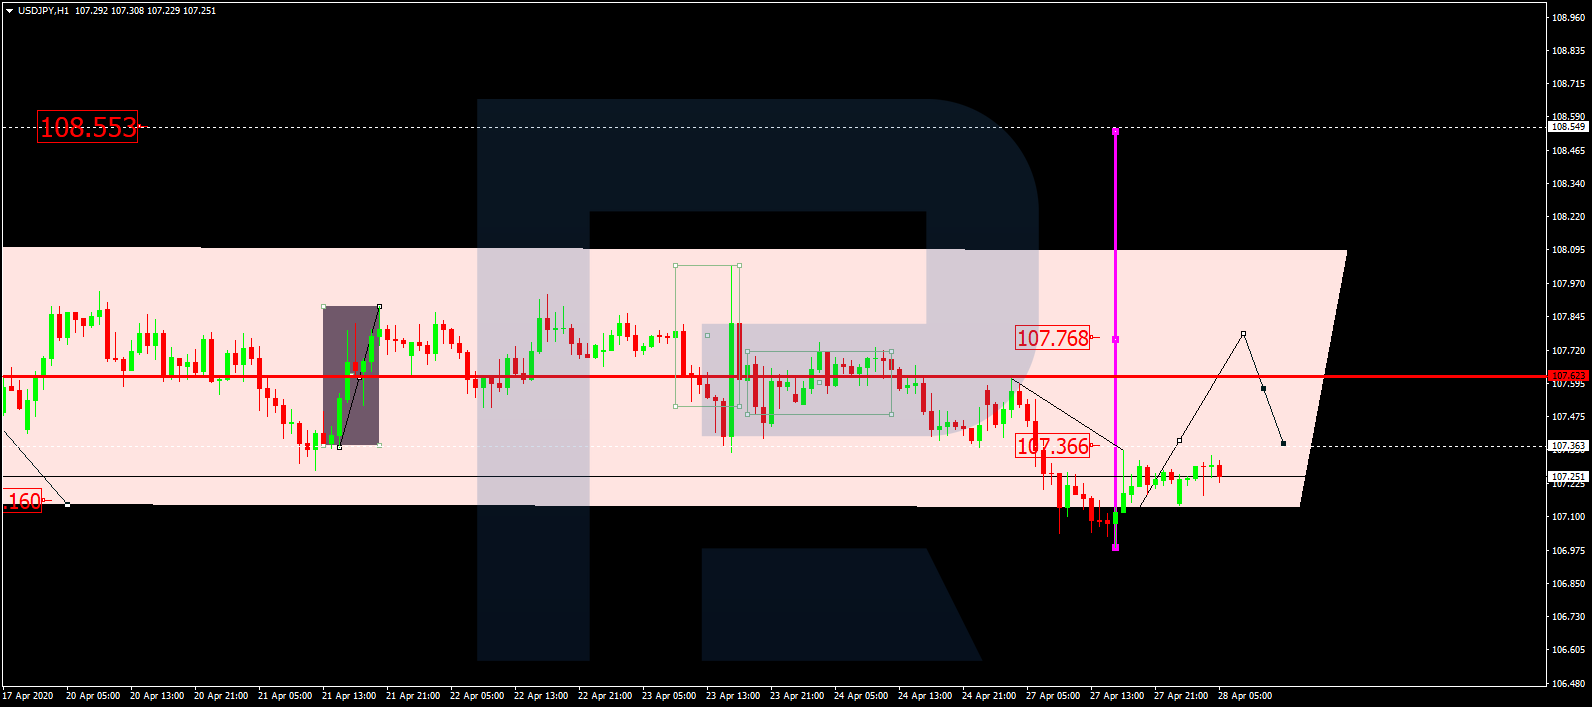
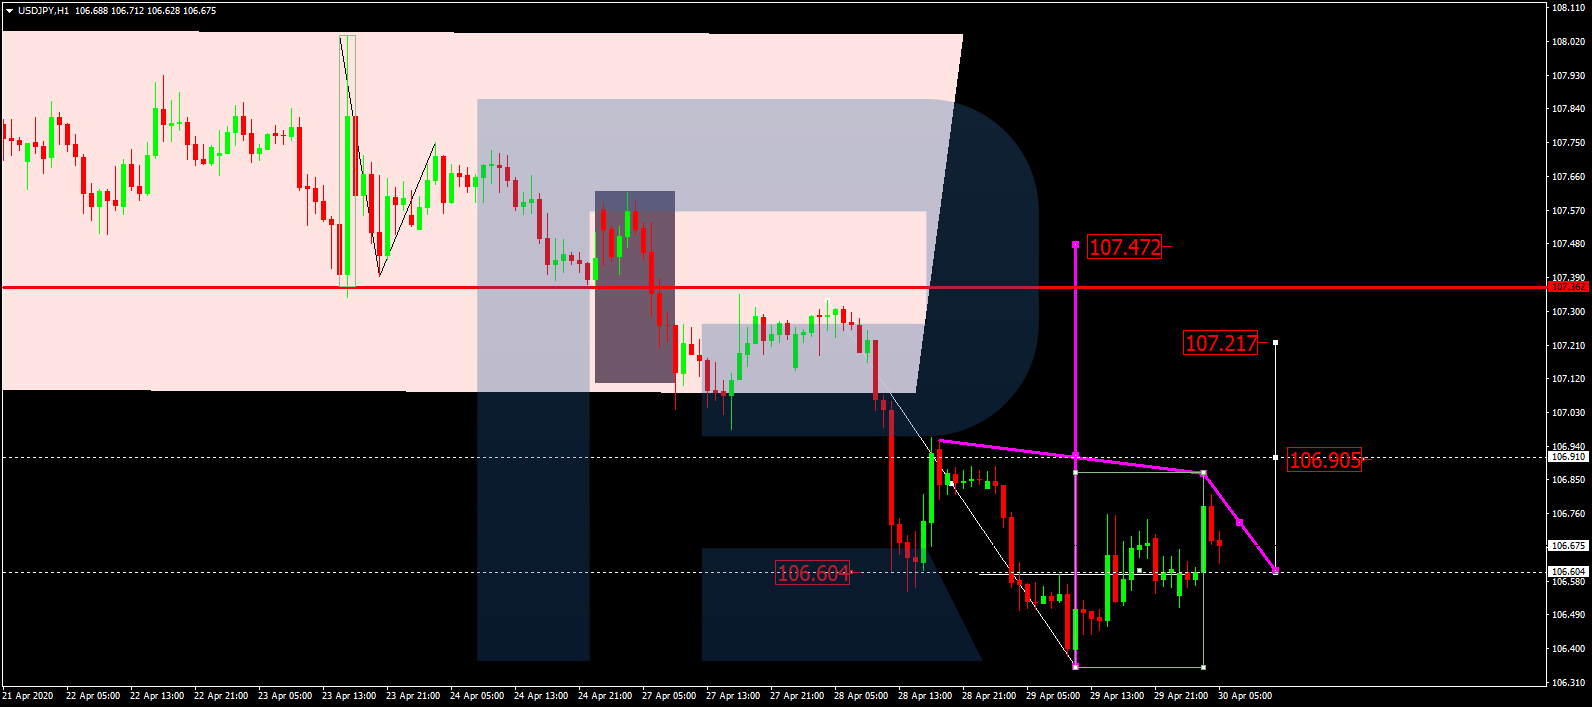
USDJPY, “US Dollar vs Japanese Yen”
USDJPY is still consolidating around 106.60. The main scenario implies that the price may grow towards 106.90. If later the price breaks this level to the upside, the market may form one more ascending structure with the short-term target at 107.22.
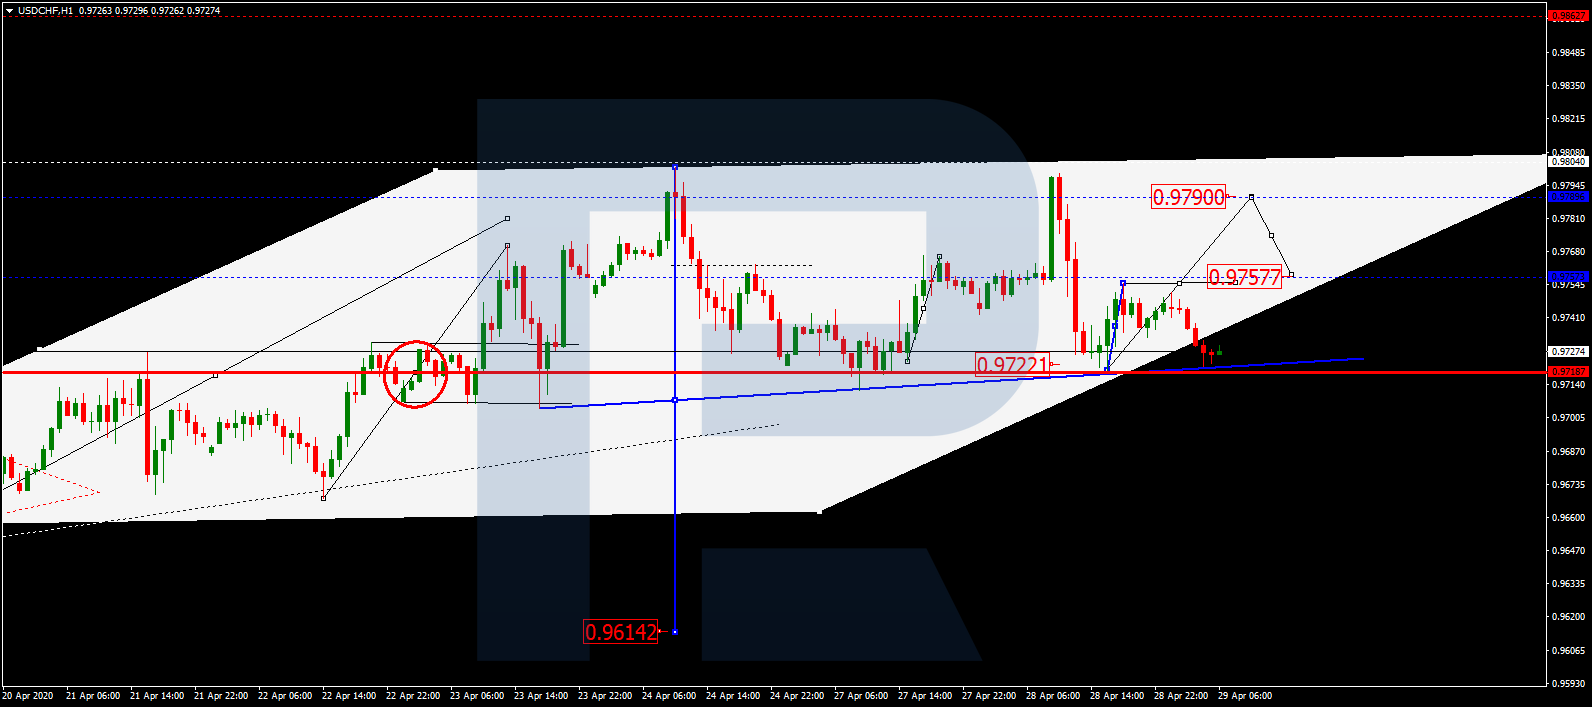
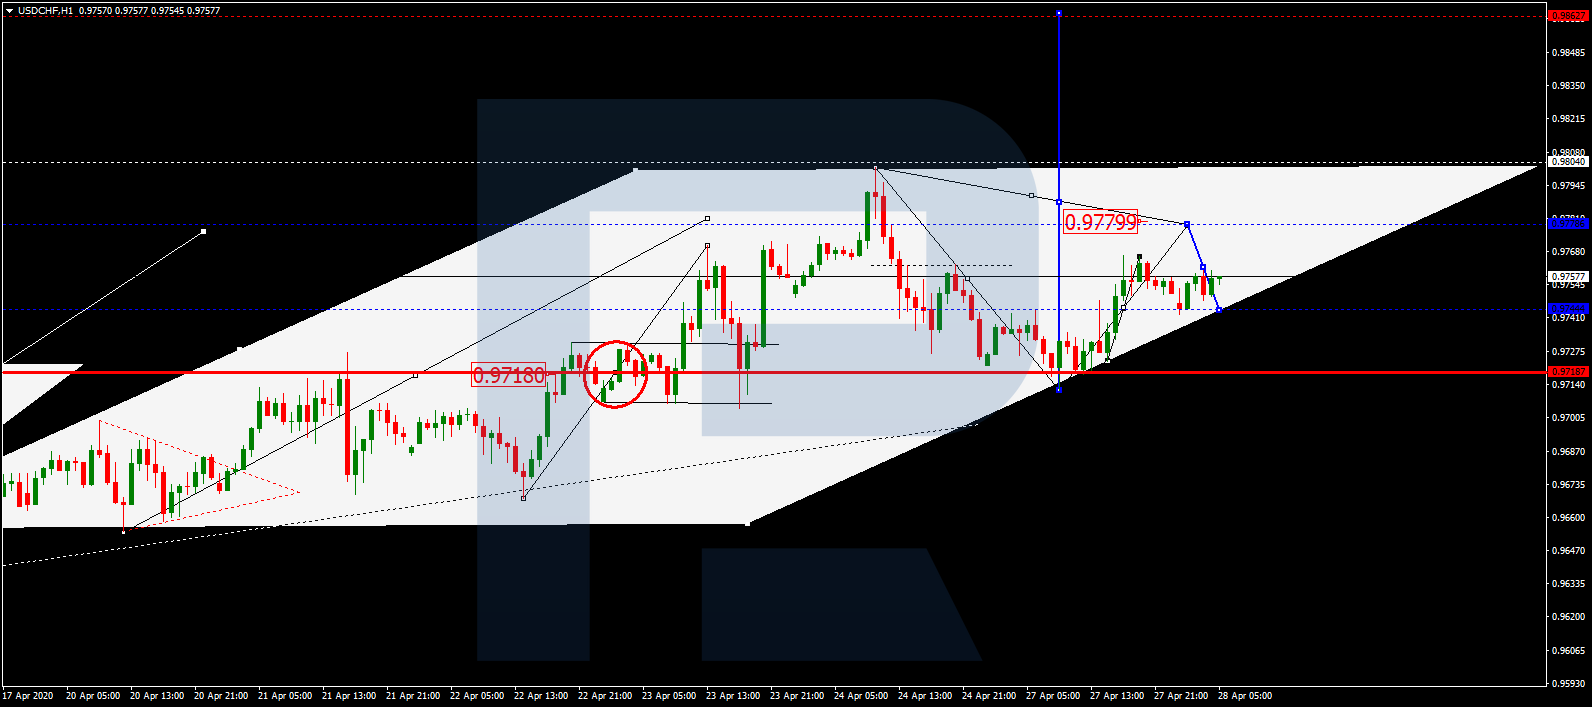
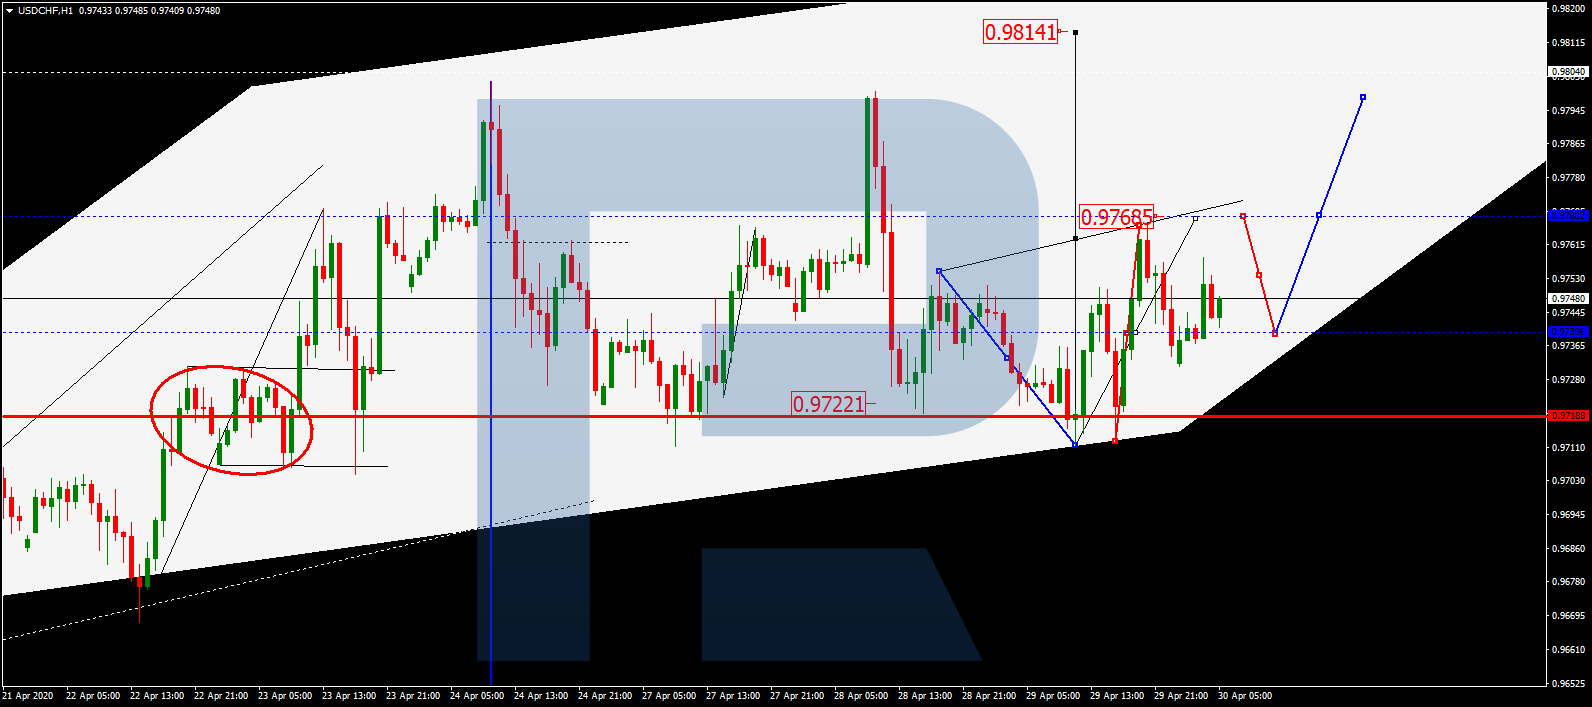
USDCHF, “US Dollar vs Swiss Franc”
USDCHF is consolidating above 0.9740. Today, the pair may expand the range up to 0.9768 and then return to 0.9740. If later the price breaks this range to the upside, the market may start another growth to reach 0.9814; if to the downside at 74.00 – continue the correction with the target at 0.9670.
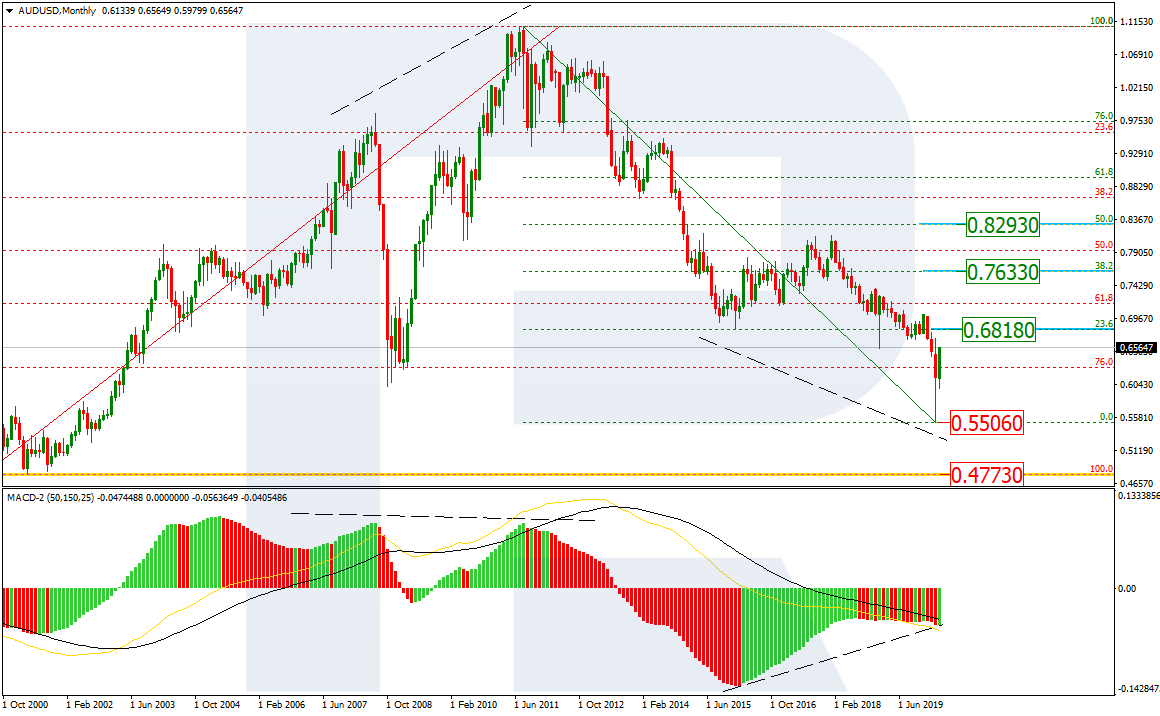
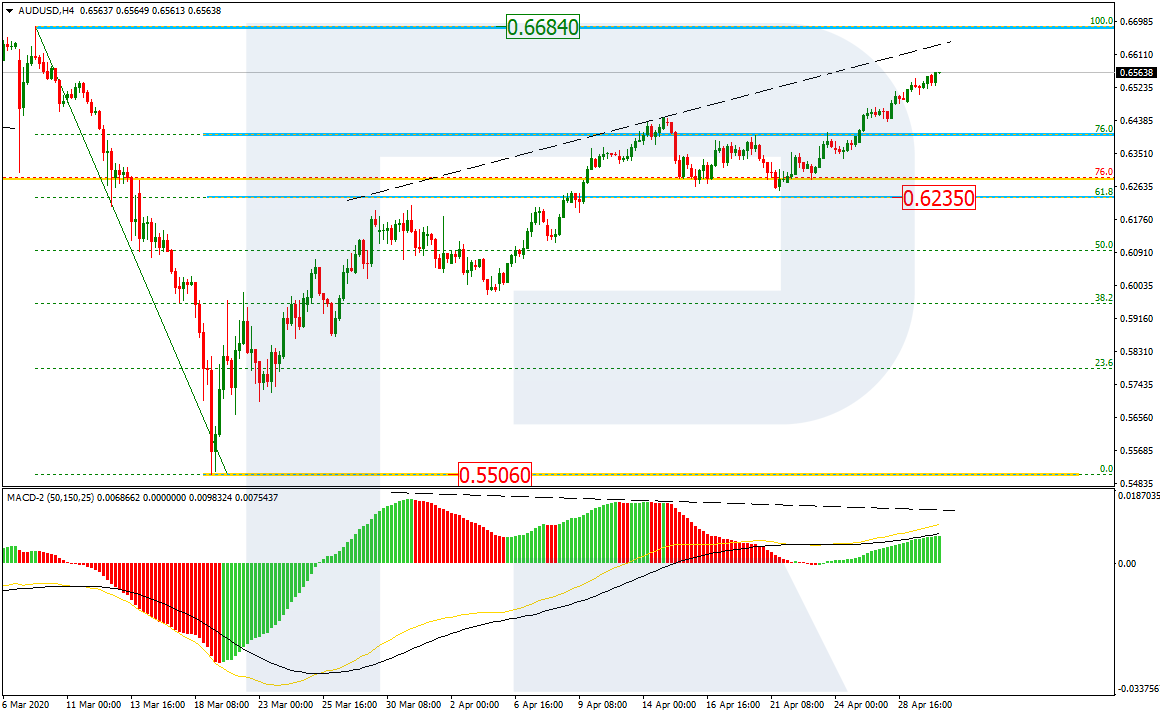
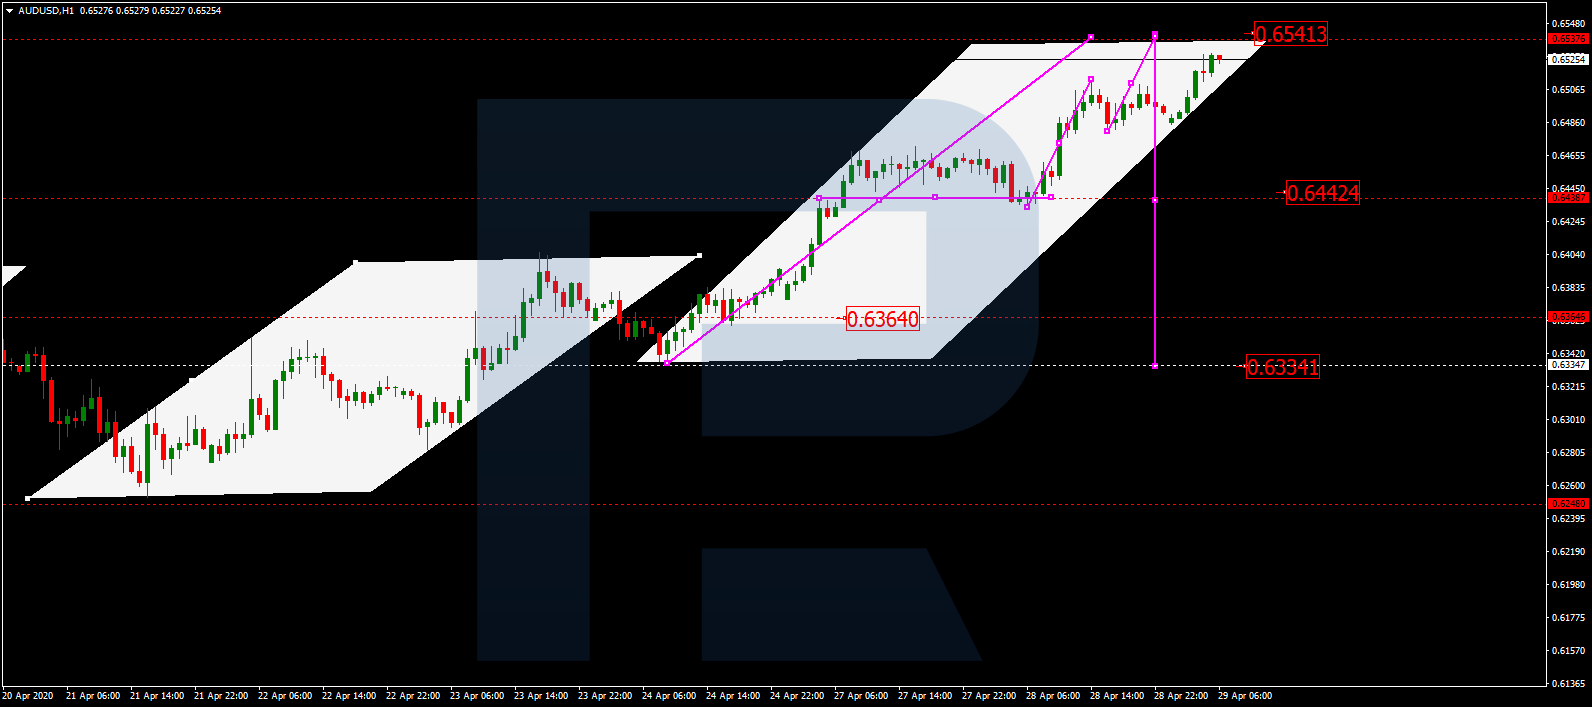
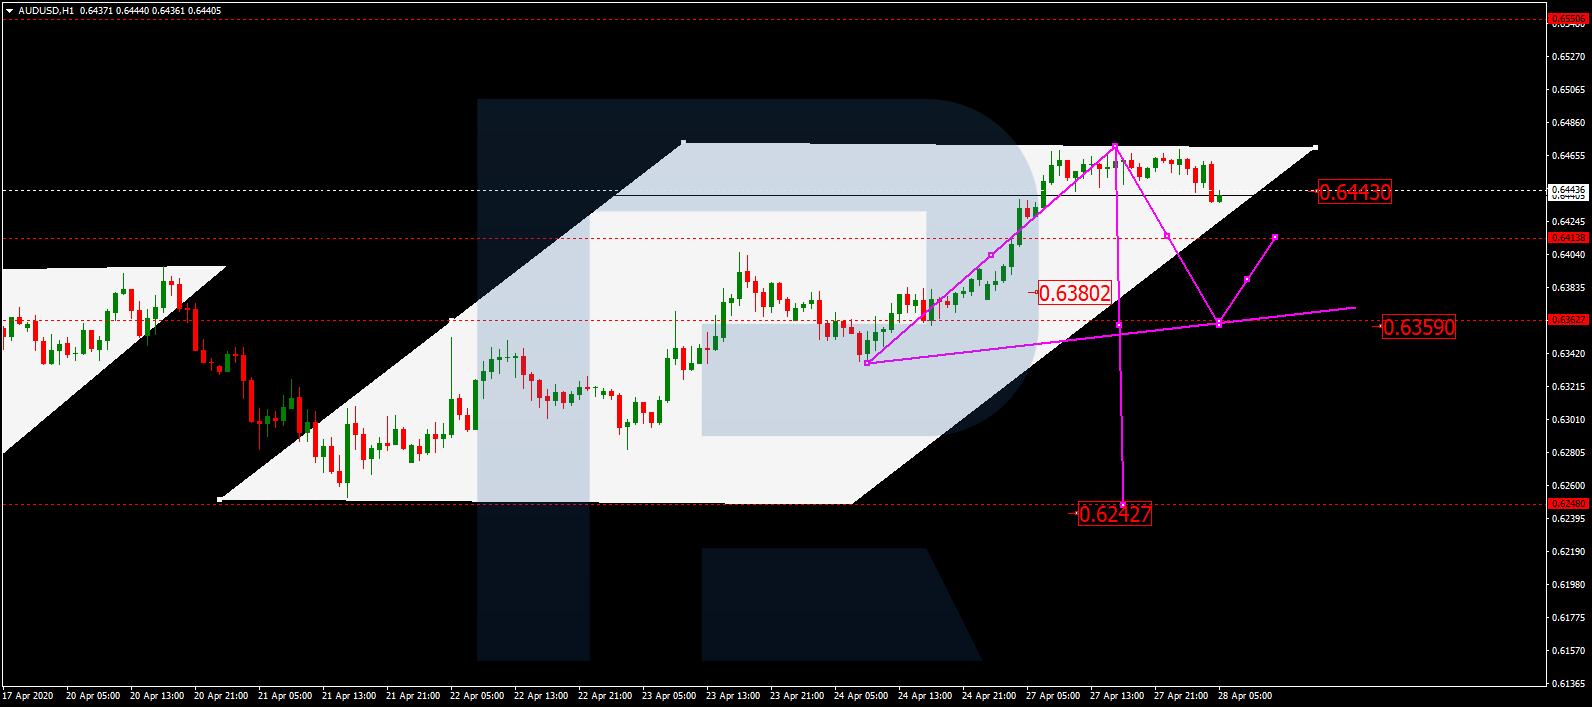
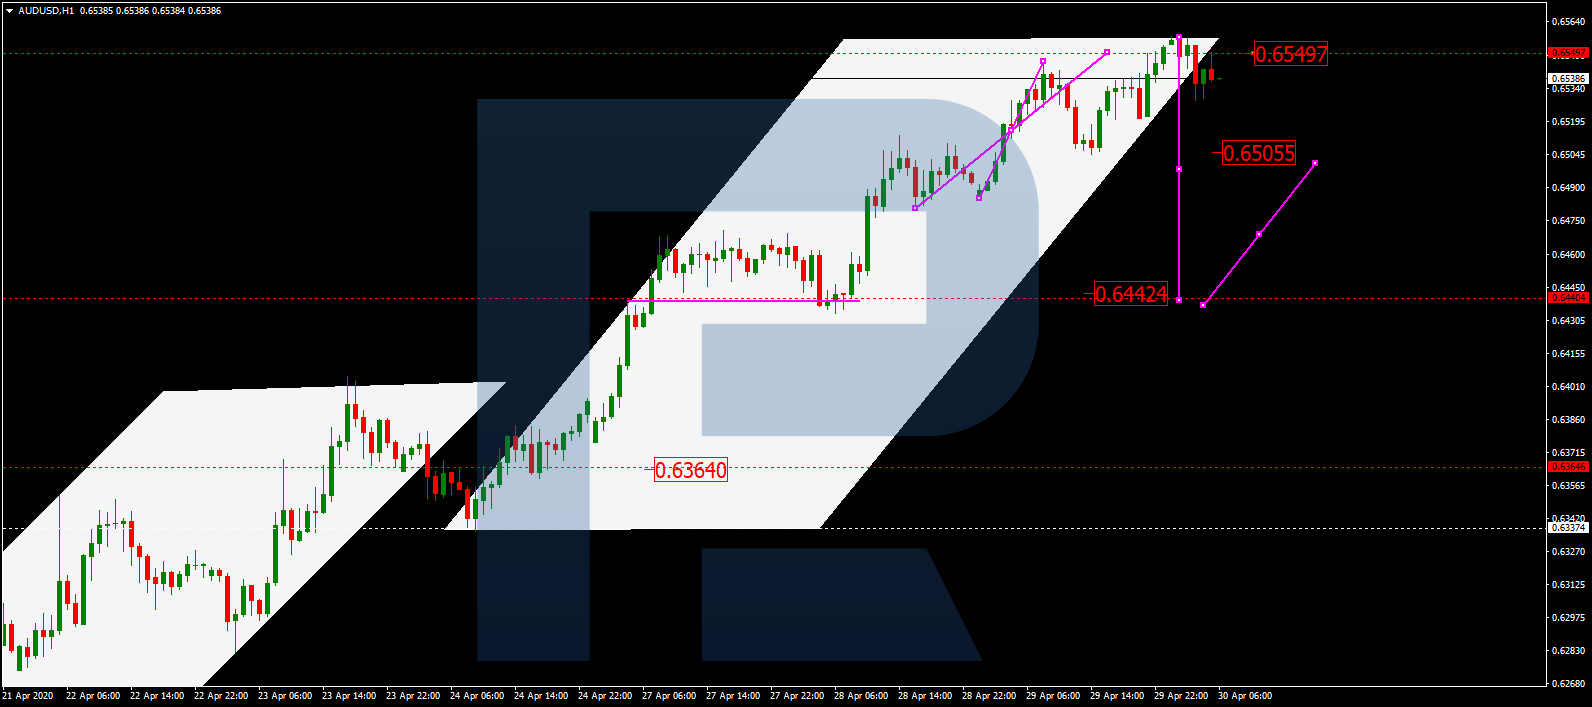
AUDUSD, “Australian Dollar vs US Dollar”
AUDUSD has finished the ascending structure at 0.6555. Possibly, today the pair may consolidate near the highs. Later, the market may break the range to the downside and start a new decline with the first target at 0.6444.
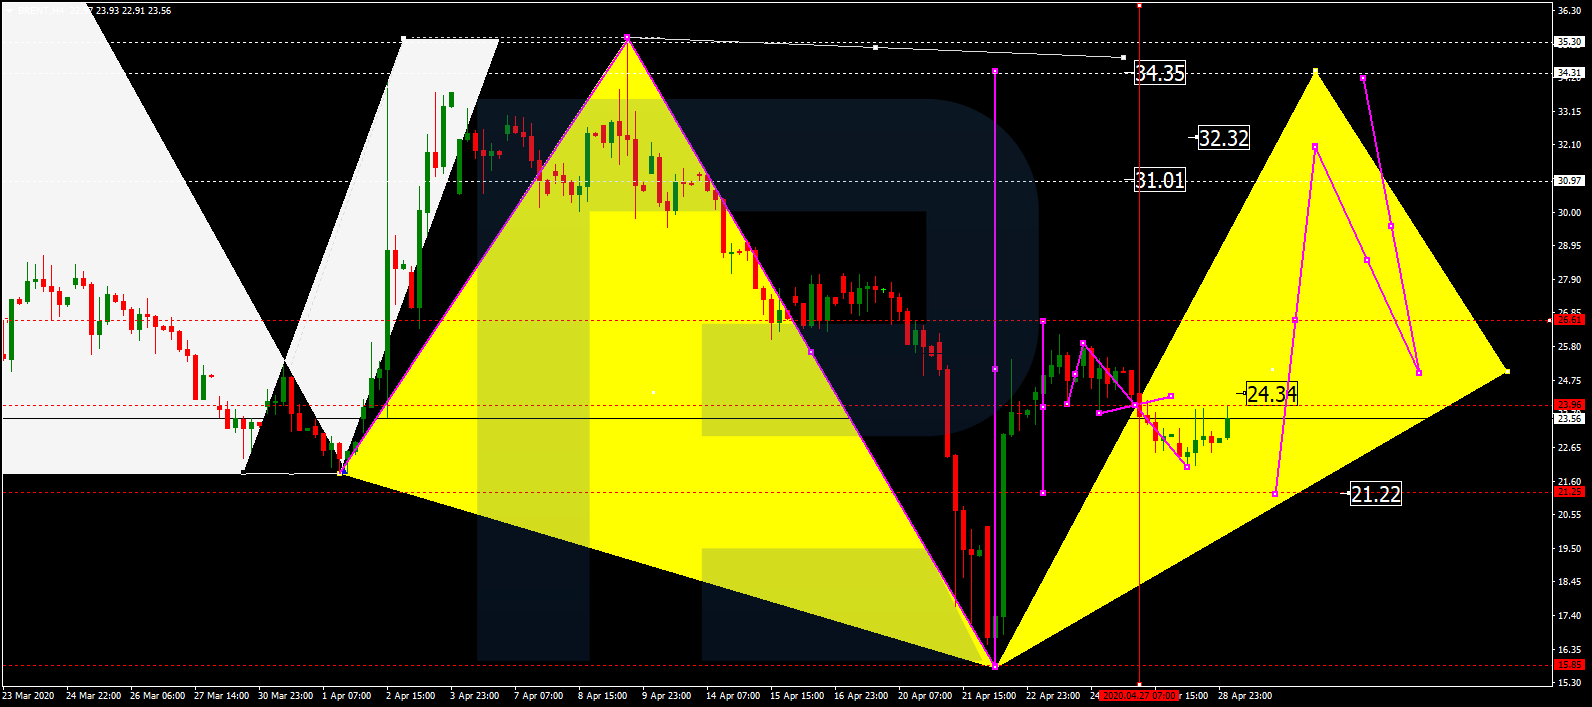
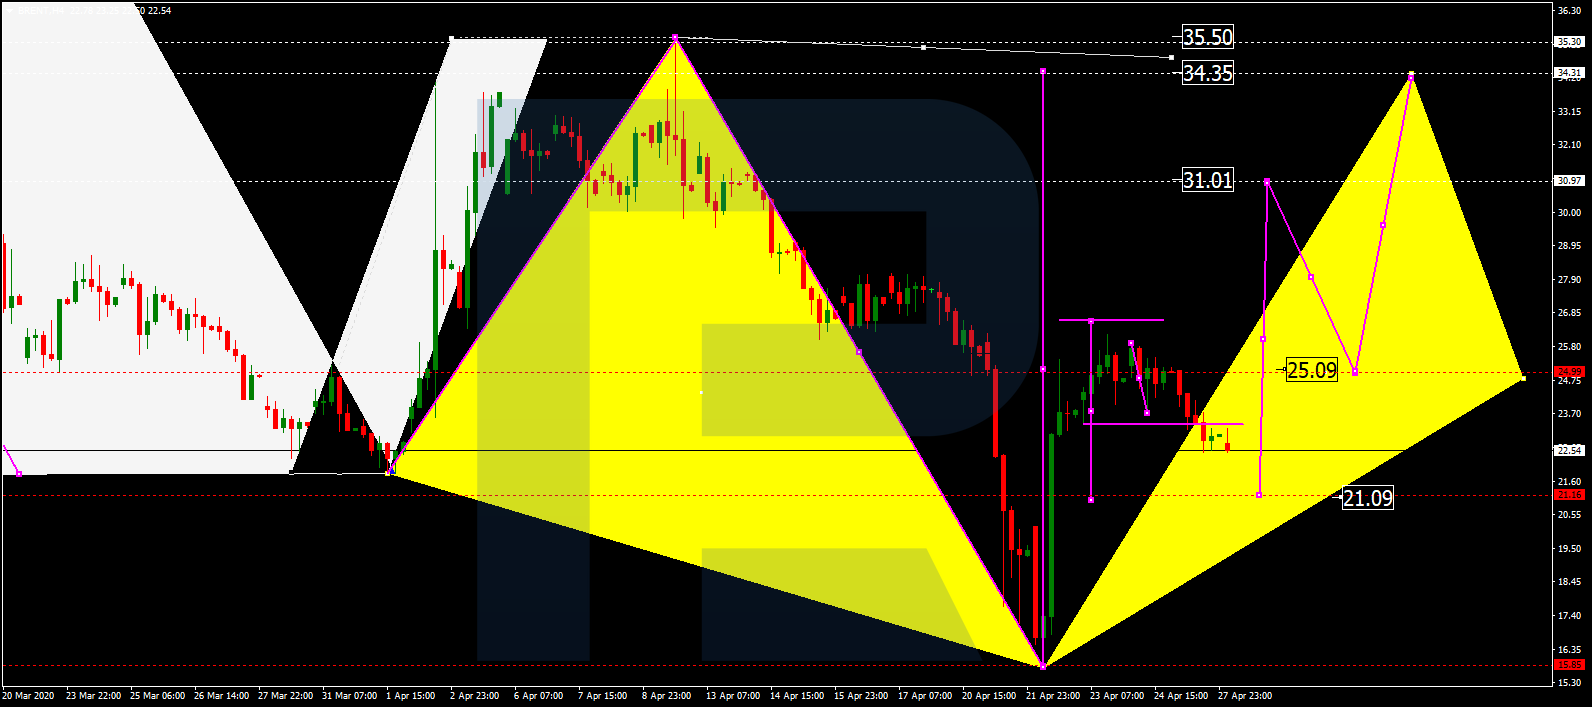
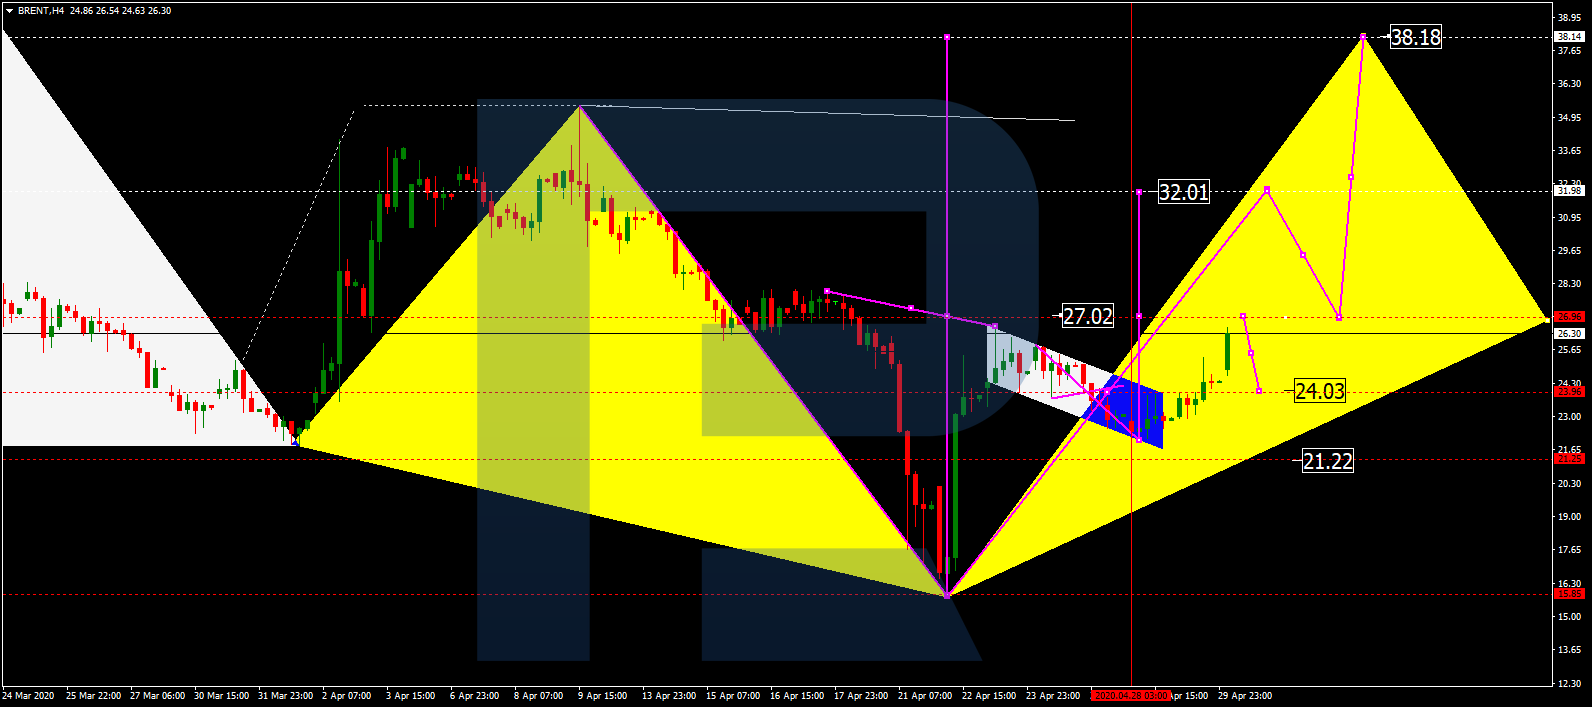
BRENT
After completing the ascending structure at 27.00, Brent is expected to fall towards 24.10. After that, the instrument may grow to return to 27.00 and break it. Later, the market may continue trading upwards with the short-term target at 32.00 and then resume falling to test 27.00 from above.
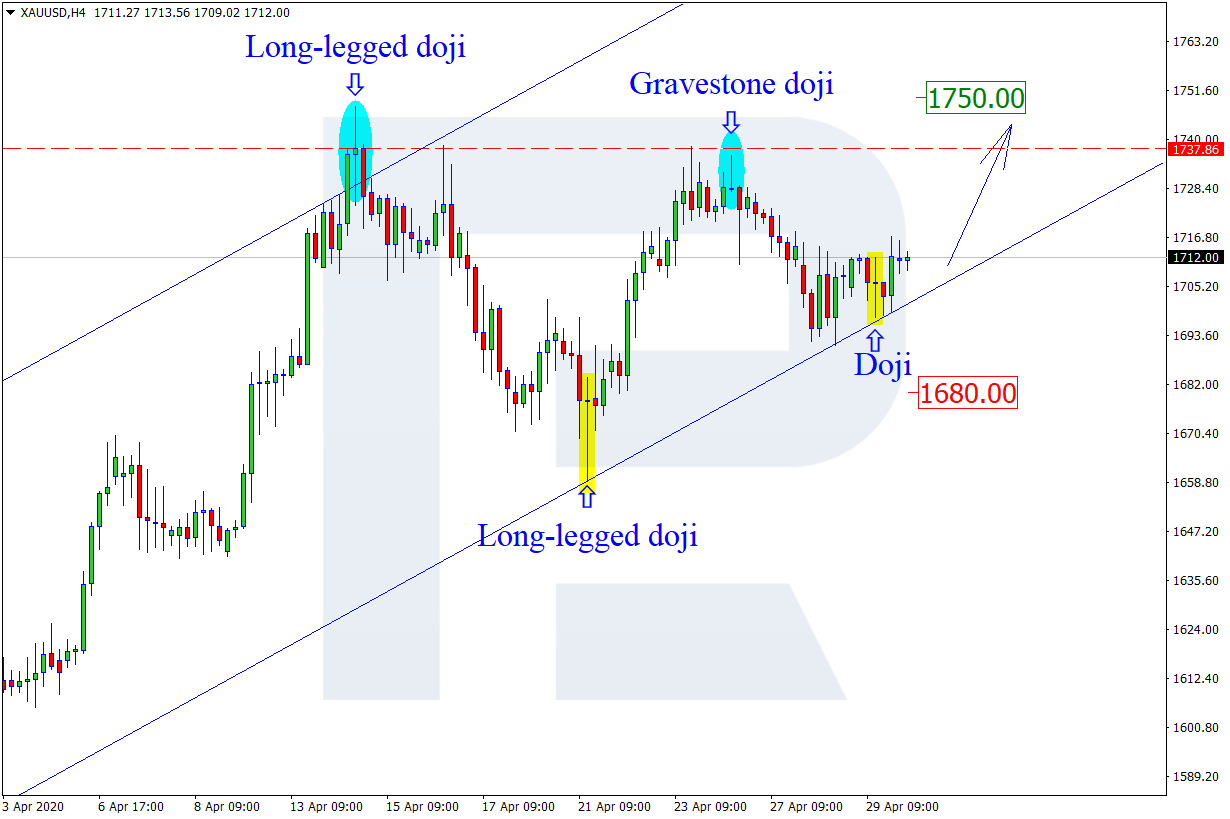
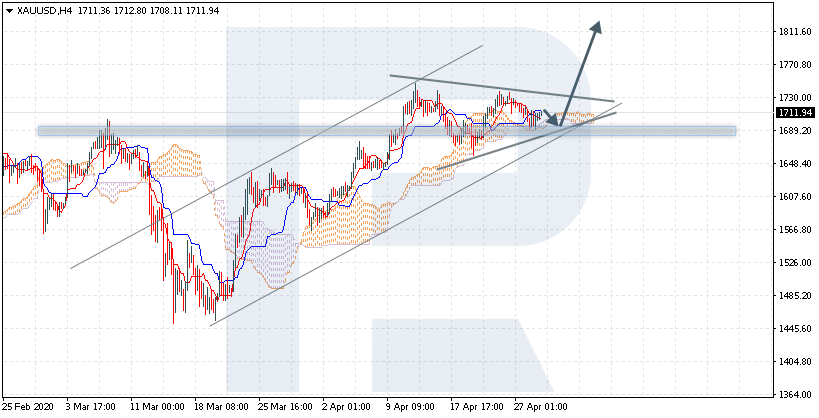
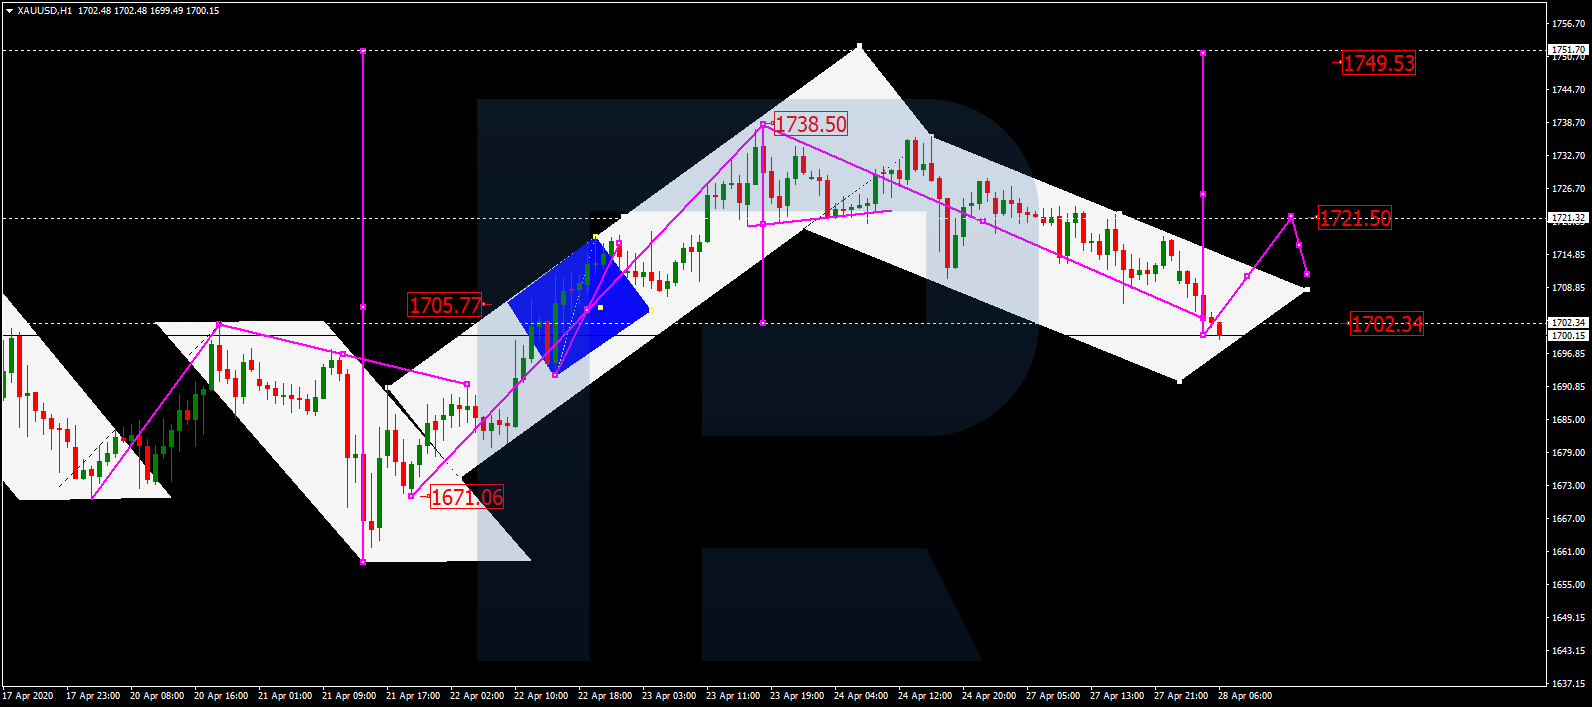
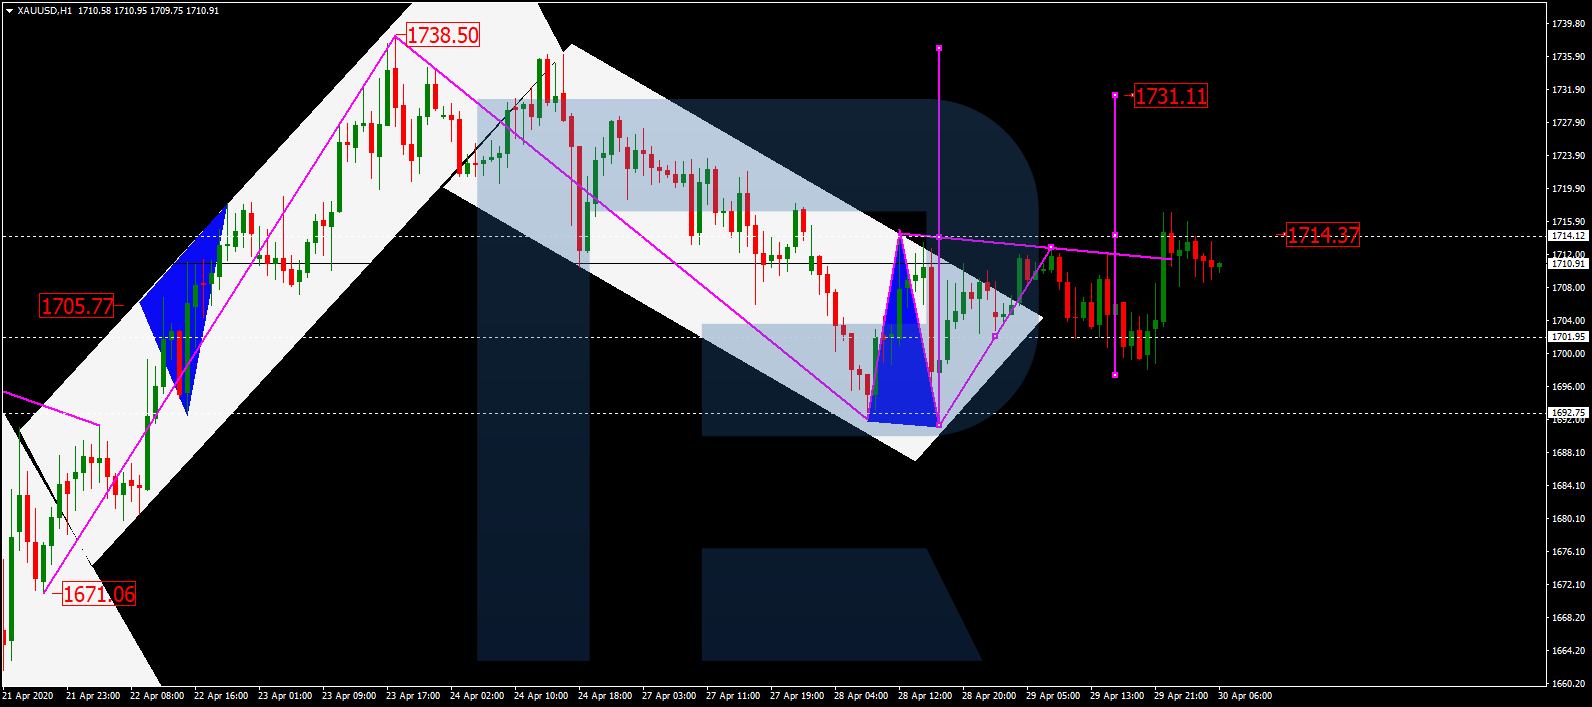
XAUUSD, “Gold vs US Dollar”
Gold is moving upwards. Possibly, the pair may break 1714.33 and then continue growing to reach 1731.11. After that, the instrument may correct towards 1715.00 and then form one more ascending structure with the target at 1751.50.
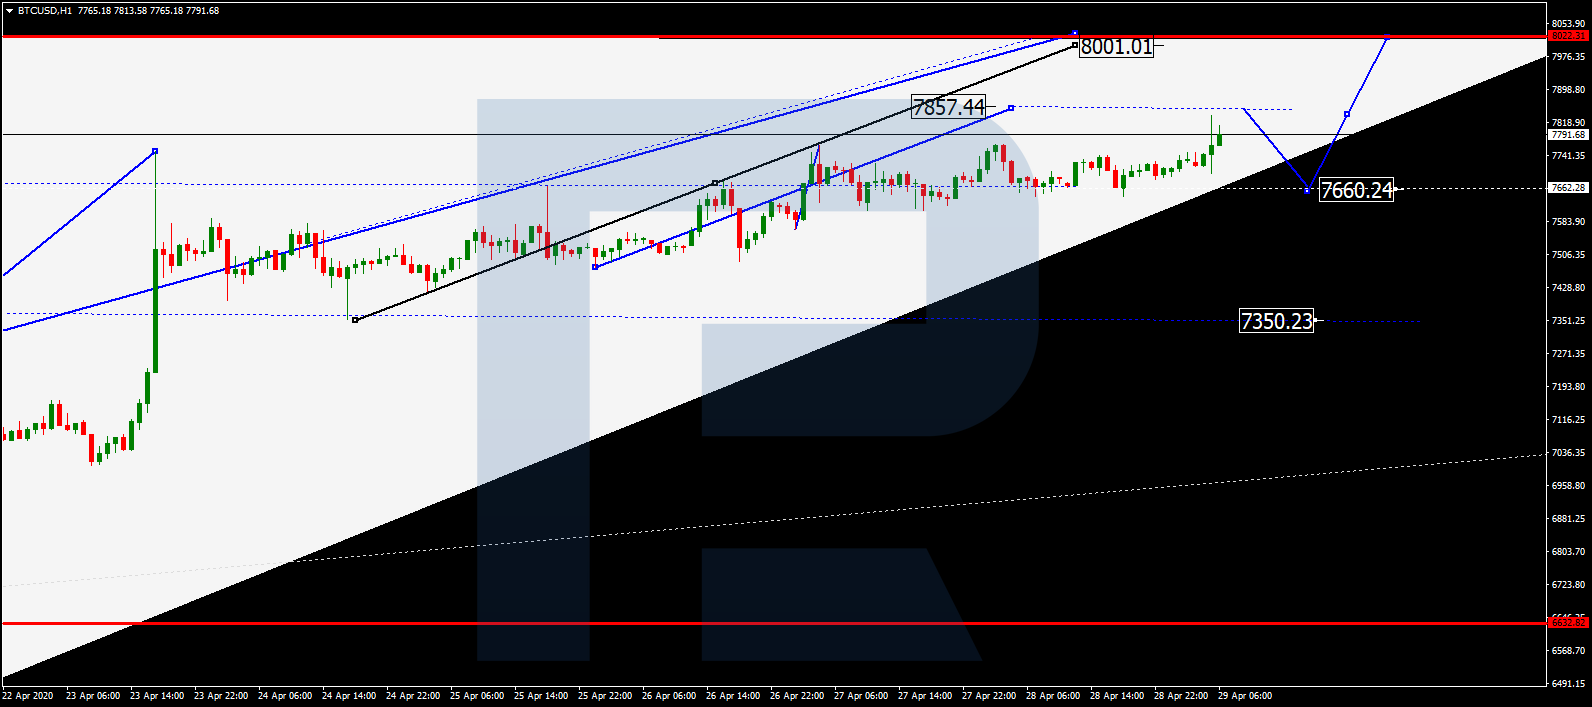
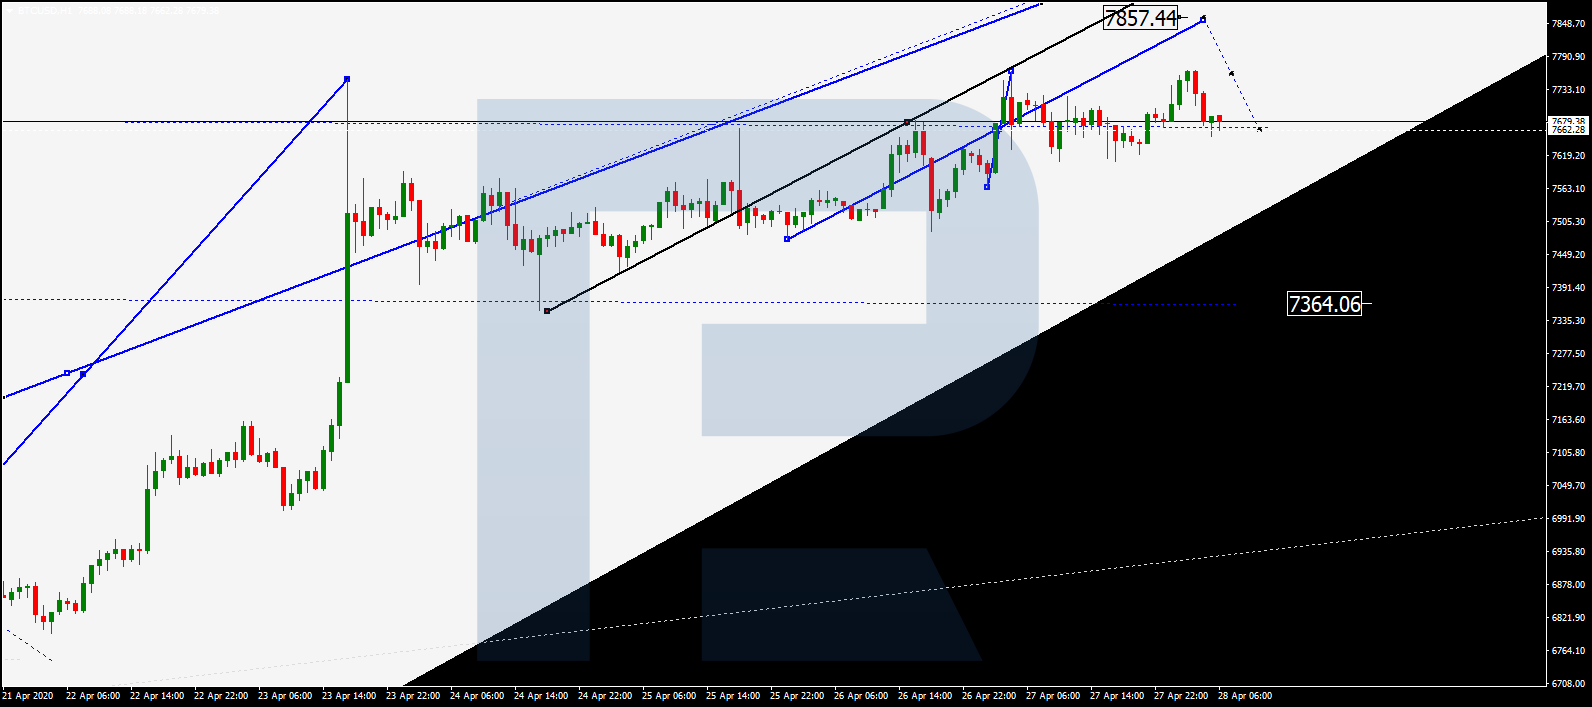
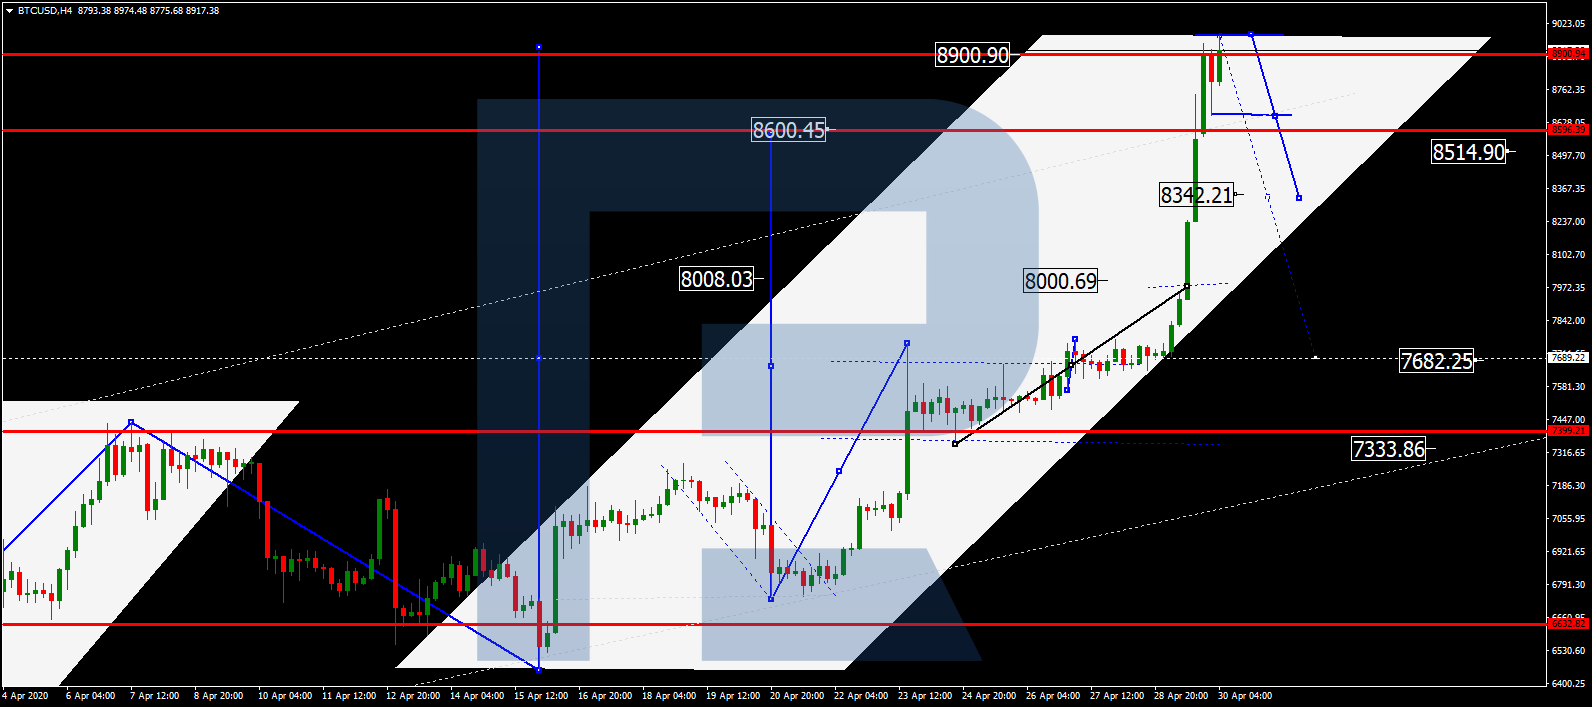
BTCUSD, “Bitcoin vs US Dollar”
After reaching 8000.00, BTCUSD continues growing without any corrections. Possibly, today the pair may reach the target at 9444.00 and then start a new correction to return to 8000.00 and test it from above.
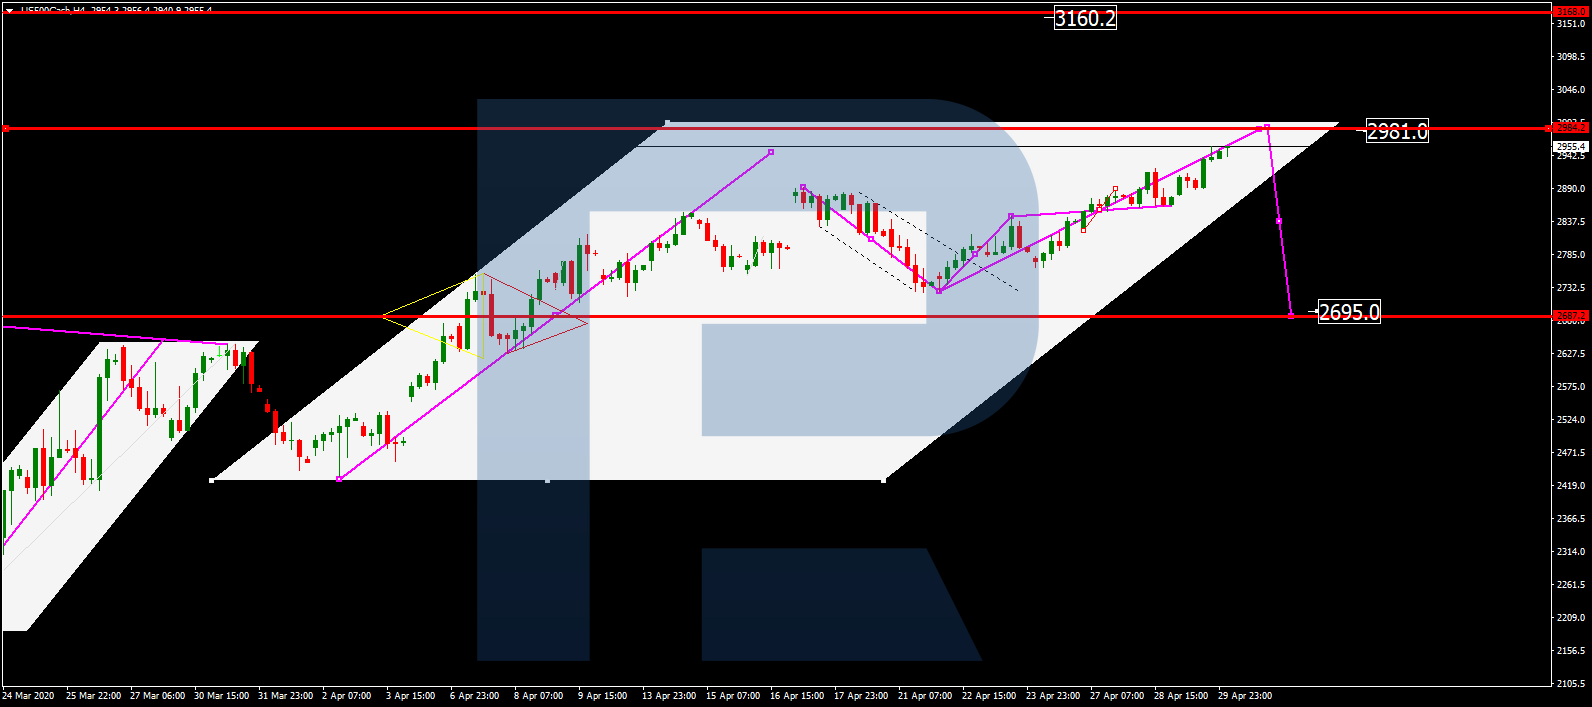
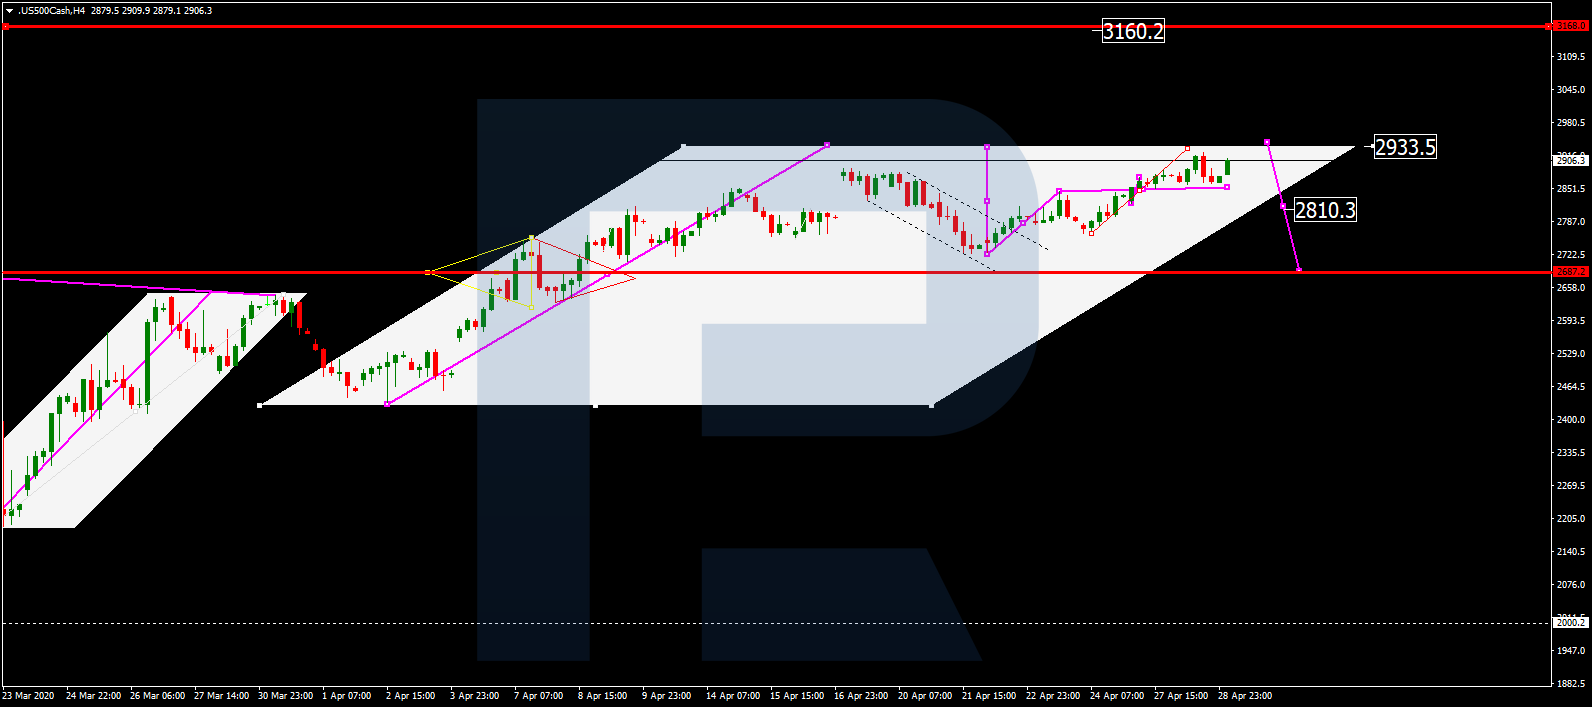
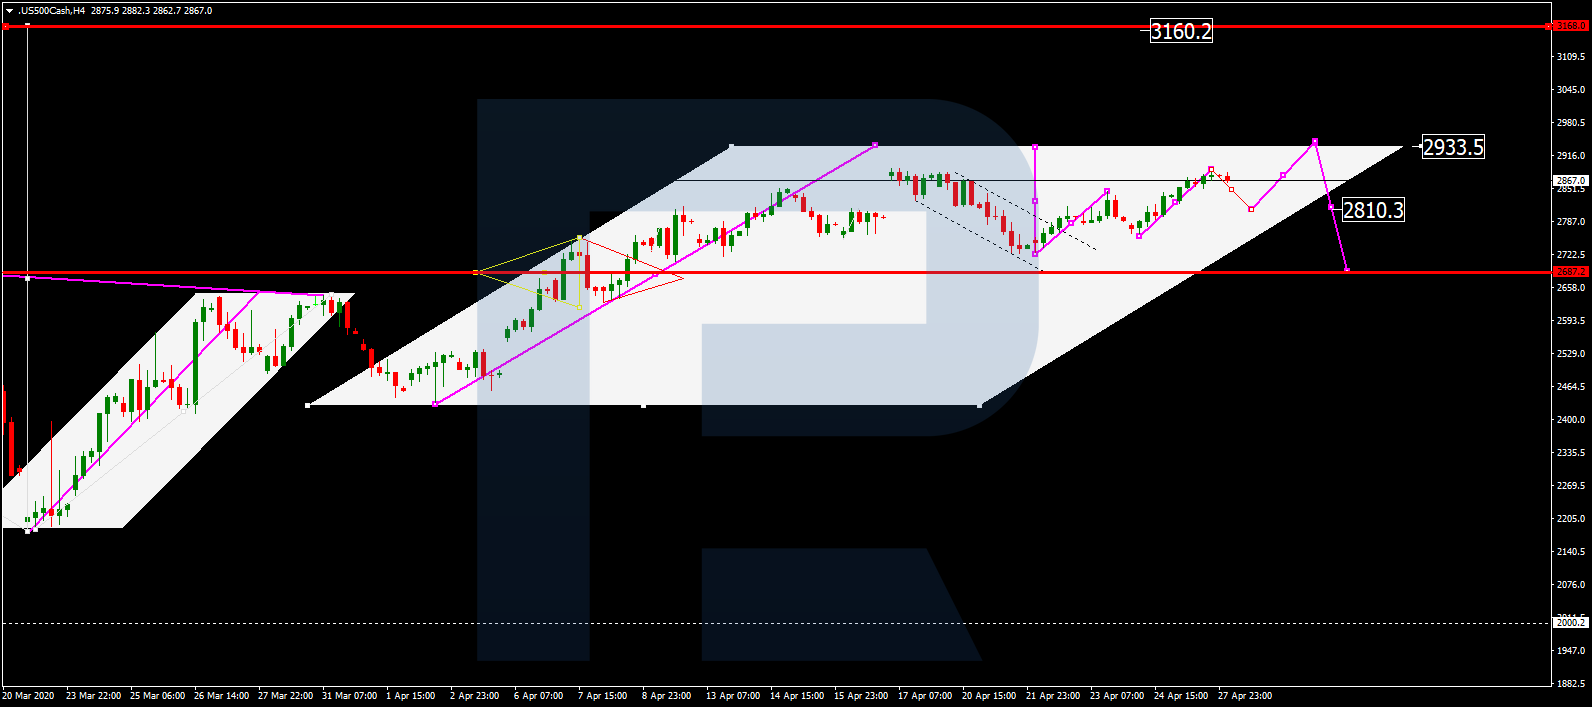
S&P 500
After reaching the short-term target at 2933.3, S&P 500 is still moving upwards. Today, the pair may extend this ascending wave and reach 2981.0. Later, the market may start another correction towards 2700.0 and the form one more ascending structure with the target at 3160.2