Forex Technical Analysis & Forecast 23.04.2020

Forex Technical Analysis & Forecast 23.04.2020

23.04.2020

EURUSD, “Euro vs US Dollar”

After breaking 1.0844 and then reaching 1.0803, EURUSD is consolidating above this level. Possibly, the pair may expand this range down to 1.0795 and then form one more ascending structure to break 1.0825. Later, the market may start a new correction to return to 1.0844 and then resume trading inside the downtrend with the target at 1.0750.

EURUSD
Risk Warning: the result of previous trading operations do not guarantee the same results in the future

GBPUSD, “Great Britain Pound vs US Dollar”

GBPUSD is still consolidating around 1.2323. Possibly, the pair may expand the range up to 1.2420 and then resume moving downwards with the first target at 1.2190.

GBPUSD
Risk Warning: the result of previous trading operations do not guarantee the same results in the future

USDRUB, “US Dollar vs Russian Ruble”

USDRUB is forming a new descending impulse towards 75.25 and may later grow to reach 76.40, thus forming a new consolidation range. If later the price breaks this range to the downside, the market may resume trading inside the downtrend with the target at 69.52; if to the upside – choose an alternative scenario to extend the wave up to 78.05 and then start a decline to reach the above-mentioned target.

USDRUB
Risk Warning: the result of previous trading operations do not guarantee the same results in the future

USDJPY, “US Dollar vs Japanese Yen”

After finishing the ascending structure towards 107.90 along with the correction at 107.66, USDJPY is expected to start another growth to reach 108.07. After that, the instrument may resume falling with the target at 107.50.

USDJPY
Risk Warning: the result of previous trading operations do not guarantee the same results in the future

USDCHF, “US Dollar vs Swiss Franc”

After breaking 0.9706 to the upside, USDCHF is expected to continue growing with the short-term target at 0.9745. Later, the market may correct towards 0.9660 and then form one more ascending structure to reach 0.9800.

USDCHF
Risk Warning: the result of previous trading operations do not guarantee the same results in the future

AUDUSD, “Australian Dollar vs US Dollar”

AUDUSD is still consolidating around 0.6280. Possibly, the pair may form one more ascending structure to reach 0.6363 and then resume trading inside the downtrend with the short-term target at 0.6214.

AUDUSD
Risk Warning: the result of previous trading operations do not guarantee the same results in the future

BRENT

Brent has completed the ascending impulse towards 25.40; right now, it is consolidating below this level. The mains scenario implies that the price may correct to reach 20.70 and then grow to break 25.40. Later, the market may resume growing towards 31.00 and then start a new correction to return to 25.40.

BRENT
Risk Warning: the result of previous trading operations do not guarantee the same results in the future

XAUUSD, “Gold vs US Dollar”

Gold has completed the ascending wave at 1718.10, which may be considered as the third ascending structure. Today, the pair may correct towards 1693.15 and then start another growth to reach 1727.47.

GOLD
Risk Warning: the result of previous trading operations do not guarantee the same results in the future

BTCUSD, “Bitcoin vs US Dollar”

After finishing the ascending structure towards 7140.00, BTCUSD is expected to consolidate around this level. According to the main scenario, the price may break the range to the upside and then continue trading upwards with the short-term target at 7520.00. Later, the market may start a new correction to reach 6800.00 and then form one more ascending structure towards 7700.00.

BITCOIN
Risk Warning: the result of previous trading operations do not guarantee the same results in the future

S&P 500

S&P 500 has finished the ascending impulse at 2816.0. Possibly, today the price may form a new consolidation range around this level. Later, the market may break it to the upside and continue growing towards 2927.6. After that, the instrument may start another correction to reach 2675.0 and then resume trading inside the uptrend with the target at 3160.2

S&P500
Risk Warning: the result of previous trading operations do not guarantee the same results in the future

(VIDEO) How to Properly Draw Support and Resistance Levels

(VIDEO) How to Properly Draw Support and Resistance Levels

1 Shares

The ability to properly draw support and resistance levels is one of the most basic skills every price action trader must have. It’s also the building block for everything that comes after it, including price action trading strategies like pin bars and inside bars as well as a proper risk to reward ratio.

Get it right and trading starts to become effortless. Get it wrong and your trading experience will most likely be a frustrating one.

In this lesson we’re going to define what a support and resistance level is, as well as why they form. We’ll also dive into how to properly identify these levels, and then we’ll finish things off with a few basic rules to trade by.

In short this lesson will help you keep your charts from looking like this…

bad support and resistance forex chart

And more like this…

nice forex support and resistance levels

A quick note before we get started. This lesson will only focus on horizontal support and resistance as I believe it to be the cornerstone on the topic of key levels.

I’ll save trend lines for a later lesson as they have many different facets that deserve more attention.

What is a Support and Resistance Level?

A support and resistance level is simply a level in a market at which traders find a price to be overvalued or undervalued depending on current market dynamics. This creates a level in the market that can act as support or resistance depending on various factors surrounding each currency.

So that’s the “fancy” definition of a support and resistance level. Now for the price action trader’s definition…

A level at which we can look for price action buy or sell signals such as the pin bar. That’s really all we need to know. We aren’t concerned about why a level has formed. Instead, we’re focused on how important that level is relative to the surrounding price action. If it’s deemed to be an important (key) level that we want on our chart, we simply wait and watch for a price action buy or sell signal to develop.

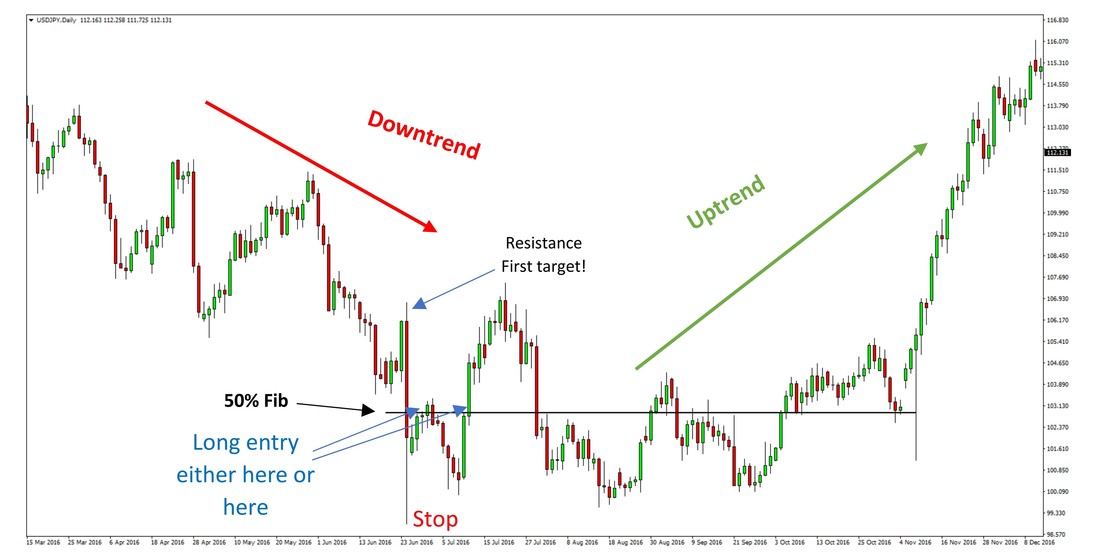
Here is a great example of a support and resistance level in action.

drawing support and resistance levels forex

What Causes These Areas to Form?

To understand why these levels form we have to go back to the supply and demand curve. I won’t spend too much time on this as the real benefit to support and resistance comes once you learn how to properly identify the levels.

Notice how in the supply curve below, the number of units for sale increases as price increases. To put this in trading terms – the higher the price, the more willing traders are to sell their positions.

supply curve

The demand curve, on the other hand, is the exact opposite. As price increases the number of units desired decreases. This is because traders are less willing to buy in a more expensive market.

demand curve

We can, therefore, label a support and resistance level as a point in the market where traders are more willing to buy or sell, depending on market conditions. This creates an area of tension between buyers and sellers, which often causes the market to change direction.

Here’s how that looks when it’s applied to a market such as GBPNZD.

support and resistance forex market

Now that we have a good understanding of how and why these areas form, let’s take a look at how to properly identify them.

How to Draw Support and Resistance Levels

The first thing I want to mention about support and resistance levels is that they aren’t always exact levels. In fact, most often these “levels” are better thought of as areas on your chart.

It’s a common misconception that a key level has to line up perfectly with highs and lows. This couldn’t be further from the truth as most support and resistance levels have areas where the market failed to respect it as either support or resistance.  This is the reason we use price action strategies like the pin bar as confirmation that a level is likely to hold.

I don’t know about you, but I learn best when I can see something in action. Which is why I created a video to show you how I go about drawing support and resistance on my own charts.

Video Thumbnail
5:16

If you’ll notice, the support and resistance levels I drew in the video didn’t always line up exactly with highs and lows, nor did the market always respect them. But that’s okay.

It’s important to understand that although properly drawn support and resistance levels can be a powerful asset, they aren’t without flaw. But as I mentioned earlier, that’s where price action signals come in to help us determine the strength of a level prior to placing a trade.

One last point about drawing your support and resistance levels. You should always aim to achieve the most touches possible on either side of the level. This usually requires you to move the level up and down a few times until you can find the place where the market touches that level the most from both sides (as support and also as resistance).

Remember that these levels represent areas in the market where traders are more willing to buy or sell, which can mean a change of direction in the market. So by moving a level to a place that achieves the most touches on either side, you stand the greatest chance of catching the move if and when it happens.

Rules to Trade By

Here are a few simple rules to follow that will vastly improve your ability to identify key areas of support or resistance.

Use swing highs and swing lows in the market to your advantage

By using the highs and lows as a guideline to start drawing your support and resistance levels, you’re more likely to capture the “key” levels. These are the levels that you should be interested in as they are the most likely to produce a valid price action buy or sell signal.

Don’t worry if the highs and lows don’t line up perfectly

Remember that most levels are not going to line up perfectly with highs and lows. Instead of worrying about a level lining up perfectly with highs and lows, you should spend some time making sure the level is at a place in the market that achieves the most touches on either side of the level.

Focus on the major (key) levels in the market

These are the most obvious support and resistance levels and should be immediately visible. If you have to search long and hard for a level, it probably isn’t worth placing on your chart. By only focusing on key levels you’ll be in a much better place to actually trade a price action signal when one shows up.

Stay within a six-month window

You don’t need to go back five years to find support and resistance levels. Most of the levels that you will need are going to come from highs and lows that have occurred within the last six months. Feel free to travel back in time once you have the level drawn, but don’t think it necessary to look back more than six months to find great levels to trade.

That wraps up this lesson on how to draw support and resistance levels. I hope you now have a better understanding of how to approach these levels and also which levels are most important.

Just remember to not over-complicate things. Drawing support and resistance levels should be one of the easier and stress-free things you do as a price action trader. In fact, I’ll go so far as to say that if you find yourself expending a lot of energy to find these levels, you’re probably drawing more levels than you actually need.

Keep it simple and most importantly, have confidence in your abilities! One of the bigger mistakes you can make is to second guess whether or not you’ve drawn a level correctly. It’s okay to double check your work, but just remember that your first instinct is usually the right one.

Forex Market Hours and Sessions in 2020

Forex Market Hours and Sessions in 2020

Knowing Forex market hours is essential for a new trader.

You need to know when the Forex market opens and closes as well as the four global sessions.

By the time you finish reading this post, you will have a complete understanding of the Forex hours and sessions.

Let’s begin!

Forex Trading Hours

At this point you may be asking, if Forex is indeed a 24 hour market, why can I only trade Monday through Friday?

This brings me to a very common misconception in the Forex world – the idea that the market closes on weekends. In truth, the Forex market never closes. The only thing that closes is the ability for retail traders to participate.

What is a retail trader, you ask? Put simply, a retail trader is someone who buys or sells for their personal account, and not for another company or organization. So unless you are an institutional trader, you are a retail trader.

So although the ability for retail traders to participate is halted over the weekends, the Forex market as a currency exchange is alive and well.

This is what creates so called “gaps” when the market opens at the beginning of the week. It’s simply the result of your broker updating their charts from last week’s price action to the current price action at the start of the trading week.

We’ll get into gaps in a later lesson. For now, just know that the market never closes due to the needs of international trade, as well as the needs of central banks and global industries to conduct business.

So what time does the Forex market open?

The Forex market opens for retail trade every Sunday at 5 pm EST. It then closes each Friday at 5 pm EST.

There are various sessions that occur around the world which make up the Forex hours each day. Let’s take a look at those market sessions.

Forex Market Sessions

Because this is a 24 hour market, there is always at least one active trading session. There are even times when these sessions overlap.

The easiest way to visualize how these Forex market sessions operate is to imagine the earth relative to the sun. Wherever the sun is shining, the Forex market is open. This is of course a simplified way of thinking about it, but it does help to visualize the Forex hours in this way.

The Forex market hours chart below shows the four sessions in Greenwich Mean Time (GMT).

chart of forex market sessions

Here is a breakdown of the chart above in Eastern Standard Time:

  • New York opens at 8:00 am to 5:00 pm EST
  • Tokyo opens at 7:00 pm to 4:00 am EST
  • Sydney opens at 5:00 pm to 2:00 am EST
  • London opens at 3:00 am to 12:00 noon EST

As you can see from the chart above, there are several market sessions which overlap. The most obvious, and the most heavily traded, is the London / New York overlap. This is when liquidity is at its highest as many Forex market participants prefer trading during this time.

What Are the Best Forex Trading Hours?

One of the most common questions among Forex traders is, when is the best time to trade? Like most things, it’s all relative to your trading style as well as your lifestyle. Obviously if you’re located in a part of the world where the London / New York session overlap occurs at 3 AM, this may not be the most advantageous for your lifestyle.

The great thing about trading price action on the higher time frames is that Forex hours and market sessions don’t particularly matter. For example, if you spot a bullish pin bar on the daily time frame, you would simply set your pending order and let the market decide what becomes of it. It doesn’t particularly matter which session triggers the order.

See my lesson on the best time frame for trading Forex for more information.

The Advantages and Disadvantages of a 24-Hour Market

Like most things, there are advantages and disadvantages to the Forex market being a 24-hour market.

I will note, however, that the disadvantages typically reign true with those just starting out. In fact, I feel confident in saying that the disadvantages below are what make the Forex market one of the more challenging markets to conquer as a beginning trader.

Advantages of a 24-Hour Market:

  • It offers the ability to trade at any time of the day regardless of where you live
  • There are very few gaps from day to day, unlike the stock market
  • More liquidity even during slower sessions

Disadvantages of a 24-Hour Market:

  • The 24 hour nature of the Forex market can lead to traders over-thinking their positions
  • The Forex market requires more self-discipline to take breaks away from trading due to the market never closing

The fact that the Forex market never sleeps means it’s easy to overtrade.

Instead of trading for a few hours each day, you may find yourself waking up early or staying up late just to place trades.

That’s a bad idea!

Furthermore, many new traders find it hard to take breaks from the market.

They feel the need to monitor their positions 24-hours a day.

This is one of the more destructive habits of new traders and is enabled by the fact that the Forex market never closes.

The good news is that these disadvantages are easily cured by a well-structured Forex trading course, discipline and no small amount of practice.

Final Words

I hope this lesson has shed some light on the subject of Forex market hours as well as the various market sessions that make up a 24 hour period.

Here are a few key points to keep in mind:

  • The Forex market is a 24 hour market that technically never closes
  • Retail traders are those who trade for their personal account
  • Retail trading hours in the Forex market are between 5pm EST on Sunday until 5pm EST Friday
  • There are 4 market sessions that make up the Forex market hours – London, New York, Sydney and Tokyo

Metatrader 4 Tutorial: Installation

Metatrader 4 Tutorial: Installation

Logo for Metatrader 4 (MT4)

Metatrader 4, also known as “MT4”, is perhaps the most widely used Forex trading platform in existence. Even its successor, Metatrader 5, hasn’t quite gained the same level of popularity among the Forex retail crowd.

In this Metatrader 4 tutorial, we’re going to walk through the installation process. By the end of this tutorial, you will have a firm understanding of where to download the program as well as how to install it on your computer.

MT4 Installation

Metatrader 4 can be downloaded from one of two places. You can either download the program directly from MetaQuotes from their dedicated MT4 website (metatrader4.com). Or you can download it from your broker’s website, provided they support it of course.

In my opinion, the easiest way is to download it from your broker. This way you can be sure that it’s configured properly so you can get started trading right away.

For purposes of this tutorial, however, I will be downloading the platform directly from MetaQuotes. The process to download it from your broker will be the exact same.

Step 1: Download the application

http://www.metatrader4.com

When you navigate to the page above, you should see a screen that looks similar to the image below.

The first thing you’re going to want to do is click the “Free Download” button. After clicking this button, a Metatrader 4 Setup window will appear, as shown in the image below. Check the box to agree to the license terms and click “Next”.

Downloading Metatrader 4 from MetaQuotes

The next window will give you installation options, such as whether or not you want to include a desktop shortcut.

Depending on your operating system, you may or may not get this dialog box. For example, my system took me straight to the “installation progress” screen, as shown below.

Metatrader 4 (MT4) installation progress screen

After clicking “Finish” on the screen above, the application will launch with the default settings. Once launched, you will be prompted with the following screen.

Step 2: Select Your Preferred Broker

Select your preferred broker or choose the default setting and click “Next”. This will connect your MT4 platform with your broker’s demo feed.

Opening a demo account with Metatrader 4

After selecting “Next” from the screen above, you will be prompted with an option to either open a new demo account or login to an existing account.

You will want to choose “New demo account” and click “Next” as shown in the image below.

Open a new demo account in MT4

Step 3: Enter Personal Details

The very next screen will prompt you with several fields, most of which are mandatory. Here you will need to enter your name, address, phone number, email address as well as your account type and currency.

As for the deposit amount, I always recommend that traders choose an amount that they are likely to trade with in a live account. So if you expect to eventually start with $1,000 of real money, don’t trade with a $50,000 demo account. It may sound like fun to trade with such a large amount, but it isn’t going to simulate a real trading environment, which is the purpose behind demo trading.

See #4 on the 5 Keys to Success as a Forex Trader.

Lastly, don’t forget to check the box that says “I agree to subscribe to your newsletters”. The program will not allow you to advance until you have checked this box.

MT4 opening a new account

After you have completed all required fields, click the “Next” button. This will launch MT4 and present you with the default chart layout.

You have successfully installed Metatrader 4.

Forex Trading for Beginners: 3 Profitable Strategies for 2020

The Forex market is filled with hundreds of different trading strategies, but what are the best Forex trading strategies for beginners? This is a common question among traders just starting out and for good reason.

It’s often said that a beginning trader is closer to becoming consistent profitable than a trader who has been trading unsuccessfully for years. This is because a beginning trader hasn’t had time to create any bad habits. The trader who has been struggling for years has to not only find what works best for them, but they also have to break any bad habits and put aside negative feelings they may have built up over the years.

But no matter if you’re a beginning trader or you’ve been trading for years, there are a few price action trading strategies that you should always keep in your back pocket. I welcome you to read on and learn three trading strategies that have become staples in my trading plan.

#1 Pin Bar Trading Strategy


When it comes to Forex trading for beginners, the pin bar is king. This is because it’s a very obvious pattern, making it easy to identify on a chart. It’s also one of the easier strategies to trade.

forex bullish pin bar at support

Notice how the market came into resistance during a rally but was soon able to break through that resistance. One of the basic principles of technical analysis is that former resistance becomes new support. Sure enough the market found support at former resistance and formed a bullish pin bar in the process.

Let’s take a look at a bullish pin bar that formed on the GBPCAD daily chart.

gbpcad bullish pin bars at support

In the chart above, GBPCAD met resistance after an extended move up. Once the market broke through resistance, it found new support and formed two bullish pin bars. Shortly after forming these pin bars, the market continued its rally for an additional 370 pips.

For more information on this particular strategy, see the lesson on the Forex pin bar trading strategy.

#2 Inside Bar Trading Strategy


Another highly-effective Forex trading strategy for beginners is the inside bar strategy. Unlike the pin bar, the inside bar is best traded as a continuation pattern. This means we want to use a pending order to trade a breakout in the direction of the major trend.

Below is an illustration of an inside bar during a rally.

forex inside bar trading strategy

Notice how the bar preceding the inside bar is much larger in size. This bar is called the “mother bar” because it completely engulfs the inside bar. The real magic to this strategy comes after the consolidation period, which is represented by the inside bar, on a break of the mother bar’s range.

Below is an inside bar that formed on the USDJPY daily chart during a strong rally.

usdjpy inside bar during rally

Notice how USDJPY was coming off of a very strong rally when it formed the inside bar on the chart above. These are the best inside bars to trade because it shows a true consolidation period which often leads to a continuation of the major trend, which in this case is up.

For more on this strategy, see the lesson on the inside bar trading strategy.

#3 Forex Breakout Strategy


Forex trading for beginners isn’t easy. But with the help of the breakout strategy below, you’ll be profiting in no time!

This strategy is different than most of the conventional breakout strategies out there. Instead of simply trading the actual break of a level, we’re waiting for a pullback and retest before entering.

Another difference here is that we’re only interested in breakouts that occur from a wedge pattern rather than a horizontal level.

Here is an illustration of the Forex breakout strategy.

forex wedge pattern breakout strategy

Notice how the market has worked itself into a terminal wedge, which simply means that the pattern must eventually come to an end. The opportunity to trade this pattern occurs when the market breaks to either side and then retests the level as new support or resistance. In the case of the illustration above, the entry would have come on a retest of support-turned-resistance.

Let’s take a look at the same breakout strategy but this time we’ll apply it to a USDJPY 4 hour chart.

forex breakout strategy from a wedge pattern

Notice how in the USDJPY 4 hour chart above, the market touched the upper and lower boundaries of the wedge several times before eventually breaking lower. As soon as the 4 hour bar closed below support, we could have looked for an entry on a retest of former support, which came just a few hours later.

Although the pin bar trading strategy is my favorite, I have had some of my largest trades using the Forex breakout strategy above. The market will often react quite aggressively after the breakout occurs, allowing traders to secure a large profit in a relatively short period of time.

Summary:


So there you have it. Three simple Forex trading strategies for beginners. These strategies are by far my favorite and for good reason. If used properly, they can quickly build your trading account into a sizeable amount. The best part is, they are extremely simple to understand and are therefore easy to incorporate into your trading plan.

Here are a few key points from the lesson:

  • The pin bar trading strategy is best traded as a reversal pattern in the direction of the major trend
  • The inside bar trading strategy is best traded as a continuation pattern
  • The Forex breakout strategy should be traded after a break and retest of either support or resistance
  • All you really need to become profitable trading Forex is two or three great trading strategies

rfxsignals April 7, 2020 No Comments

Rounding and Triple Tops and Bottoms

​Rounding Tops and Bottoms:

Rounding tops and bottoms are reversal patterns that form slowly and gradually, but once fully completed the eventual reversal is clearly evident and highly likely to occur.

It’s interesting to note that rounding formations will often appear together with other technical reversal patterns, like head and shoulders, double tops or bottoms, wedges etc.

Rounding and Triple Tops and Bottoms

​More precisely, classical reversal patterns will tend to appear inside of the rounding formation as part of the overall turn in the market sentiment.

​When this occurs it’s a stronger signal that the reversal will be genuine as multiple price levels and tools can now be used to confirm the validity of the reversal.

The rounding top and bottom formations should visually be roughly symmetrical, although of course perfect symmetry can be seldom expected in the real market.

The rounding formation will be usually outlined by a turning path in the trendlines highlighting the reversal of the prior trend. That is, in a rounding top the slope of the trendlines will change from up, to horizontal and finally, it will turn south sloping down just before the breakdown to confirm the reversal.

In a rounding bottom, the trendlines will follow exactly the same pattern only of course in the opposite order.​

All the rules and tactics that apply to a rounding top pattern are the same and should be applied to the rounding bottom pattern in reverse order, thus we will describe the approach for trading the patterns by using the bearish rounding top pattern.​

Entry rules:

  1. Identify a rounding top formation.
  2. Wait for a turn in the trendlines from up to horizontal to down (as shown in the chart examples below).
  3. Enter into the trade:

    A) Enter on a breakout of the support trendline (which can be either upward sloping or horizontal).

    B) Enter on the newly formed resistance trendline that helps to define the new downtrend.

    C) ​If the pattern is completely round, and there are no recognizable trendlines, which does happen sometimes, then the entry can be executed as price makes its turn toward completing the rounding formation. In this case, the Stop-Loss should only be placed above the highest high of the whole formation.

Initial Stop-Loss placement:

  • Above the highest high of the rounding top formation (this is the ultimate stop out level).
  • Or, alternatively, the stop can be placed behind the most recent swing high (keep in mind that although the risked amount is smaller with this approach it’s also more likely that the stop will be taken out before the trade moves in the desired direction).
AUDUSD 4h chart - Rounding top

Rounding and Triple Tops and Bottoms

AUDUSD 4h chart – Rounding top
Trade management:

If a resistance trendline is present toward the completion of the pattern (there usually is), then it should not be broken if the reversal is going to be genuine. Closing the trade is recommended if price returns back above the resistance trendline (in a bearish rounding top) and below the support trendline (in a bullish rounding bottom).

​The bullish case of the pattern is shown on the USDCAD chart below. Notice how the trendlines here took a turn from steep down to gradual down to gradual up and finally to a steep upward slope.

USDCAD M15 chart - Rounding bottom

Rounding and Triple Tops and Bottoms

USDCAD M15 chart – Rounding bottom
Profit-Targets:

  • There is no reliable approach to set profit targets based on the rounding top formation alone. However, we can use any other accompanying pattern to set profit targets (remember the rounding top pattern usually appears together with other technical patterns).
  • If no other patterns have formed, then support or resistance levels from higher timeframes can be used as reliable targets as is the case with most technical trading strategies.
    ​​
  • The trader must be aware of the potential risk-reward and always aim for a ratio of at least 1:1 or even better a 1:2 risk – reward ratio.

Triple Tops and Bottoms:

The triple top and the triple bottom are similar to the double top and double bottom patterns. In fact, a triple top consists of a double top plus one top just as a triple bottom consists of a double bottom plus an additional swing low.

​Yet, it’s fair to say that the triple top and triple bottom are somewhat more reliable than the double top and double bottom. After all, resistance that holds 3 times is stronger than resistance that holds twice, right?

A triple top is formed when price fails to break a double top, or better said fails to break below its neckline and instead runs for the highs one more time. Hence, it follows that the same rules for drawing the neckline on a double top or bottom pattern apply for drawing necklines on triple tops and bottoms as well.

The triple top and bottom patterns often appear together with, or as part of a larger range. In such situations, both patterns should be examined to arrive at a better judgment of the overall situation on the chart.

All the rules and tactics that apply for a triple top pattern apply for the triple bottom pattern as well, only in inverted order. We will describe the approach for trading the patterns by using the bearish triple top example.

Entry rules:

  1. Identify a triple top formation as described.
  2. Wait for a break of the neckline to the downside.
  3. The entry trigger is a close of the session below the neckline.

Additionally, it’s wise to take a look at Momentum oscillators and look for confirmation of the triple top pattern. Particularly bearish divergence on the oscillators can confirm that the prior uptrend is indeed slowing down and hence a bearish reversal is more likely.

Initial Stop-Loss placement:

  • Behind the highest top of the 3 tops (this is the ultimate stop out level).
  • Or, alternatively, the stop can be placed behind the most recent swing high (for a tighter stop).
A triple top pattern on the AUDNZD 5m chart

Rounding and Triple Tops and Bottoms

A triple top pattern on the AUDNZD 5m chart
Trade management:
Although, it doesn’t automatically negate the whole pattern price should not return back above the neckline on a close after it already broke it to the downside. If that happens it’s a warning sign that the pattern may fail.

The above 5m AUDNZD chart was an example of this situation, however, the pattern still worked in the end and price reversed.

After breaking below the neckline price should move in the breakout direction soon and in an orderly manner. If the price is just consolidating after breaking the neckline and possibly even coming back to it several times and playing with it then those are warning signs that the trade might not work out as planned.​

Profit targets:

  • Measure the vertical distance between the neckline and the highest point of the 3 tops / bottoms.
  • 1st target – Project this measurement from the neckline to the right of the chart.
  • 2nd target – Project 2x the 1st target.
  • 3rd target – Project 3x the 1st target.

​The bullish triple bottom is shown in the EURGBP example below. Notice how the pattern works exactly the same on the weekly timeframe as it does on the 5-minute timeframe.

EURGBP Weekly chart - Triple bottom

Rounding and Triple Tops and Bottoms

EURGBP Weekly chart – Triple bottom
rfxsignals April 7, 2020 No Comments

Master Candle Trading Strategy

The concept of the Master Candle is very popular in FOREX trading. There are different ways of looking at this trading strategy, but in its simplest form, a Master Candle is a candle which contains the highs and lows of at least the next four candles after it.

The formation of a true Master Candle can be seen on a chart if the next four candles are consolidating inside of the tall Master Candle.

Master Candle Trading Strategy

The Master Candle trading strategy is famous for the fact that it provides clear patterns and also helps in the identification of breakout points, making it especially useful for traders in the long run.
It is always useful to follow a certain set of guidelines or rules when using any trading strategy and the same is true for the Master Candle trading strategy. Following is a brief set of rules which should be kept in mind when using this particular trading strategy.

  1. You should not try to trade near a Support / Resistance (SR) zone.
  2. There should be no trade against a Support / Resistance zone that is closer than the Master Candle’s height.
  3. Only take a trade when a candle breaks the Master Candle’s High or Low.
  4. For Great British Pound / Japanese Yen (GBP/JPY) and Great British Pound / United States Dollar (GBP/ USD), the range of 40 to 105 pips is the most likely daily trading range and therefore it should be used as a general guide when day-trading the Master Candle strategy on these pairs.
  5. You should not be looking to trade if the size of the Master Candle is outside the above-mentioned pip range.
  6. When considering to enter a long position, use the formula, “Place buy stop pending order five pips above High of Master Candle + the Spread”.
  7. When considering to enter a short position, use the formula, “Place sell stop pending order five pips below low of Master Candle”.
  8. Profits will vary in pips and are dependent on the chosen currency pair and its volatility.
  9. It is recommended to always target the Master Candle size when exiting the trade. So, for example, if the Master Candle size is 40 pips, consider setting your profit target at 40 pips.
  10. Place your Stop-Loss order in the opposite direction of the entry at the other end of the Master Candle. So, in a long trade, the stop should be at the Master Candle’s low, while in a short trade the stop should be at the Master Candle’s high.
Master Candle on USDJPY 1h chart

Master Candle Trading Strategy

Master Candle on USDJPY 1h chart
It is also worth mentioning here that trading with the Master Candle is not a smooth road and in fact, some experts argue that this particular strategy gives a considerable number of false breakouts. This is especially true in the case of volatile pairs involving JPY. Hence, you must be looking for the so called Scouting Parties.

These are the candles which get reversed after breaking through the Master Candle which can, of course, lead to failed and losing trades. For this reason, some professional traders avoid entering on the first break of Master Candle. Instead, they wait till the formation of a scouting party and then enter after price breaks out of the scouting party.

It is true that the Master Candle is considered to be one of the simplest trading strategies and it is widely used because of this. Moreover, it is also known to provide favorable results.

However, the fact of the matter is that the results are not identical everywhere. Each trader trading in the FOREX market has his own style of decision-making and trading, hence, it is expected for results to differ even when following the same strategy.

Therefore, it is strongly recommended to develop your own understanding of the Master Candle trading strategy and master it with a trial and error approach. Take real life scenarios and make your decisions according to your experiences. Slowly, your knowledge and skills will be refined and you will be in a better position to make use of the Master Candle trading strategy.

rfxsignals April 7, 2020 No Comments

High Probability Tall Candle Reversal Forex Strategy

If you’ve been trading the Forex market for a while you’ve probably had the painful experience of buying right at the top or selling right at the bottom.

Equally bitter, is the experience of closing a position on a whipsaw spike, only to watch the price go in your original direction for another 100 or 200 pips without you.

Both of these situations are a trader’s nightmare, and even experienced traders can fall victims from time to time.

High Probability Tall Candle Reversal Forex Strategy

However, it’s important to realize that it’s a normal part of trading the Forex market and it’s best to be viewed as part of the learning process. By understanding these situations, we can better protect ourselves from losses and make profits as well.
This article partly explains why this phenomenon happens in the markets and further, we’ll discuss how you can profit from a common situation that often traps traders on the wrong side of the market.

Without further ado let’s get into the strategy.

How Does the Tall Candle Reversal Strategy Work?

The key to this strategy is monitoring how the price reacts after the tall candle is formed. A tall candle that is fully erased is a signal that the price will go in the opposite direction of that candle. The tall candle reversal strategy tries to capitalize on these situations.

1st condition is:
A significantly larger candle needs to be formed on the chart (at least 2 – 3 times larger than the bars preceding it).

Keep in mind, this situation is even better felt live than explained or noticed on a historical chart. The sudden huge spike in volatility and wild price action in those moments are what usually characterizes such a spiking candle.

The reasons for these kinds of wild price action are usually a surprise in the fundamentals of the currency pair or a panic among traders hence a sharp move is triggered.

2nd condition:
We are looking to see whether the gains, or the losses caused by the big candle stick are reversed.

3rd condition:
The 50% retracement needs to be broken on a close.

We measure the 50% point of the tall candle (from its high to its low) which acts as the trigger point for a trade. Very often the 50% retracement of tall candles acts as support or resistance and once it’s broken it usually means that the whole candle will be erased soon.

Entry signal:
Long: Buy on a close above the 50% Fib retracement (in this case we trade a tall red candle that is reversed to the upside).

Short: Sell on a close below the 50% Fib retracement (in this case we trade a tall green candle that is reversed to the downside).

It’s even better if the break of the 50% retracement occurs on strong momentum which will just help to confirm the reversal.

Stop-Loss:
Long: Below the low of the tall bar

Short: Above the high of the tall bar

Profit-Targets:
Support and resistance on larger timeframes or trailing Stop-Loss to ride the trend

Why this Strategy Works?

If the tall candle is fully reversed it means that investors strongly believe in the trend that they are comfortable erasing such a sharp and large move. The fact that a huge move was completely erased is enough of a proof that there is strong buying or selling pressure in the market.

Further, all the traders that got in on the spike have their Stop-Losses behind the spike and now when those Stop-Losses are taken out it creates an additional squeeze contrary to the direction of the tall candle and in the direction of the trend.

Most often, if it’s going to be reversed, the tall candle will not close near the highs (in an uptrend) or near the lows (in a downtrend). But instead, it will have a reasonably long wick, or even better a very long wick. Of course, the longer the wick the stronger the reversal signal.

This strategy tends to work even better if a strong trend precedes the big candle in the contrary direction (as is the case on the EURUSD example below).

Trade Examples

EURUSD:
On this 15-minute EURUSD chart, we can see a strong uptrend from left to right on the chart with the tall candle in the middle. The tall bearish candle engulfs the 70 previous bars on the close and 80 previous bars when its wick is taken into account. That’s quite a shock given the uptrend that was in place before it.

However, the whole shock, the spike, and the tall candle are just a fake-out. Imagine how many Stop-Losses of traders who were riding the uptrend were taken out!

Eventually, in such situations, as is evident from the following chart, the fake move is quickly and completely reversed and the uptrend continues at about the same pace.

EURUSD 15 - min chart - The uptrend continued after a brief but deep retracement

High Probability Tall Candle Reversal Forex Strategy

EURUSD 15-min chart: The uptrend continued after a brief but deep retracement
USDJPY Brexit example:
This USDJPY daily chart is a striking example of this pattern in action.

Namely, the low reached here is on Brexit day, right in the aftermath of the vote which triggered a broad risk-off move in markets and as a result, USDJPY fell all the way to 99 from 106. A 700 pips move in a matter of hours, and yet it turned out to be a multi-month low as is apparent now in 2017.

However, upon closer inspection, again, the 50% retracement of the tall candle acted as resistance and as the key level for the reversal later. The 50% line was first penetrated without a decisive close above it, and as a result the market went for another retest of lower levels. However, even the fact that the price reached the 50% level is significant by itself.

Though, the final confirmation for the trade comes on the second push above the 50% line with a decisively tall green candle. The full reversal of the tall candle to the upside is just a matter of time now.

Note that in this example, in contrast to the EURUSD example, the tall red bar came after a downtrend!

Hence, the difficulty of the market erasing it and the time it needed to march higher on the new uptrend can be attributed largely to the previous overall trend which was down.

USDJPY Spikes down and eventually reverses - Daily Chart

High Probability Tall Candle Reversal Forex Strategy

USDJPY Spikes down and eventually reverses – Daily Chart
rfxsignals April 7, 2020 No Comments

Larry Williams OOPS Trading Strategy

Talking about trading systems, Larry Williams’ OOPS system still remains to be one of the most popular trading systems today. Larry presented his short term trading methodology in his famous book “How I Made One Million Dollars Trading Commodities”.

Today, a lot of different variations of this system are used worldwide by professional traders.

Larry Williams OOPS Trading Strategy

The OOPS pattern, as discussed by Larry Williams, is observed when:

  1. The daily bar opens below the previous day’s low.
  2. Or when the daily bar opens above the previous trading day’s high.

The theory behind this pattern is very simple and logical. Larry believes that non-professional traders check common charts at night and enter their orders for the upcoming day.

On the other hand, professional traders wait for the trend to be actually developed in the day and place their orders accordingly at the daytime.

Hence, if the market opens considerably lower or higher than yesterday’s range, it is an indication of the panic of non-professional traders. This provides a great opportunity to professional traders to use the non-professionals’ emotions against them by placing a contrarian trade and earn profits.

Basically, it is a gap trading strategy which means that it is based on fading the direction of the opening gap.

What happens is that non-professional traders usually overreact to some important news even before the market opens and create the gap when the market opens (especially in case of stocks, commodities or stock indices). This gap is the result of the opinion of the average crowd.

Gap Trading Strategy

Soon, these traders notice that they overreacted in response to the initial event or news. At this point, the traders realize their mistake and reevaluate their position. This causes prices to reverse and a movement in the opposite direction occurs.

This trading system provides a lot of valuable information related to buying and selling in the FOREX market, even though gaps occur rarely since it’s a 24-hour market. However, weekend gaps at the open are quite common in the FOREX market, so the OOPS trading system will work best on daily and weekly charts.

The OOPS buy strategy is explained in the following points:

  1. There needs to be an existing downtrend on the chart for at least a few trading sessions. This will be usually indicated by several red candles on the daily or weekly chart.
  2. During the last stage of the downtrend, the market needs to gap down way below yesterday’s low. This gives rise to the OOPS buy signal.
  3. As reevaluation by investors happens, the price starts rising and crosses yesterday’s low and yesterday’s close. This generates the buy signal and a long trade should be initiated here.
  4. The Stop-Loss is the low of the same day.

Similarly, the OOPS sell is generated according to the following pattern:

  1. Closely observe the chart and find if there is a prolonged uptrend for at least few trading sessions indicated by white or green candles.
  2. During the last stage of the uptrend, a gap higher should occur to beget the OOPS sell. It’s even better if the price opens much higher than the yesterday’s high.
  3. As reevaluation by investors progresses, the price starts falling and eventually crosses yesterday’s high and yesterday’s close. A short trade should be opened once this has occurred.
  4. The Stop-Loss is the high of the same day.
USDJPY Daily timeframe - An example of Larry Williams’ OOPS sell

Larry Williams OOPS Trading Strategy

USDJPY Daily timeframe – An example of Larry Williams’ OOPS sell
The Larry Williams OOPS pattern has been used by numerous investors and traders and it is known to have a high level of accuracy and validity. It provides an opportunity to get valuable profits from fading the gaps.

However, it is still very important to remember that it is not a purely mechanical concept and it is possible for variations to occur in this system. Also a proper exit strategy should be defined as well.

Therefore, the best way to get started with the OOPS pattern is to use trial and error method. It is you who will have to figure out the best application of the OOPS system in different trading conditions and across different markets.

rfxsignals April 7, 2020 No Comments

London Session Forex Breakout Strategy

The London session breakout strategy provides excellent opportunities to profit on the high volatility and volume beginning at the opening of the London trading session at 7 AM GMT and lasting for the next 3 hours into the session.

This strategy is based on the surge in volatility at the opening of the London session immediately following the much less volatile Asian trading session.

London Session Forex Breakout Strategy

The sudden change in volatility and volume between the quiet Asian session and the busy – volatile London session makes the occurrence of a breakout highly probable and hence the high probability of success with the London session breakout strategy.

​Traders who are aware of this can trade accordingly and reap significant gains.

​The best time to use the London open breakout strategy is when volatility is at its highest – during the first 3 hours of the London session after which volatility tends to die out before picking up again at the opening of the New York session.

​How to Set Up a Winning Breakout Trade in the London Session?

In order to make the most of the London session, traders should trade only the major currency pairs such as the EUR/USD, the GBP/ USD, and the USD/JPY.

The hourly chart has proven to be the best timeframe to use for this strategy since the opportunities exist for just approximately 3 hours.

One indicator is used for this strategy and that’s the 50-period simple moving average (SMA).

Ensure that you are online at 7:00 GMT at which point you should take a look at the last 4 candlesticks (considering we use H1 time-frame) and note the highest high and the lowest low of those 4 candlesticks (4 hour period). This is the Asian trading range that we are looking for price to break out of.

Buy signal
So, if the next candlestick goes above the highest high of the previous 4 candles, and if the price is above the 50 SMA, then that’s a signal to go long on the currency pair.

  • Place your stop loss below the lowest low of the last 4 candles.
  • The take profit target is the height of the range projected above the breakout.

Sell signal
If however, the price breaks below the lowest low of the range and price is below the 50 SMA then that’s a signal to take a short trade.

  • Place your stop loss above the highest high of the last 4 candles.
  • The take profit target is the height of the range projected below the breakout.

An example is shown on the 1-hour GBPUSD chart below.

The Asian trading range is marked with the blue rectangle.

​It’s wise to take profit on half of the position at the target, and let the other half run in case the move continues.

London Session Breakout Strategy - GBPUSD trade example

London Session Forex Breakout Strategy

You can also use pending orders so that there is no need for you to constantly watch the price moves and basically with that it will be almost like trading on autopilot.

Only one trade per day should be executed and all trades should be manually closed at the end of the day if the Stop-Loss or Profit-Target is not initiated.

Regarding risk management with the London session breakout strategy, it’s best to not risk more than 1% – 2% of your account (as with any other forex trading strategy – the exact risk % depends on your money management).

Some traders prefer to use the previous 3 candles rather than the previous 4 candles. Both strategies give similarly good results so, in the end, it’s up to you to test and decide which one works better for you.