Ichimoku Cloud Analysis 31.12.2019 (AUDUSD, NZDUSD, USDCAD)

Ichimoku Cloud Analysis 31.12.2019 (AUDUSD, NZDUSD, USDCAD)

31.12.2019

AUDUSD, “Australian Dollar vs US Dollar”

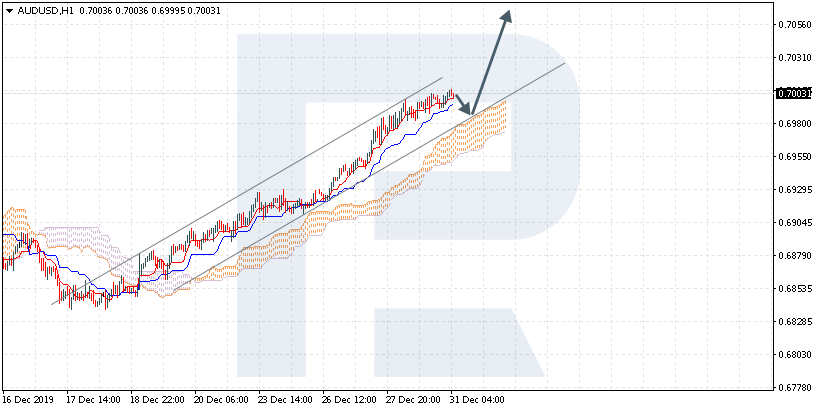
AUDUSD is trading at 0.7003; the instrument is moving above Ichimoku Cloud, thus indicating an ascending tendency. The markets could indicate that the price may test the cloud’s upside border at 0.6990 and then resume moving upwards to reach 0.7055. Another signal to confirm further ascending movement is the price’s rebounding from the rising channel’s downside border. However, the scenario that implies further growth may be canceled if the price breaks the cloud’s downside border and fixes below 0.6940. In this case, the pair may continue falling towards 0.6870.
AUDUSD
Risk Warning: the result of previous trading operations do not guarantee the same results in the future

NZDUSD, “New Zealand Dollar vs US Dollar”

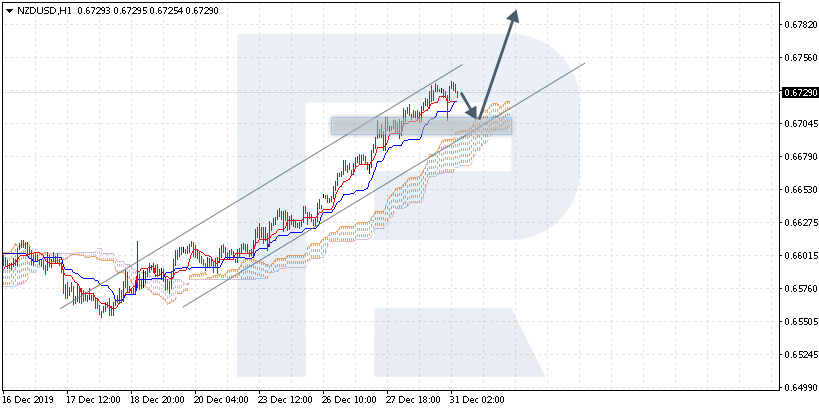
NZDUSD is trading at 0.6729; the instrument is moving above Ichimoku Cloud, thus indicating an ascending tendency. The markets could indicate that the price may test the cloud’s upside border at 0.6705 and then resume moving upwards to reach 0.6785. Another signal to confirm further ascending movement is the price’s rebounding from the support level. However, the scenario that implies further growth may be canceled if the price breaks the cloud’s downside border and fixes below 0.6655. In this case, the pair may continue falling towards 0.6580.
NZDUSD
Risk Warning: the result of previous trading operations do not guarantee the same results in the future

USDCAD, “US Dollar vs Canadian Dollar”

USDCAD is trading at 1.3049; the instrument is moving below Ichimoku Cloud, thus indicating a descending tendency. The markets could indicate that the price may test the cloud’s downside border at 1.3070 and then resume moving downwards to reach 1.2975. Another signal to confirm further descending movement is the price’s rebounding from the descending channel’s upside border. However, the scenario that implies further decline may be canceled if the price breaks the cloud’s upside border and fixes above 1.3110. In this case, the pair may continue growing towards 1.3190.

USDCAD

The Pound recovered and is ready to embrace a landmark year. Overview for 31.12.2019

The Pound recovered and is ready to embrace a landmark year. Overview for 31.12.2019

31.12.2019

GBPUSD reached stability at the end of the year but 2020 is anticipated to be as volatile as 2019.

By the end of 2019, the British Pound managed to pull itself out of a dive but the upcoming year is very unlikely to be easy for the British currency.

As early as at the beginning of January, the British Parliament will face a difficult task to ratify the agreement with the European Union. The Brexit deadline is January 31st, 2020 and if the exiting procedure fails to feature a somewhat proper trade agreement, the national currency will certainly suffer from stress.

The Bank of England is not expected to introduce any significant changes to its monetary policy in 2020, at least in the first six months. Most likely, the British regulator will continue watching the Brexit and talks with the European Union relating to the second phase of the exiting procedure.

The first BoE meeting is scheduled for January 31st, 2020. It’s not clear whether it is a coincidence or not, but looks pretty symbolical.

Moreover, in January the BoE Governor Mark Carney will be replaced by Andrew Bailey, the Chief Executive Officer of the Financial Conduct Authority. Basically, Bailey is not expected to significantly change the monetary policy of the British regulator, at least in winter. The future remains to be seen.

Everything that is going to have a significant influence on the British currency is the Brexit and the Brexit alone. In this light, macroeconomic reports to be published by the United Kingdom go on the back burner. So, if the exiting procedure goes off without a hitch, the Pound will remain standing.

Murrey Math Lines 31.12.2019 (AUDUSD, NZDUSD)

Murrey Math Lines 31.12.2019 (AUDUSD, NZDUSD)

31.12.2019

AUDUSD, “Australian Dollar vs US Dollar”

As we can see in the H4 chart, AUDUSD is moving at near 3/8. In this case, the pair is expected to test this level, rebound from it, and then resume falling towards the support at 1/8. However, this scenario may no longer be valid if the price rebounds from 3/8 to the upside. After that, the instrument may continue growing to reach the resistance at 4/8.

AUDUSD_H4
Risk Warning: the result of previous trading operations do not guarantee the same results in the future

In the M15 chart, the pair may break the downside line of the VoltyChannel indicator and, as a result, continue trading downwards.

AUDUSD_M15
Risk Warning: the result of previous trading operations do not guarantee the same results in the future

NZDUSD, “New Zealand Dollar vs US Dollar”

As we can see in the H4 chart, NZDUSD is moving above 5/8. According to the main scenario, the pair is expected to continue growing to reach the resistance at 8/8. However, this scenario may no longer be valid if the price breaks 5/8 downwards. After that, the instrument may start a new decline towards the support at 3/8.

NZDUSD_H4
Risk Warning: the result of previous trading operations do not guarantee the same results in the future

In the M15 chart, the pair may break the upside line of the VoltyChannel indicator and, as a result, continue moving upwards.

NZDUSD_M15
Risk Warning: the result of previous trading operations do not guarantee the same results in the future

Japanese Candlesticks Analysis 31.12.2019 (EURUSD, USDJPY)

Japanese Candlesticks Analysis 31.12.2019 (EURUSD, USDJPY)

31.12.2019

EURUSD, “Euro vs. US Dollar”

As we can see in the H4 chart, the ascending channel continues. By now, EURUSD has formed several reversal candlestick patterns, including Hanging Man, close to the channel’s upside border. We may assume that later the price may reverse and get back to 1.1136 to continue the ascending tendency. However, one shouldn’t exclude a possibility that the price may continue growing towards 1.1257.

EURUSD
Risk Warning: the result of previous trading operations do not guarantee the same results in the future

USDJPY, “US Dollar vs. Japanese Yen”

As we can see in the H4 chart, the pair is trading near the rising channel’s downside border and has already formed Hammer pattern. The current situation implies that the price may reverse and then resume growing towards 109.60 to continue the ascending tendency. At the same time, the pair may choose another scenario and start a new decline to reach 108.50.

USDJPY

Forex Technical Analysis & Forecast 31.12.2019 (EURUSD, GBPUSD, USDCHF, USDJPY, AUDUSD, USDRUB, USDCAD, GOLD, BRENT, BTCUSD)

Forex Technical Analysis & Forecast 31.12.2019 (EURUSD, GBPUSD, USDCHF, USDJPY, AUDUSD, USDRUB, USDCAD, GOLD, BRENT, BTCUSD)

31.12.2019

EURUSD, “Euro vs US Dollar”

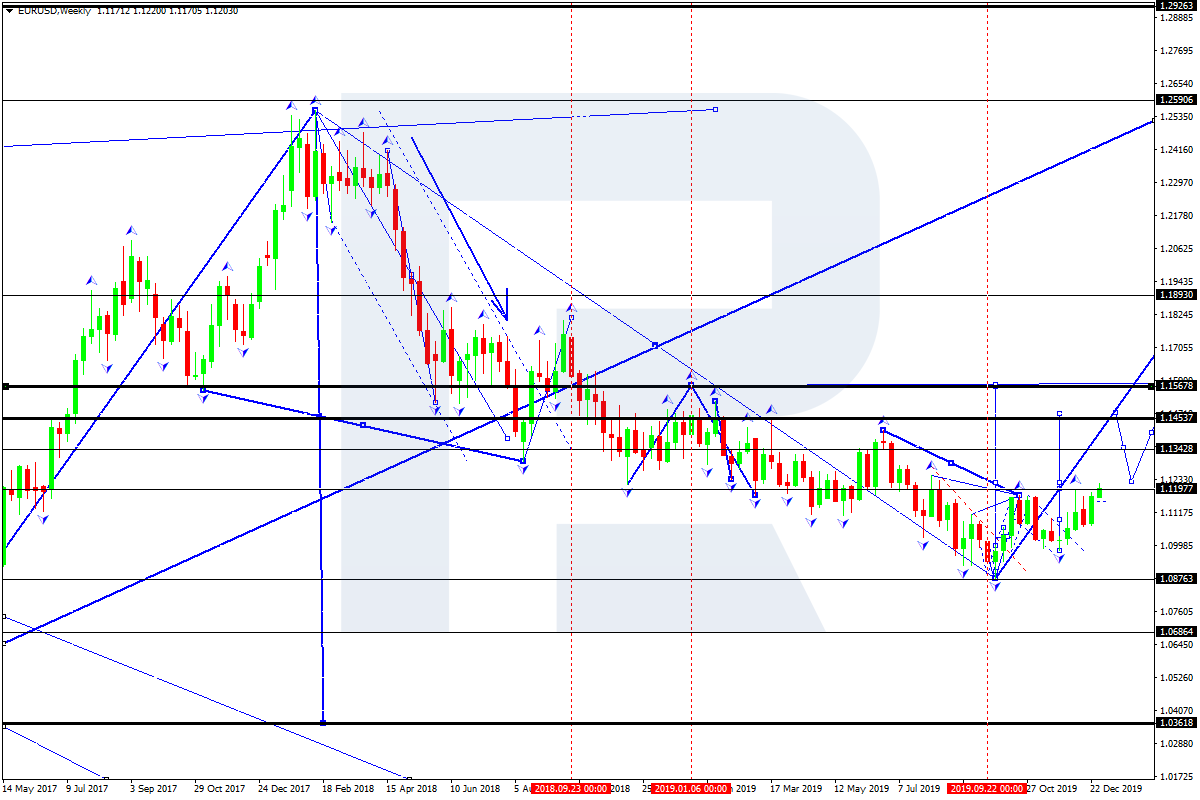
EURUSD is forming the first ascending wave towards 1.1550. After that, the instrument may start a new correction to reach 1.1200 and then form one more ascending structure with the target at 1.1900. Later, the market may start another correction to return to 1.1550 and resume moving upwards to reach 1.2900. This level is considered as the key target for the entire year of 2020.

EURUSD
Risk Warning: the result of previous trading operations do not guarantee the same results in the future

GBPUSD, “Great Britain Pound vs US Dollar”

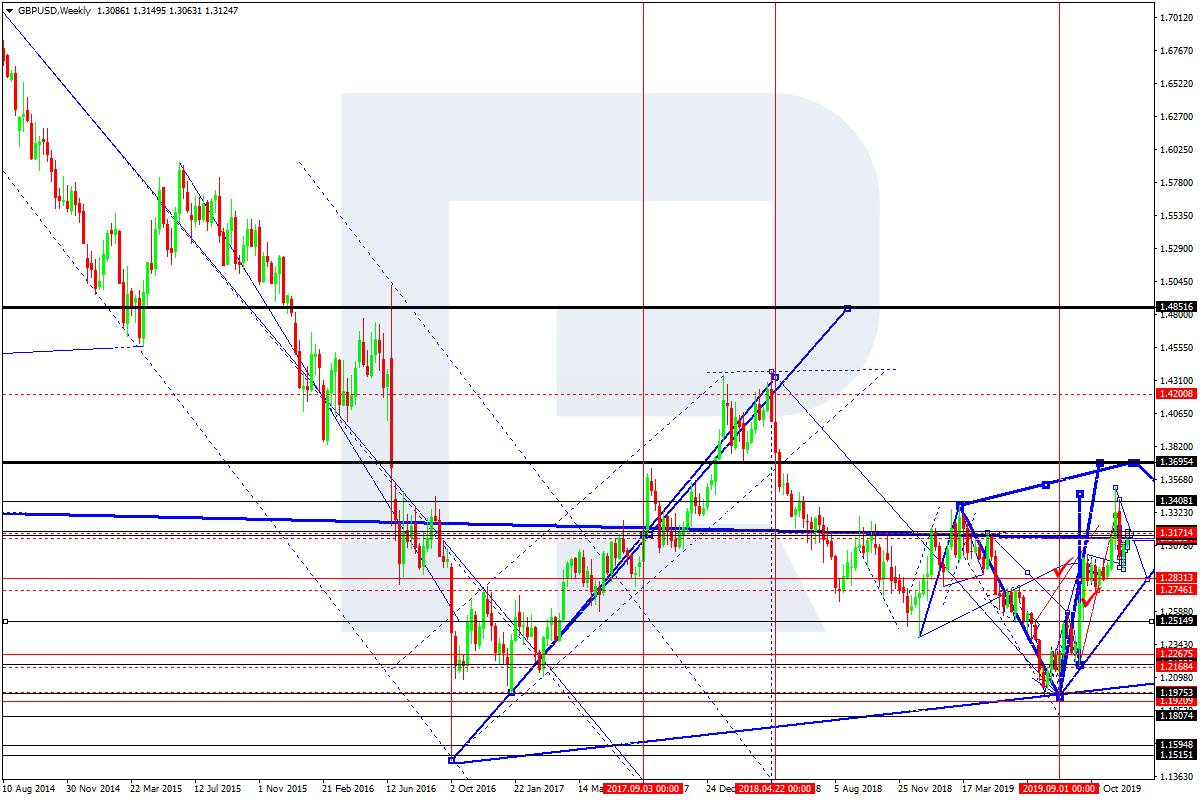
GBPUSD is forming the fifth ascending wave with the target at 1.3690. Possibly, the pair may reach this level and then start a new correction towards 1.2850. Later, the market may form the third wave to reach 1.4000 and then start another correction towards 1.3700. After that, the instrument may form one more ascending structure with the target at 1.4850. This level is considered as the key target for the entire year of 2020.

GBPUSD
Risk Warning: the result of previous trading operations do not guarantee the same results in the future

USDCHF, “US Dollar vs Swiss Franc”

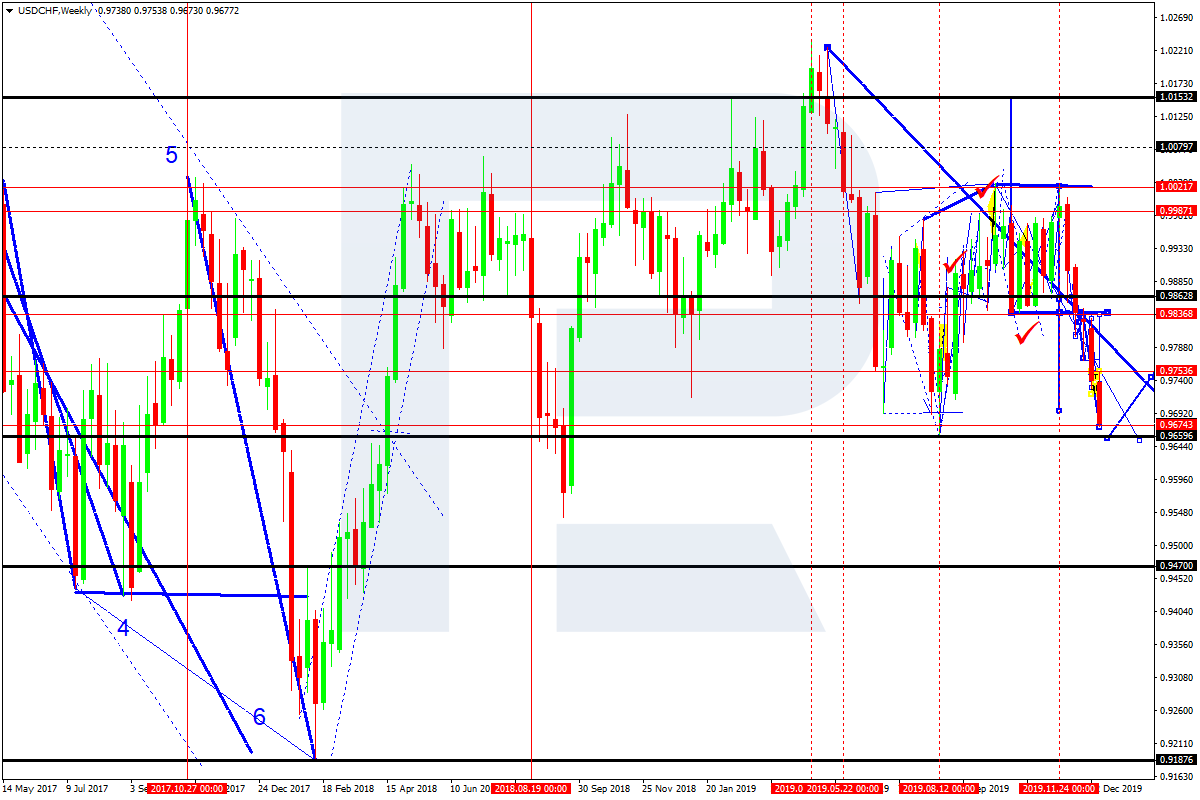
After breaking 0.9850 to the downside, USDCHF may continue the correction towards 0.9660. After that, the instrument may reverse and correct to reach 0.9850, thus forming a wide consolidation range. If later the price breaks this range to the downside, the market may continue trading inside the downtrend towards 0.9450. This level is considered as the key target for the entire year of 2020.

USDCHF
Risk Warning: the result of previous trading operations do not guarantee the same results in the future

USDJPY, “US Dollar vs Japanese Yen”

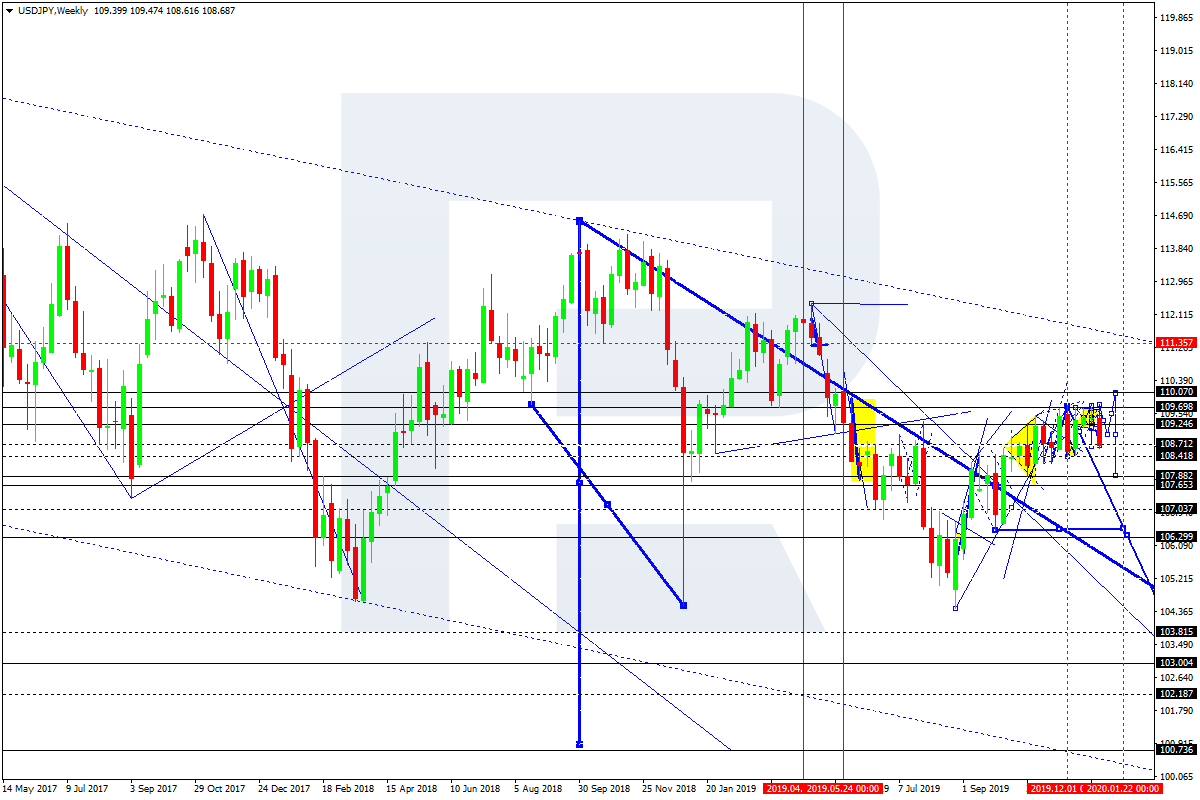
USDJPY has broken 109.14 to the downside. Possibly, the pair may start the fifth descending wave towards 103.00. This level is considered as the key target for the entire year of 2020. However, the first downside target is at 107.90.

USDJPY
Risk Warning: the result of previous trading operations do not guarantee the same results in the future

AUDUSD, “Australian Dollar vs US Dollar”

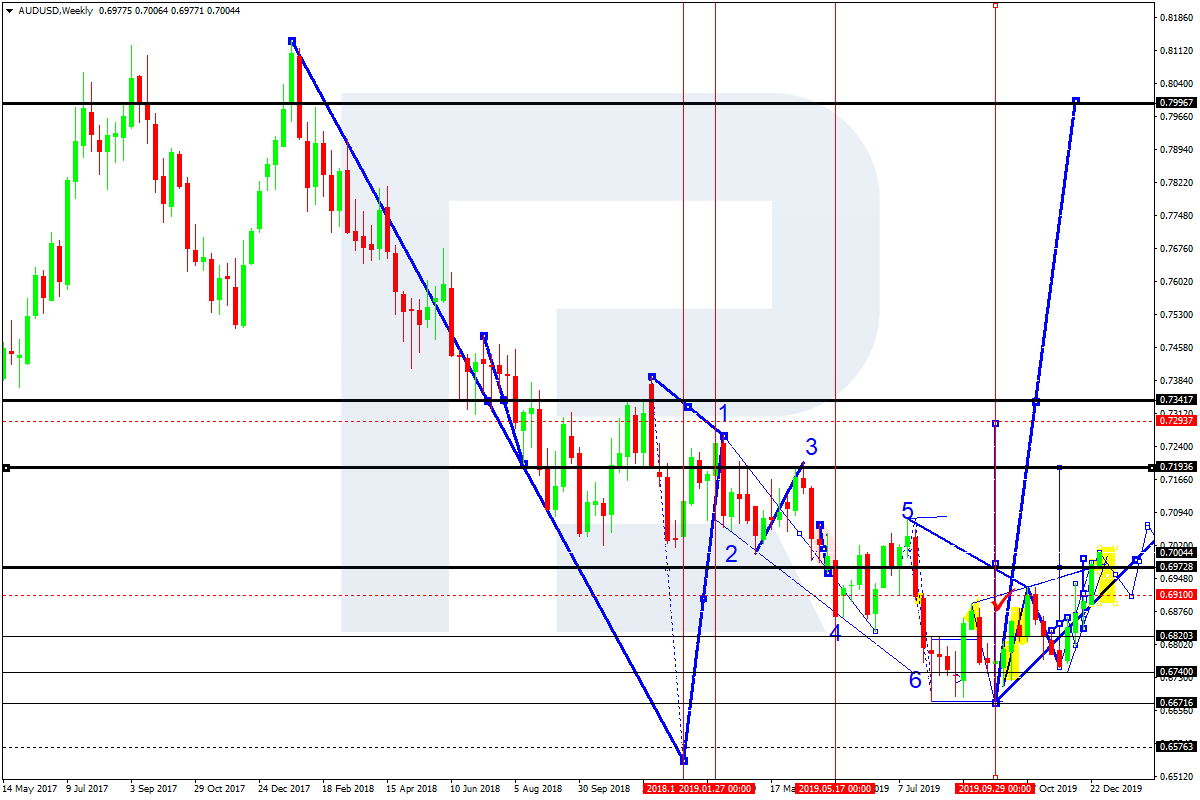
AUDUSD is trading to break 0.6970 upwards. Possibly, the pair may consolidate around this level and even start a new correction towards 0.6900. If later the price breaks this range to the upside, the market may form the third ascending wave to reach 0.7200 and then start another correction towards 0.7000. After that, the instrument may form one more ascending structure with the target at 0.7300. This level is considered as the key target for the entire year of 2020.

AUDUSD
Risk Warning: the result of previous trading operations do not guarantee the same results in the future

USDRUB, “US Dollar vs Russian Ruble”

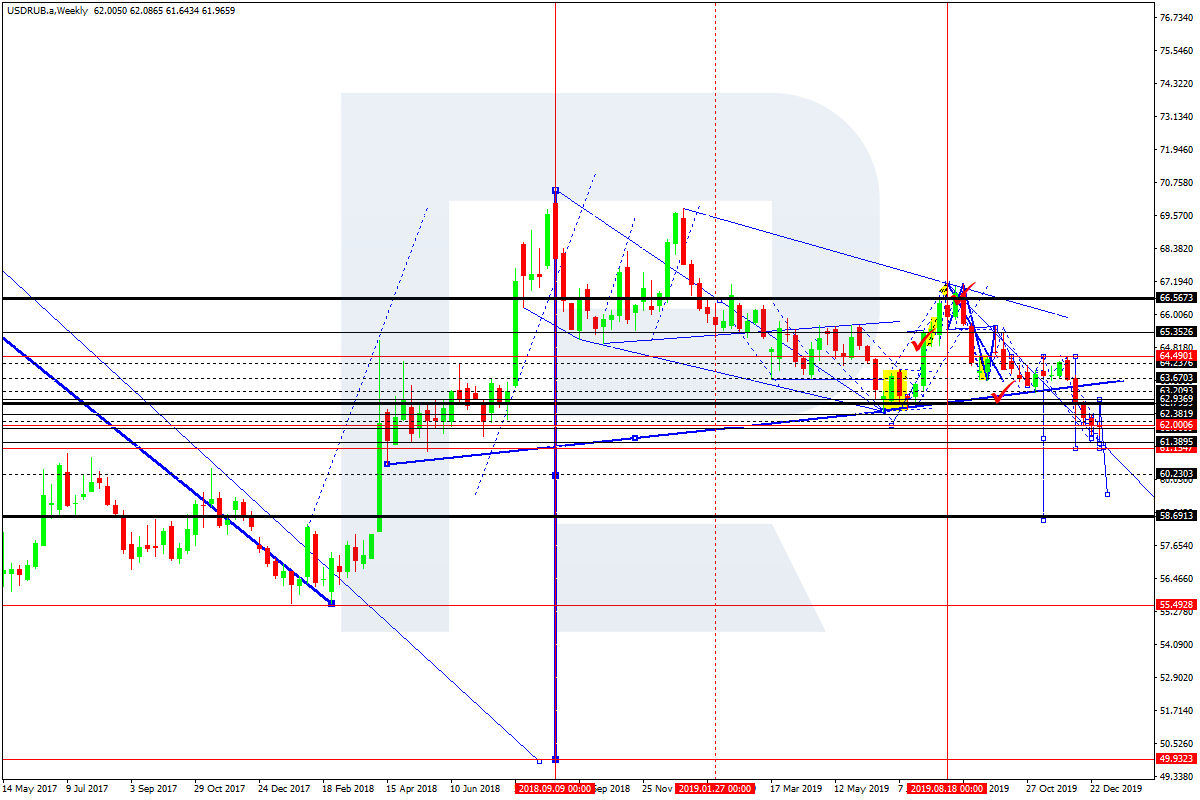
USDRUB has broken 63.00 and may continue trading inside the downtrend towards 55.00. This level is considered as the key target for the entire year of 2020.

USDRUB
Risk Warning: the result of previous trading operations do not guarantee the same results in the future

USDCAD, “US Dollar vs Canadian Dollar”

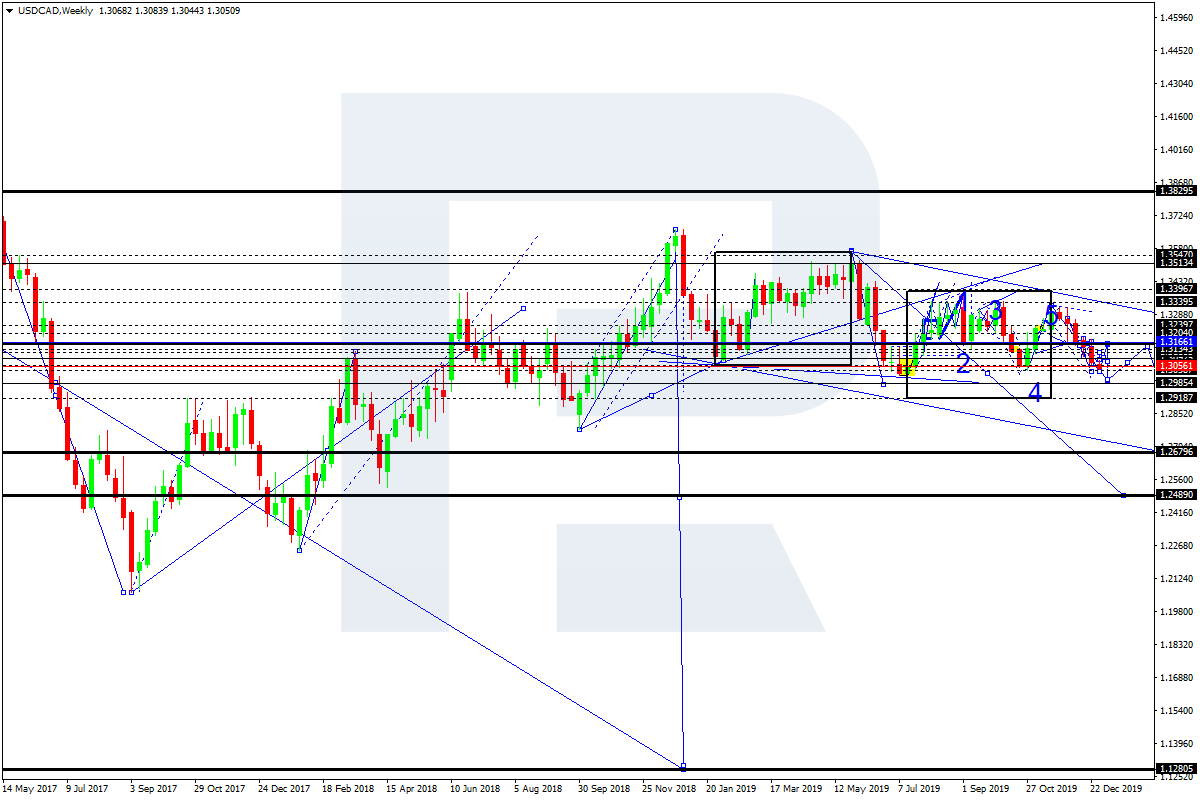
USDCAD is still moving downwards to reach 1.2960. Later, the market may start another correction towards 1.3200 and then form a new descending structure to reach 1.2680. This level is considered as the key target for the entire year of 2020.

USDCAD
Risk Warning: the result of previous trading operations do not guarantee the same results in the future

XAUUSD, “Gold vs US Dollar”

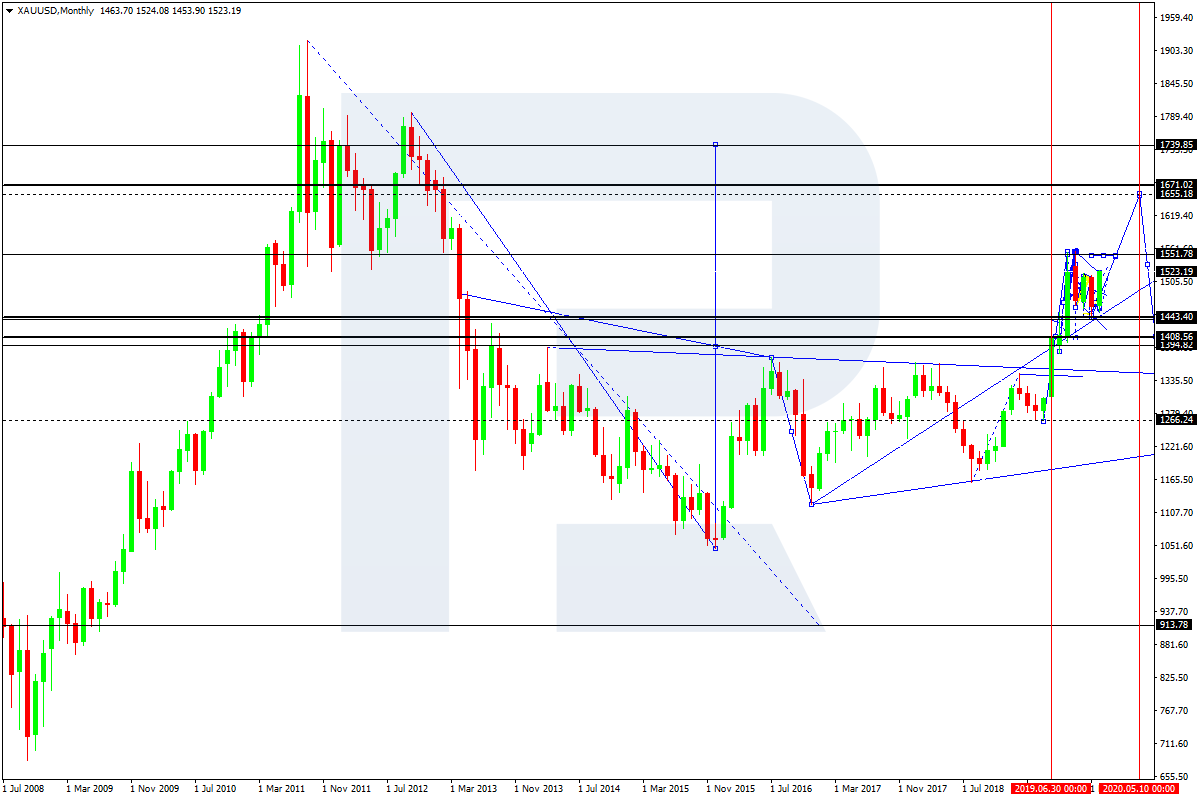
Gold continues moving upwards; it has almost rebounded from 1447.00 to the upside. Possibly, the pair may continue trading inside the uptrend with the short-term target of the third ascending wave at 1660.00. After that, the instrument may start a new correction to reach 1550.00 or even 1400.00. Later, the market may resume moving upwards with the target at 1685.00. This level is considered as the key target for the entire year of 2020.

GOLD
Risk Warning: the result of previous trading operations do not guarantee the same results in the future

BRENT

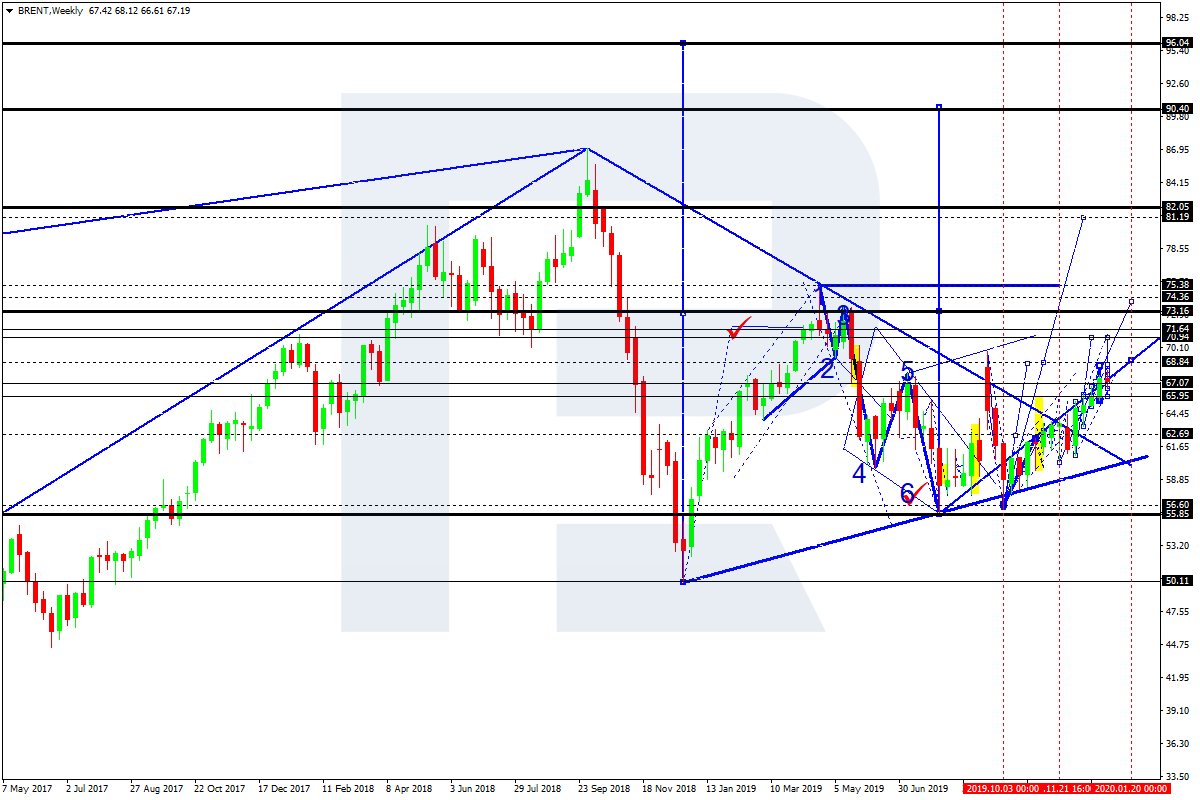
Brent continues forming the third ascending wave. Possibly, the pair may break 68.80 and form an upside continuation pattern. The short-term upside target is at 82.00. This level is considered as the key target for the entire year of 2020.

BRENT
Risk Warning: the result of previous trading operations do not guarantee the same results in the future

BTCUSD, “Bitcoin vs US Dollar”

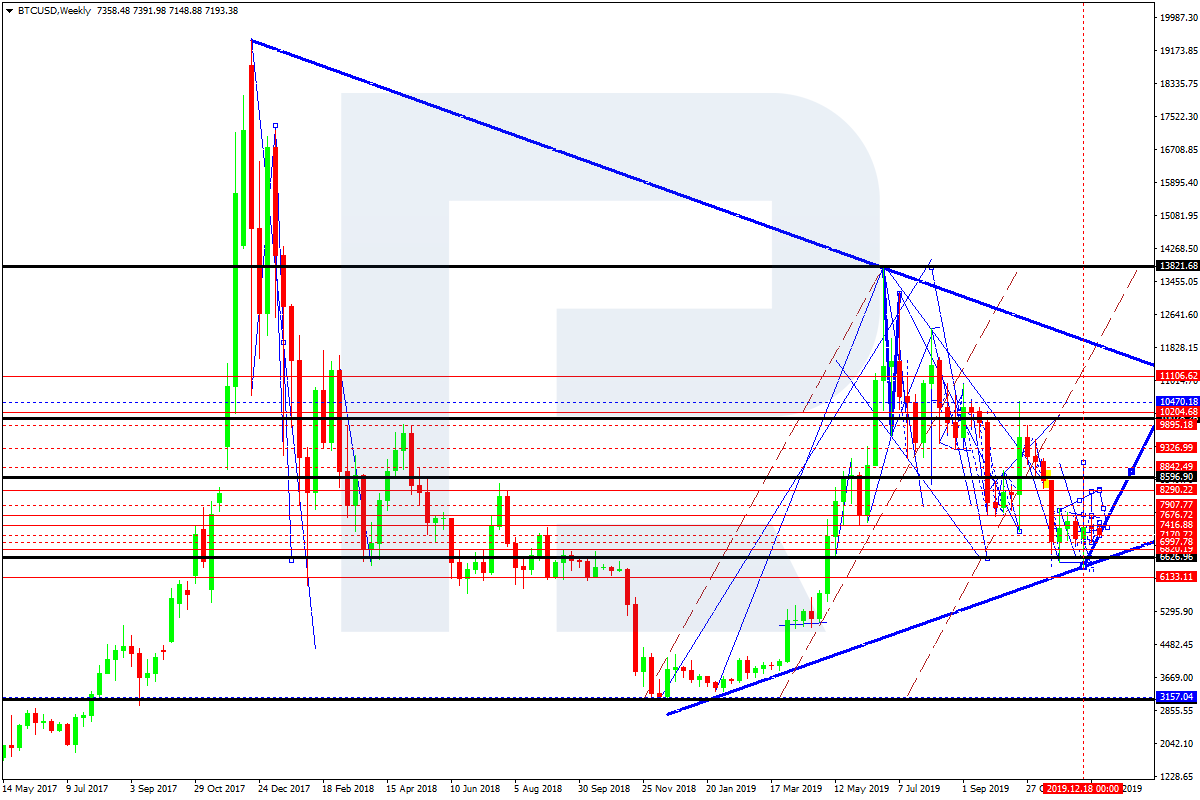
After finishing the ascending pulse at 7600.00, BTCUSD has completed the correction at 7000.00, thus forming a new consolidation range. If later the price breaks this range to the downside at 7000.00, the market may continue trading inside the downtrend towards 4200.00; if to the upside at 7600.00 – start a new growth with the target at 8600.00 and then 11100.00.

BITCOIN

Fibonacci Retracements Analysis 31.12.2019 (EURUSD, USDJPY)

Fibonacci Retracements Analysis 31.12.2019 (EURUSD, USDJPY)

31.12.2019

EURUSD, “Euro vs US Dollar”

As we can see in the daily chart, after breaking the high, EURUSD is forming a new rising impulse inside the mid-term uptrend. The closest target is 23.6% fibo at 1.1275. If the price breaks this level, the pair may continue growing towards 38.2% and 50.0% % fibo at 1.1519 and 1.1716 respectively. The support is the low at 1.0879.

EURUSD_D1
Risk Warning: the result of previous trading operations do not guarantee the same results in the future

In the H4 chart, the ascending impulse has reached 61.8% fibo. The next short-term upside target may be 76.0% fibo at 1.1284. At the same time, there is a divergence on MACD, which may indicate a new pullback towards the support at 38.2% fibo (1.1083).

EURUSD_H4
Risk Warning: the result of previous trading operations do not guarantee the same results in the future

USDJPY, “US Dollar vs. Japanese Yen”

As we can see in the H4 chart, after testing 109.73, USDJPY is trading downwards to reach the fractal low. If the price breaks it, the instrument may continue falling towards 38.2%, 50.0%, and 61.8% fibo at 107.71, 107.09, and 106.47 respectively.

USDJPY_H4
Risk Warning: the result of previous trading operations do not guarantee the same results in the future

In the H1 chart, the descending impulse is heading towards the fractal low at 108.46. The local resistance is 61.8% fibo at 108.94.

USDJPY_H1
Risk Warning: the result of previous trading operations do not guarantee the same results in the future

Japanese Candlesticks Analysis 30.12.2019 (USDCAD, AUDUSD)

30.12.2019

USDCAD, “US Dollar vs Canadian Dollar

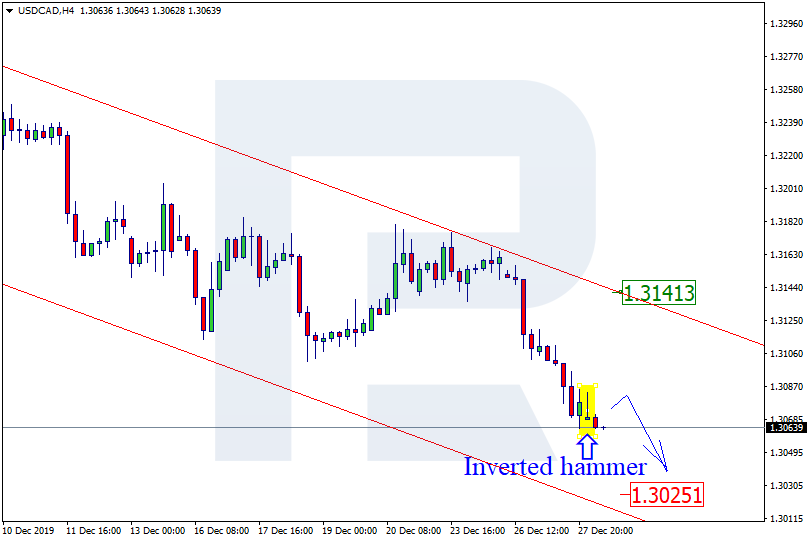
As we can see in the H4 chart, the pair continues moving close to the support level. By now, it has completed Inverted Hammer reversal pattern. The current situation implies that USDCAD may form a slight correction then resume falling towards 1.3025. However, we shouldn’t ignore an alternative scenario, according to which the instrument may return to the descending channel’s upside border at 1.3141.

USDCAD
Risk Warning: the result of previous trading operations do not guarantee the same results in the future

AUDUSD, “Australian Dollar vs US Dollar

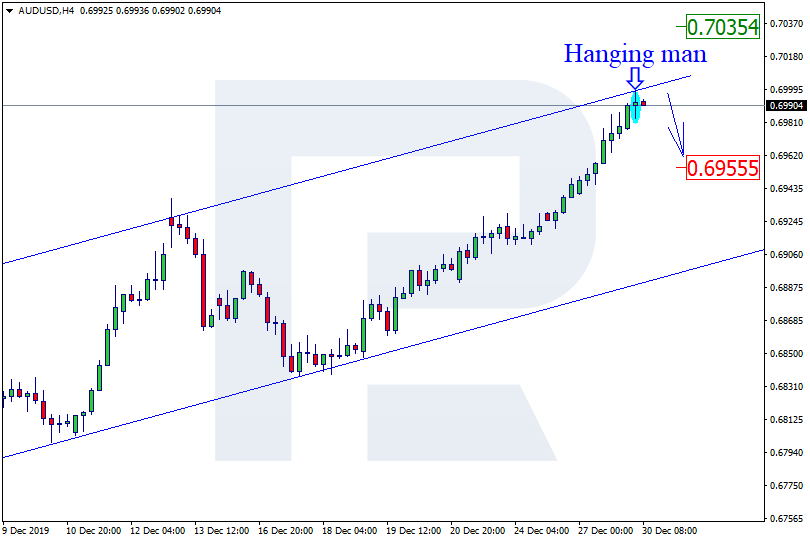
As we can see in the H4 chart, the pair continues forming the ascending tendency. After finishing Hanging Man reversal pattern close to the channel’s upside border, AUDUSD is starting to reverse. Considering the current uptrend, let’s assume that the pair start a slight correction, but then resume falling to reach its downside target at 0.6955. However, we shouldn’t ignore an alternative scenario, which implies that the instrument may update its highs and continue growing towards 0.7035.

AUDUSD
Risk Warning: the result of previous trading operations do not guarantee the same results in the future

Fibonacci Retracements Analysis 30.12.2019 (GOLD, USDCHF)

30.12.2019

XAUUSD, “Gold vs US Dollar”

As we can see in the H4 chart, after breaking 38.2% fibo, XAUUSD transformed the correctional uptrend into a proper rising wave with the target at 1557.00. By now, the pair has already reached 61.8% fibo and may later continue moving towards 76.0% fibo at 1530.10. The support is 38.2% fibo at 1488.16.

GOLD_H4
Risk Warning: the result of previous trading operations do not guarantee the same results in the future

In the H1 chart, after reaching 61.8% fibo, the pair is testing it. In this case, the price is expected to start a new pullback towards 38.2% fibo at 1488.15.

GOLD_H1
Risk Warning: the result of previous trading operations do not guarantee the same results in the future

USDCHF, “US Dollar vs Swiss Franc”

In the H4 chart, after completing the short-term correction and starting a new descending wave, USDCHF has broken 76.0% fibo; right now, it is moving towards the fractal low at 0.9660. at the same time, there is a convergence on MACD, which may indicate a new pullback after the pair reaches the low. The closest correctional target is 50.0% fibo at 0.9844.

USDCHF_H4
Risk Warning: the result of previous trading operations do not guarantee the same results in the future

As we can see in the H1 chart, the instrument has broken 76.0% fibo. The next downside target is the low at 0.9660.

USDCHF_H1
Risk Warning: the result of previous trading operations do not guarantee the same results in the future

rfxsignals December 30, 2019 No Comments

DAILY FREE FOREX SIGNALS – 30-12-2019 | Форекс – Сообщество Трейдеров |إشارات الفوركس|외환 신호

EURAUD SELL-1.60062
SL-1.60519
TP1-1.59823
TP2-1.59521

EURGBP SELL-0.85314
SL-0.85686
TP1-0.85124
TP2-0.84930

EURNZD SELL-1.66658
SL-1.67160
TP1-1.66462
TP2-1.66204

GBPCAD BUY -1.71498
SL-1.70902
TP1-1.71755
TP2-1.72007

AUDNZD SELL-1.04071
SL-1.04597
TP1-1.03895
TP2-1.03676

GBPNZD SELL-1.95086
SL-1.95963
TP1-1.94795
TP2-1.94447

NZDCAD BUY -0.87841
SL-0.87331
TP1-0.88059
TP2-0.88261

Ichimoku Cloud Analysis 27.12.2019 (AUDUSD, NZDUSD, USDCAD)

Ichimoku Cloud Analysis 27.12.2019 (AUDUSD, NZDUSD, USDCAD)

27.12.2019

AUDUSD, “Australian Dollar vs US Dollar”

AUDUSD is trading at 0.6948; the instrument is moving above Ichimoku Cloud, thus indicating an ascending tendency. The markets could indicate that the price may test Tenkan-Sen and Kijun-Sen at 0.6940 and then resume moving upwards to reach 0.7005. Another signal to confirm further ascending movement is the price’s rebounding from the rising channel’s downside border. However, the scenario that implies further growth may be canceled if the price breaks the cloud’s downside border and fixes below 0.6900. In this case, the pair may continue falling towards 0.6805.

AUDUSD
Risk Warning: the result of previous trading operations do not guarantee the same results in the future

NZDUSD, “New Zealand Dollar vs US Dollar”

NZDUSD is trading at 0.6671; the instrument is moving above Ichimoku Cloud, thus indicating an ascending tendency. The markets could indicate that the price may test the cloud’s upside border at 0.6655 and then resume moving upwards to reach 0.6730. Another signal to confirm further ascending movement is the price’s rebounding from the rising channel’s downside border. However, the scenario that implies further growth may be canceled if the price breaks the cloud’s downside border and fixes below 0.6600. In this case, the pair may continue falling towards 0.6510.

NZDUSD
Risk Warning: the result of previous trading operations do not guarantee the same results in the future

USDCAD, “US Dollar vs Canadian Dollar”

USDCAD is trading at 1.3102; the instrument is moving below Ichimoku Cloud, thus indicating a descending tendency. The markets could indicate that the price may test the cloud’s downside border at 1.3125 and then resume moving downwards to reach 1.3015. Another signal to confirm further descending movement is the price’s rebounding from the descending channel’s upside border. However, the scenario that implies further decline may be canceled if the price breaks the cloud’s upside border and fixes above 1.3190. In this case, the pair may continue growing towards 1.3285.

USDCAD
Risk Warning: the result of previous trading operations do not guarantee the same results in the future