Fibonacci Retracements Analysis 08.05.2020 (BITCOIN, ETHEREUM)
BTCUSD, “Bitcoin vs US Dollar”
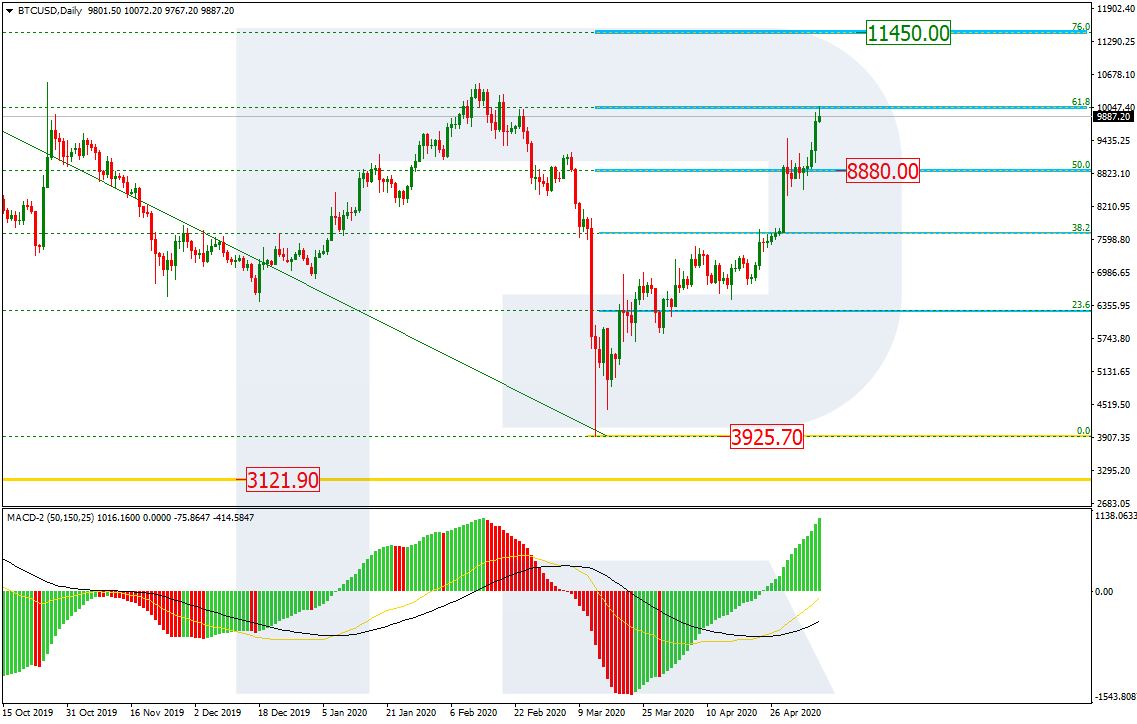
As we can see in the daily chart, the asset is correcting to the upside after completing the previous downtrend. By now, it has reached 61.8% fibo and may yet continue this rising tendency towards 76.0% fibo at 11450.00. However, the tendency may continue only after a slight pullback with the first target at 50.0% fibo at 8880.00.

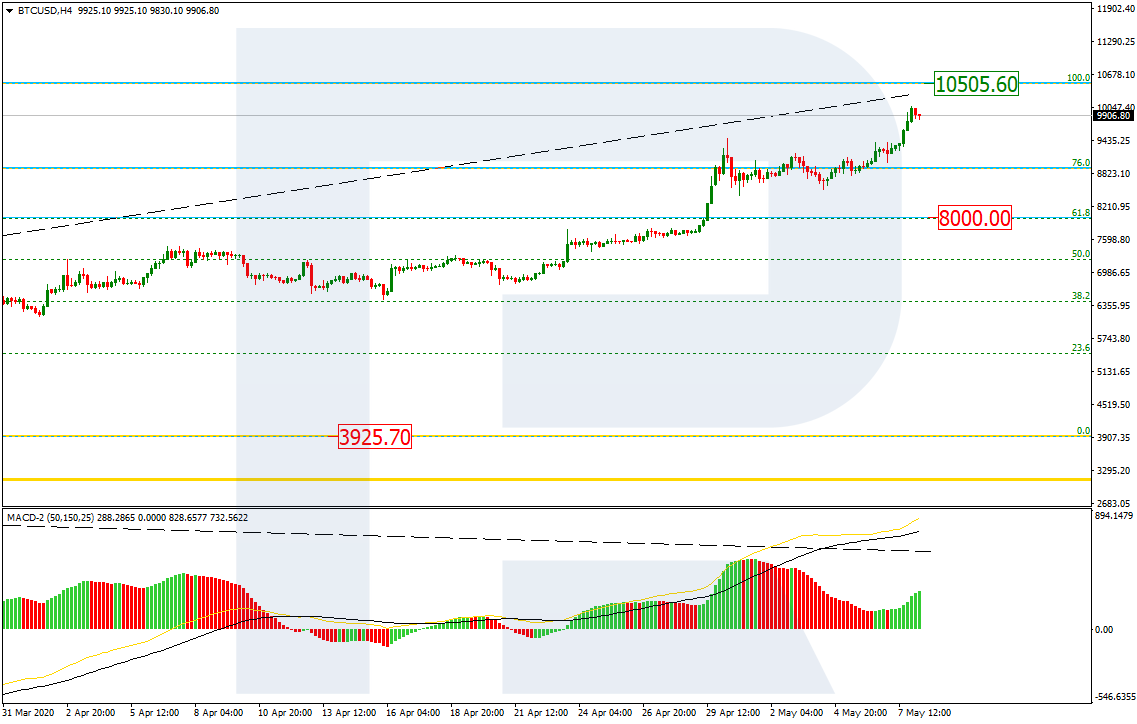
In the H4 chart, the uptrend has already broken mid-term 76.0% fibo and may continue moving to break the fractal high at 10505.60. At the same time, the MACD indicator is forming a divergence, which hints at a possible pullback. The support is те far from 61.8% fibo at 8000.00.
ETHUSD, “Ethereum vs. US Dollar”
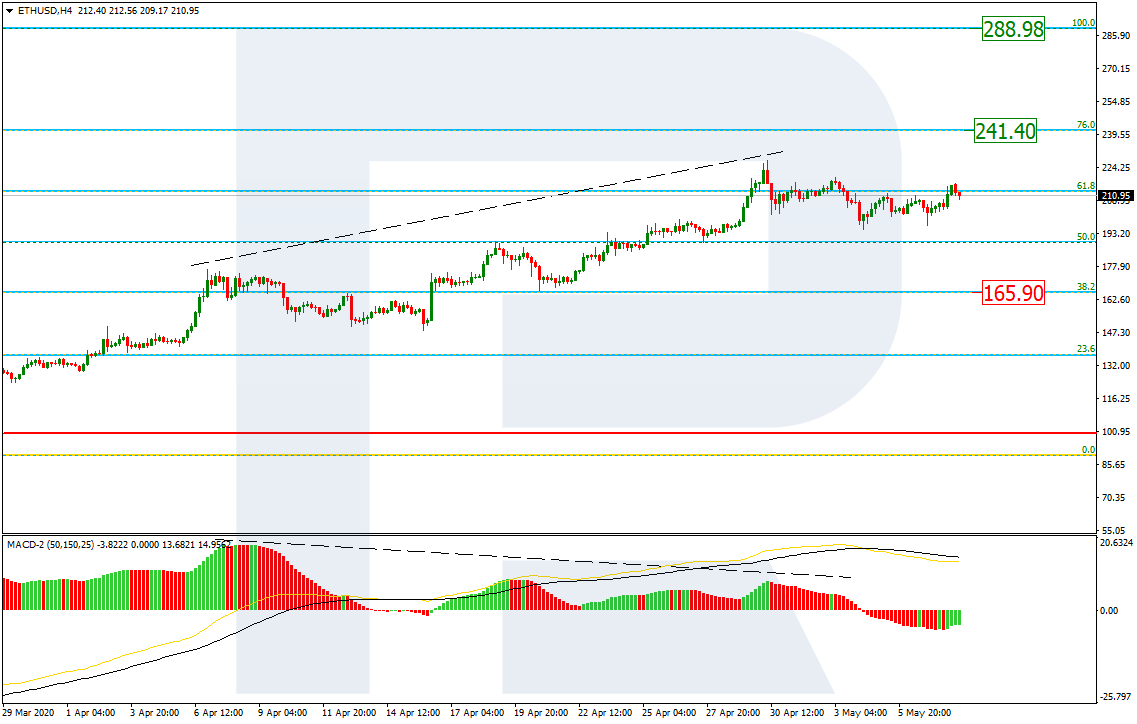
As we can see in the H4 chart, the divergence on MACD made the pair stop growing at 61.8% fibo and start a new correction to the downside. The downside correctional target is 38.2% fibo at 165.90. After completing the correction, ETHUSD may form one more ascending structure towards 76.0% fibo at 241.40 and then the high at 288.98.
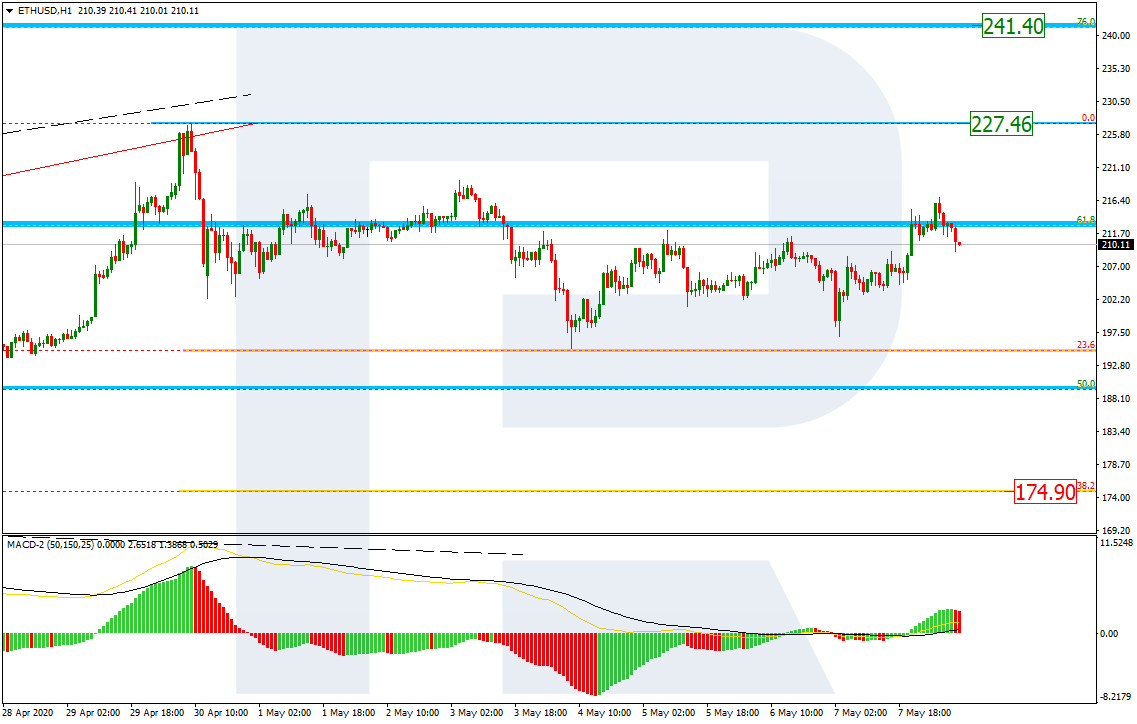
The H1 chart shows more detailed structure of the current correction. After reaching 23.6% fibo, the price has formed an internal pullback. Later, after the pullback, the pair may start a new descending wave towards 38.2% fibo at 174.90. However, if the instrument breaks the resistance at 227.46, it may resume the mid-term uptrend.