Fibonacci Retracements Analysis 10.03.2020 (EURUSD, USDJPY)
EURUSD, “Euro vs US Dollar”
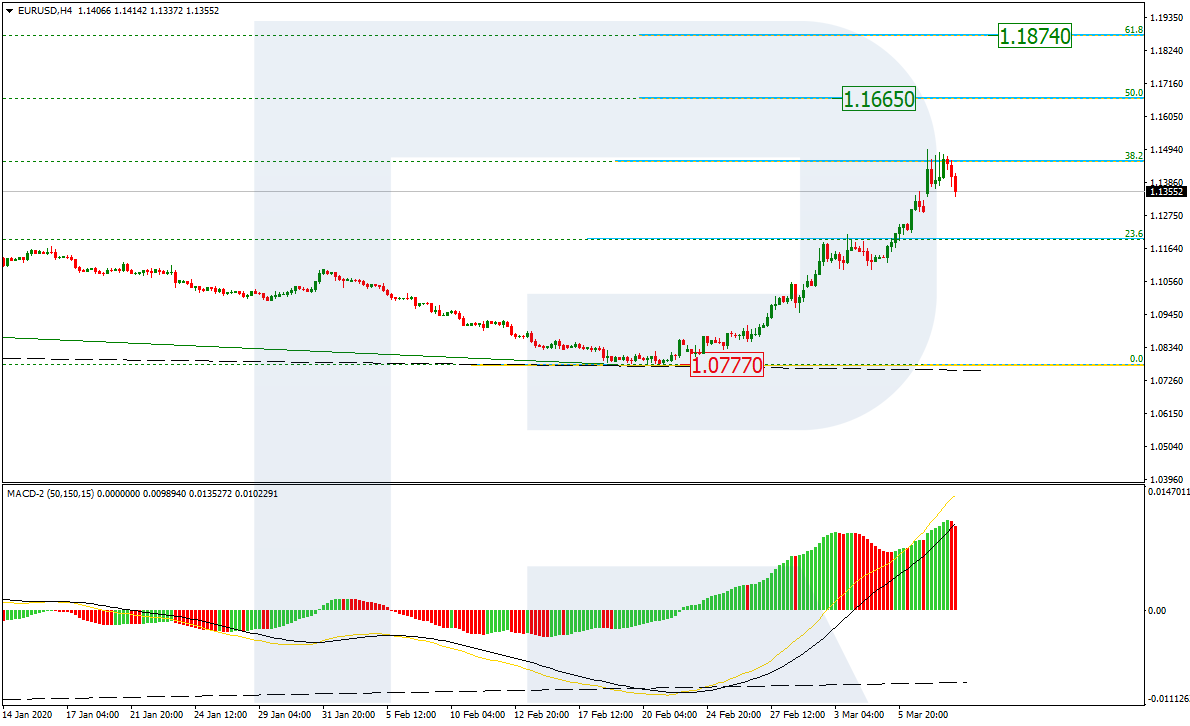
As we can see in the H4 chart, the convergence on MACD made EURUSD start a quick and steady growth. By now, the pair has reached 38.2% fibo and may later start a new pullback. The next upside targets may be 50.0% and 61.8% fibo at 1.1665 and 1.1874 respectively. The key support is the low at 1.0777.

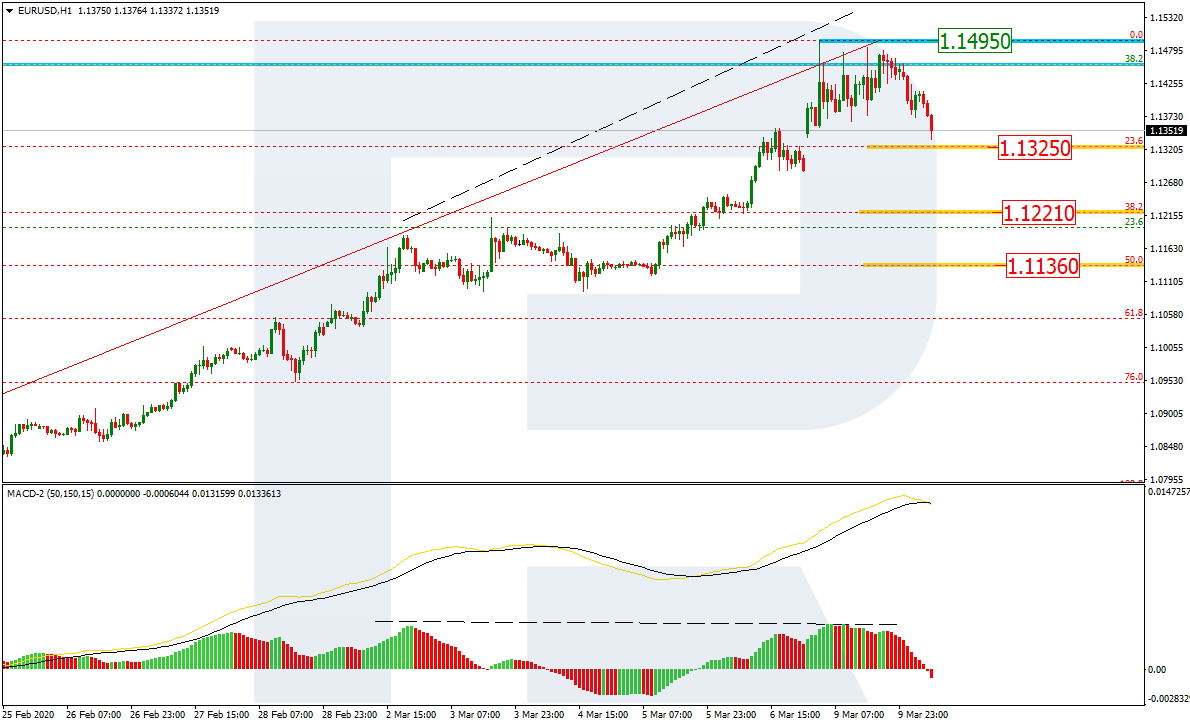
In the H4 chart, the pair is approaching 23.6% fibo at 1.1325. The next downside target may be 38.2% and 50.0% fibo at 1.1221 and 1.1136 respectively. The resistance is the high at 1.1495.
USDJPY, “US Dollar vs. Japanese Yen”
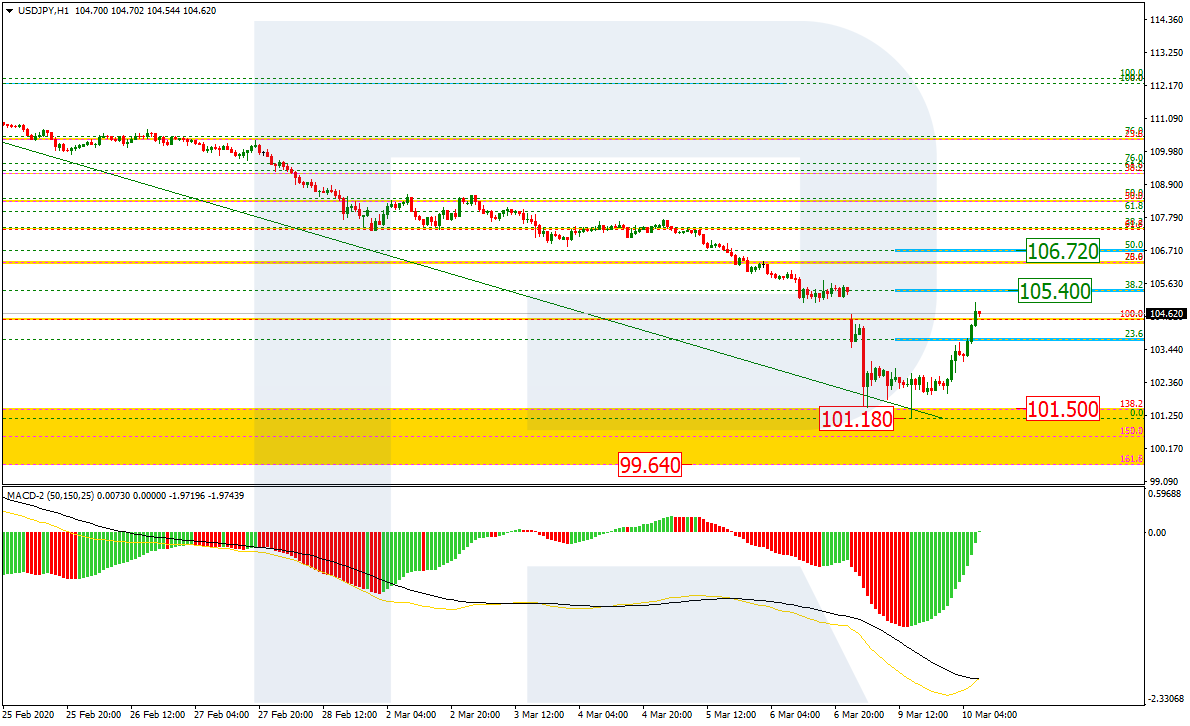
As we can see in the daily chart, after breaking a significant low at 104.45 and testing the post-correctional extension area between 138.2% and 161.8% between 101.50 and 99.64 respectively, USDJPY has returned to the low again.

In the H1 chart, the pair is correcting after a descending impulse. The price is heading towards 38.1% fibo at 105.40 and may continue moving towards 50.0% fibo at 106.72. if the price breaks the support at 101.18, the mid-term downtrend will continue.