Fibonacci Retracements Analysis 16.04.2020 (AUDUSD, USDCAD)
AUDUSD, “Australian Dollar vs US Dollar”
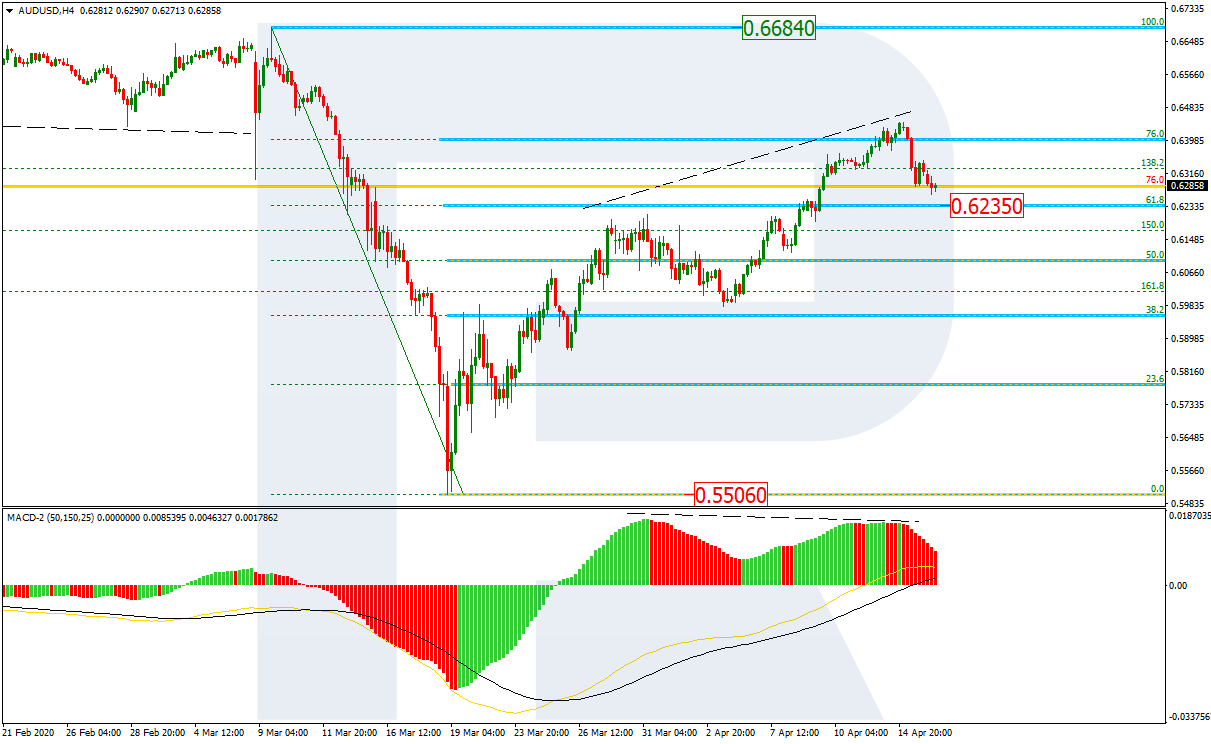
As we can see in the H4 chart, the divergence on MACD made the pair complete the correctional uptrend at 76.0% fibo and start a new pullback to the downside. The key upside target may be the fractal high at 0.6684. However, the pair may test this level only after finishing the current pullback. The support is at 0.6235.

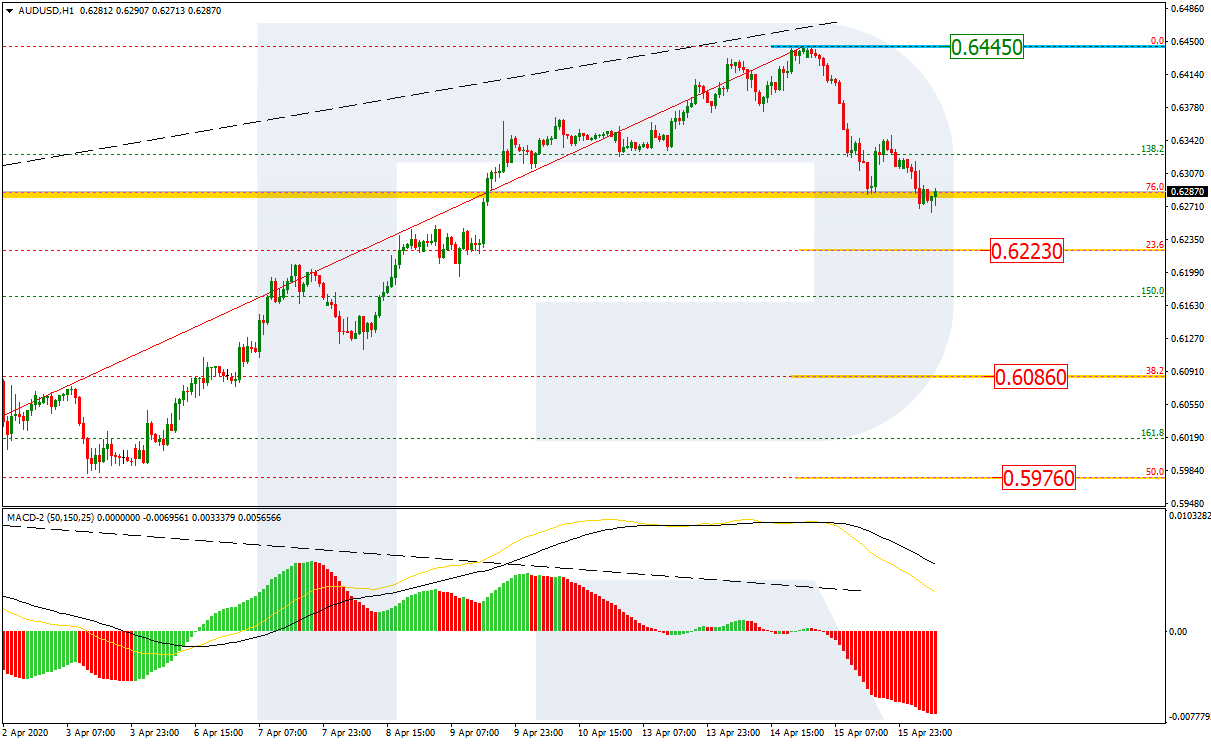
In the H1 chart, AUDUSD is falling towards 23.6% fibo at 0.6223 after the divergence. The next downside targets may be 38.2% and 50.0% fibo at 0.6086 and 0.5976 respectively. The local resistance is at 0.6445.
USDCAD, “US Dollar vs Canadian Dollar”
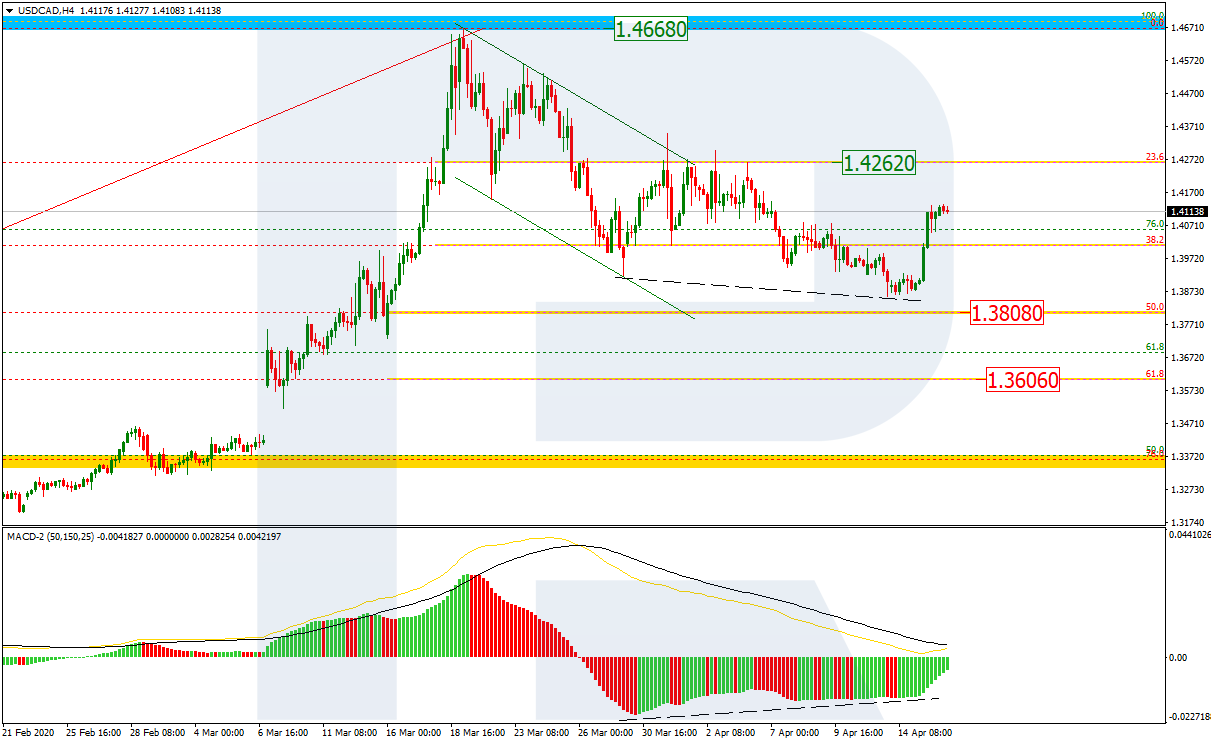
In the H4 chart, after updating the previous low, the correctional downtrend has failed to reach 38.2% fibo. Under such circumstances, a growth towards 23.6% fibo at 1.4262 may be a rather deceitful maneuver. However, if the price breaks this level, the instrument may continue trading upwards to reach the high at 1.4668.
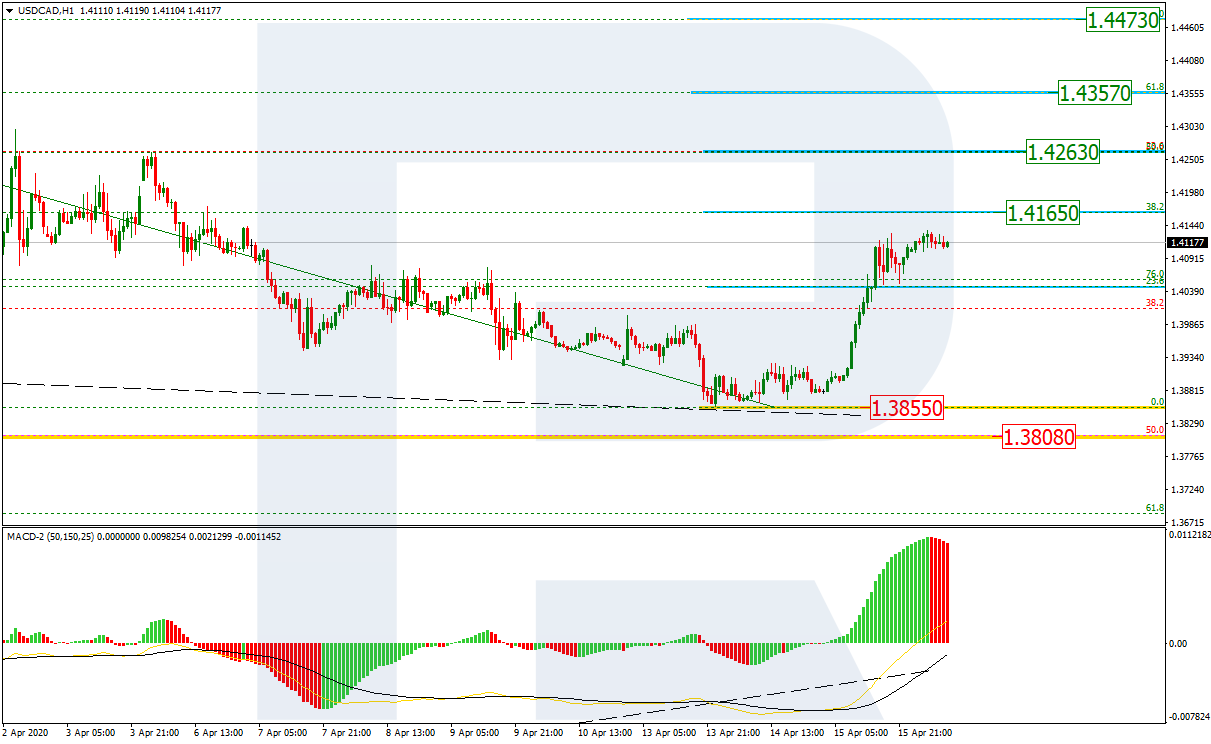
As we can see in the H1 chart, the correctional uptrend is approaching 38.2% fibo at 1.4165. in the case of a stable growth, the instrument may reach 50.0%, 61.8%, and 76.0% fibo at 1.4263, 1.4357 and 1.4473 respectively. The support is the low at 1.3855.