Fibonacci Retracements Analysis 18.03.2020 (GBPUSD, EURJPY)
GBPUSD, “Great Britain Pound vs US Dollar”
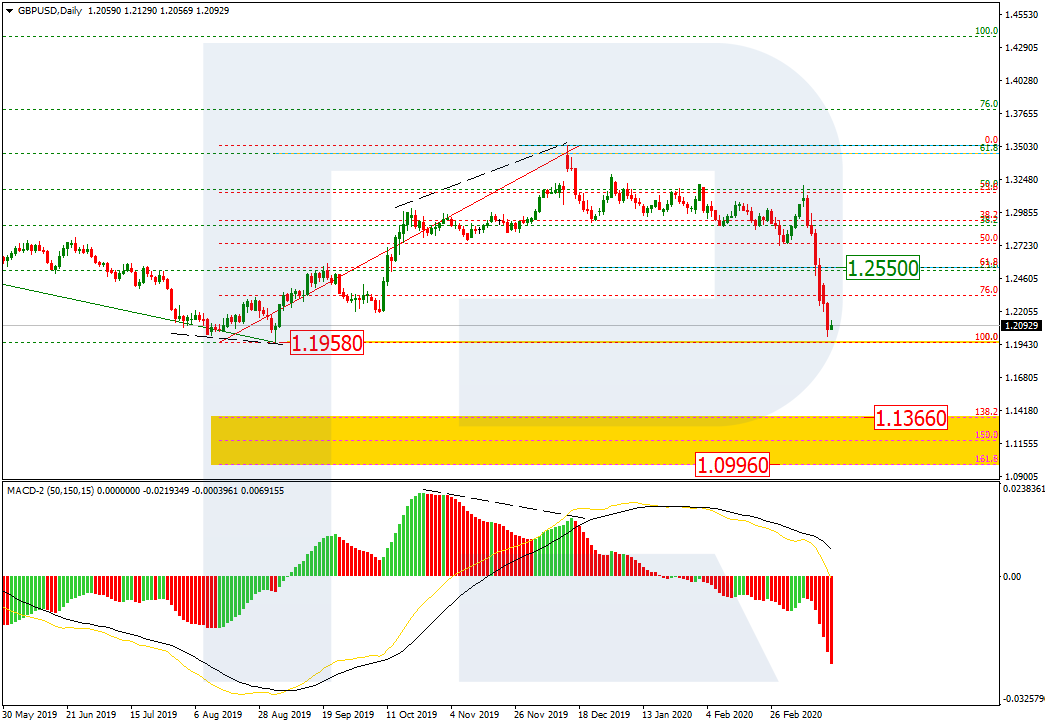
As we can see in the daily chart, a quick descending wave in GBPUSD, which started when the Bank of England decided to cut the benchmark rate, is heading to break the key low at 1.1958. If it happens, the pair may continue falling towards the post-correctional extension area between 138.2% and 161.8% fibo at 1.1366 and 1.0996 respectively. the resistance is 61.8% fibo at 1.2552.

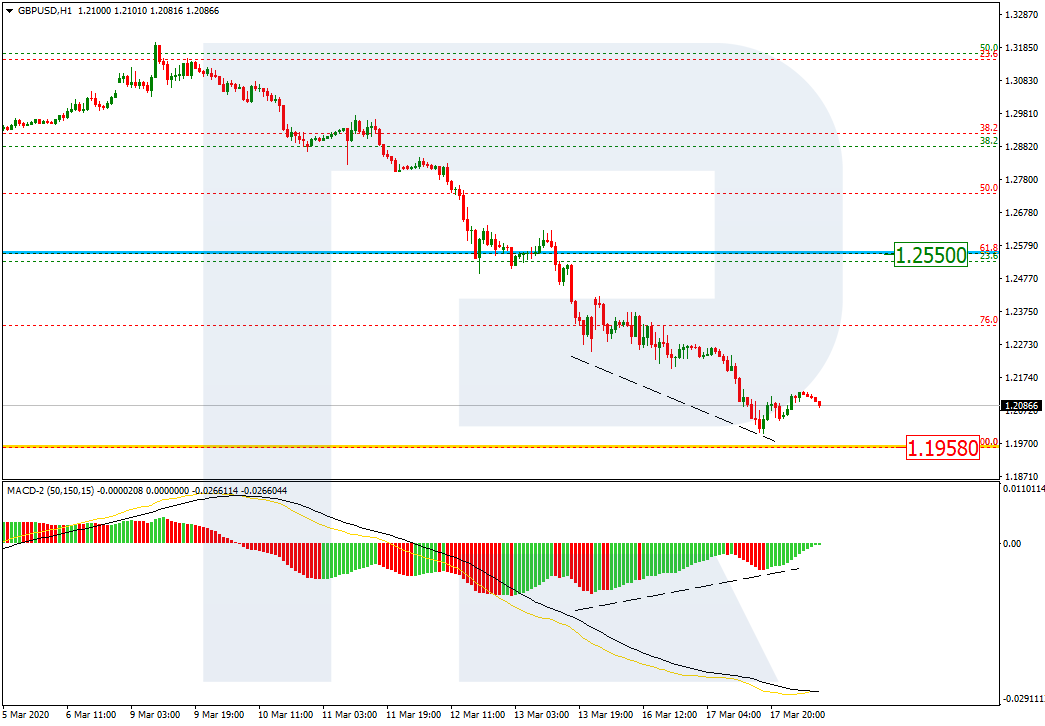
In the H1 chart, the pair is getting closer towards the low at 1.1958. At the same time, there is a convergence on MACD, which may indicate a possible pullback towards the resistance in the nearest future.
EURJPY, “Euro vs. Japanese Yen”
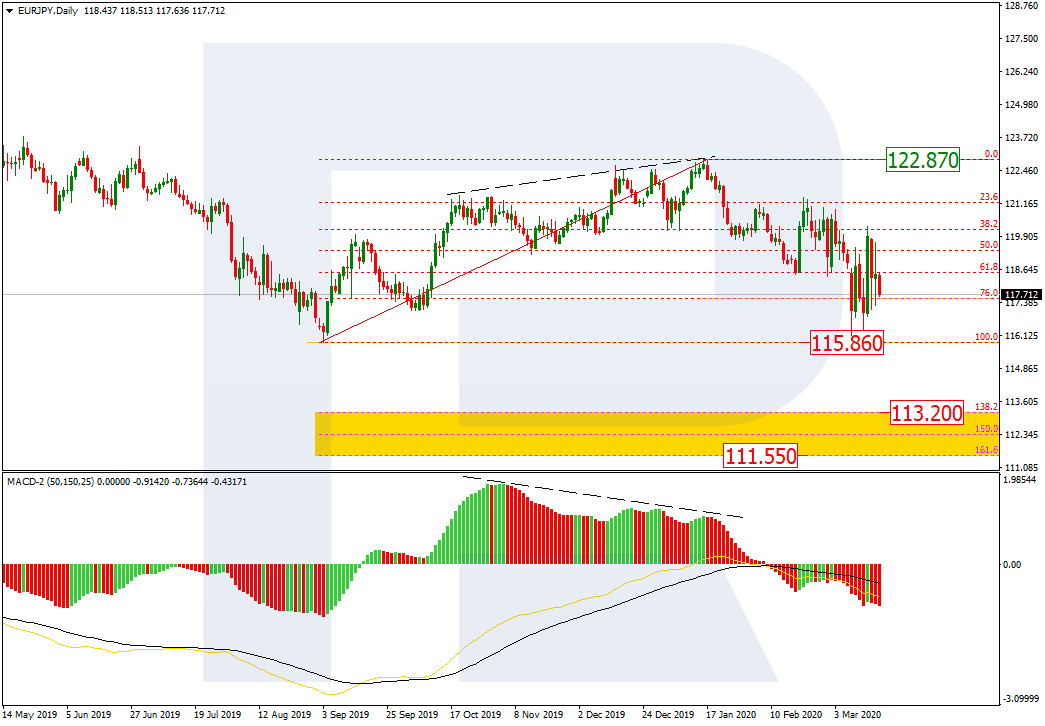
As we can see in the daily chart, the descending wave attempted to reach and test the long-term low at 115.86. However, after reaching the low, the pair rebounded from it, thus indicating a long correction. If the price breaks the low, the instrument may continue falling towards the post-correctional extension area between 138.2% and 161.8% fibo at 113.20 and 111.55 respectively.
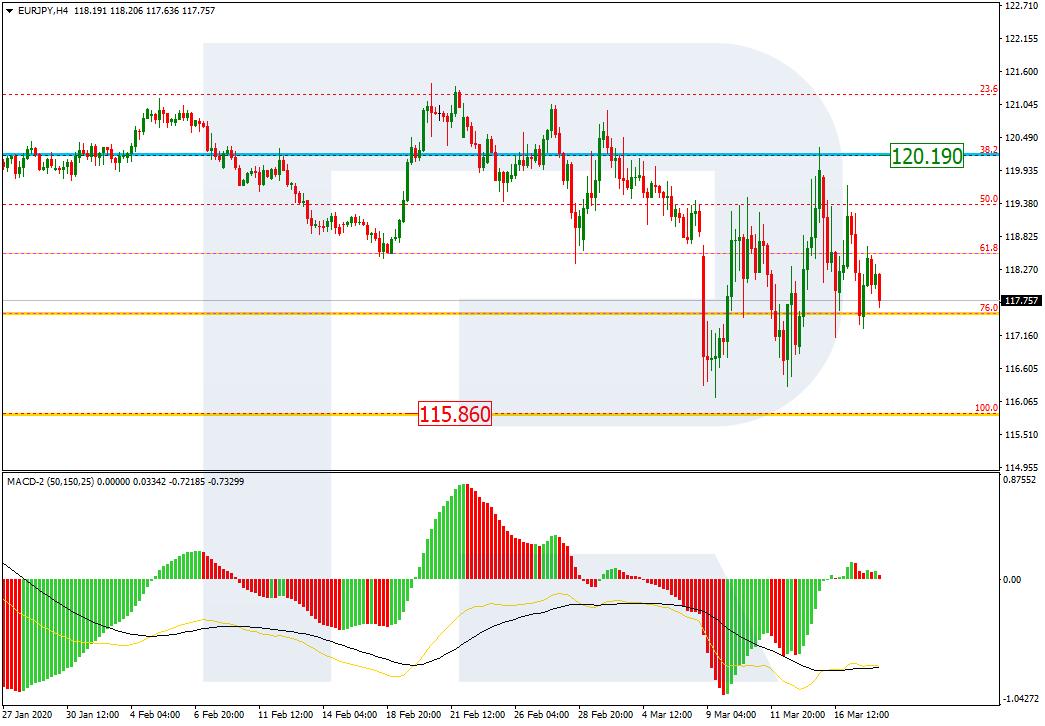
In the H4 chart, the correction is taking the form of a volatile Zigzag. At the moment, EURJPY is moving between the long-term low and 38.2% fibo at 115.86 and 120.19 respectively.