Fibonacci Retracements Analysis 23.12.2020 (GBPUSD, EURJPY)
GBPUSD, “Great Britain Pound vs US Dollar”
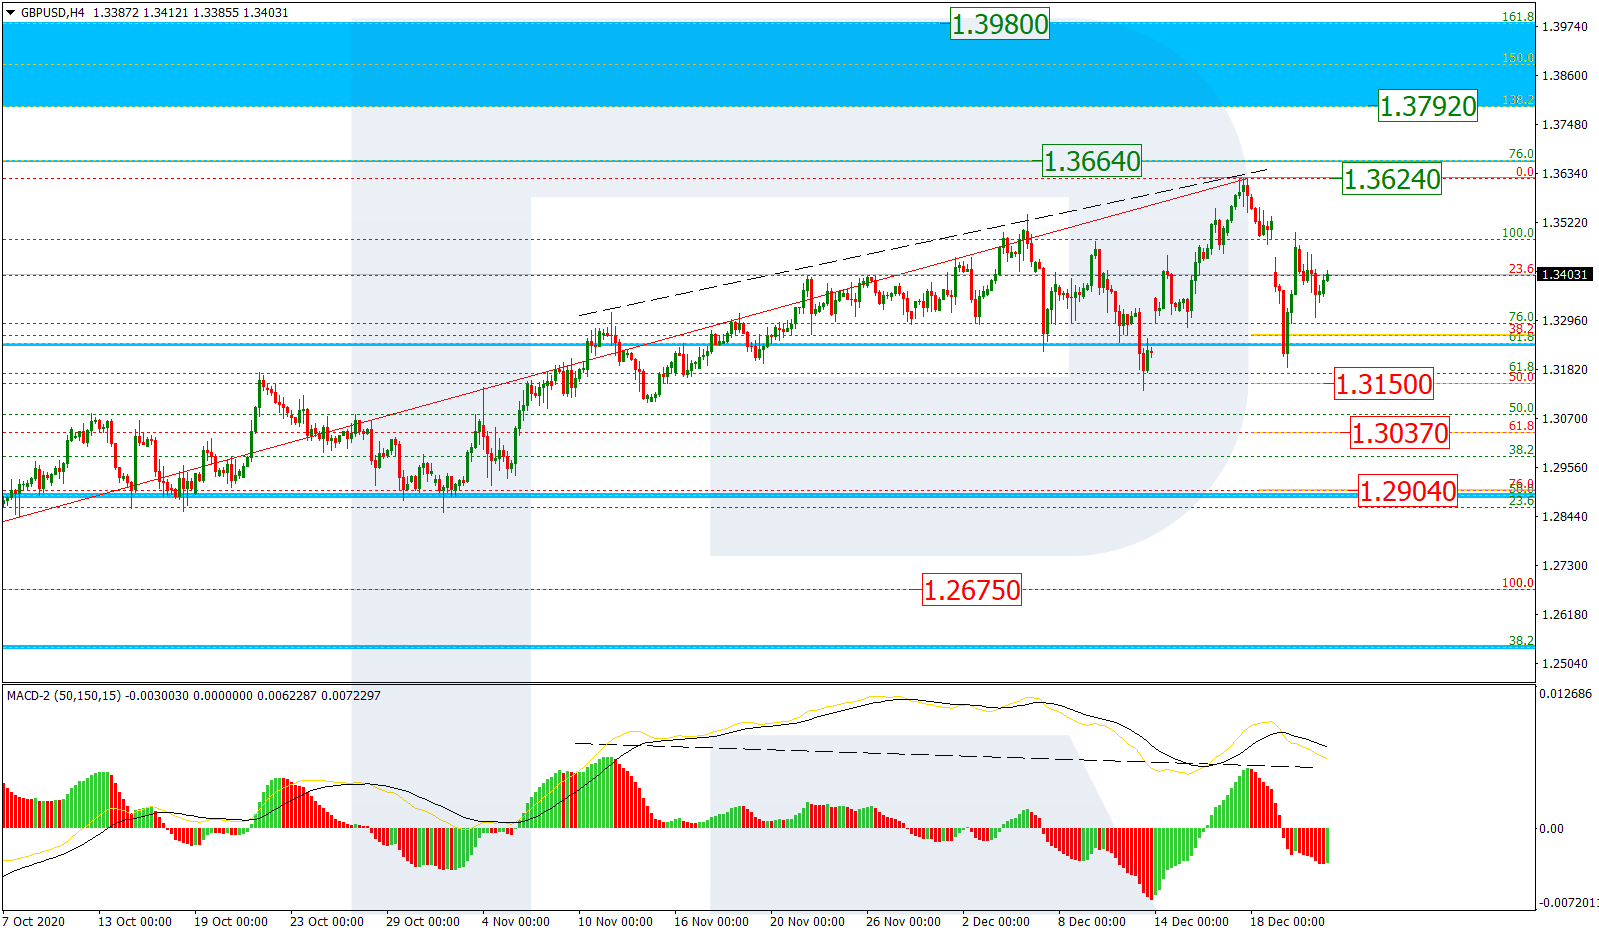
As we can see in the H4 chart, a divergence on MACD made the pair stop its ascending movement and start a new correction downwards to reach 38.2% fibo, which was later followed by another rising impulse to eliminate the gap. Possibly, this impulse may reach or even break the high at 1.3624 and then continue moving towards the post-correctional extension area between 138.2% and 161.8% fibo at 1.3792 and 1.3980 respectively. However, as long as the asset is trading below the high, the main scenario implies further decline to reach 50.0%, 61.8%, and 76.0% fibo at 1.3150, 1.3037, and 1.2904 respectively.

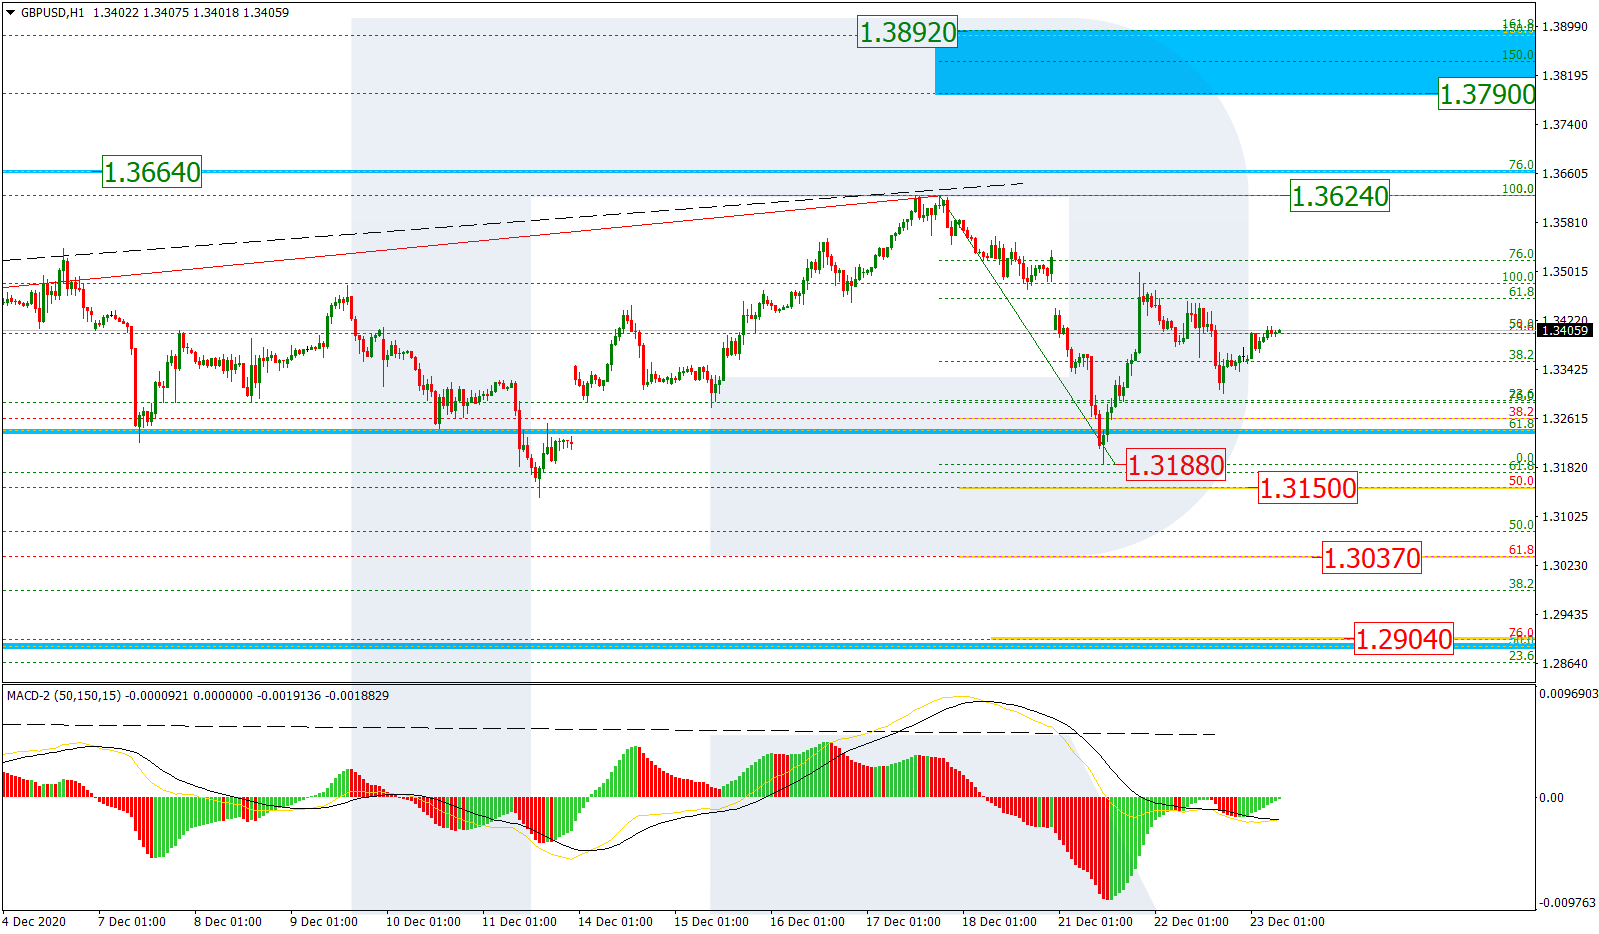
In the H1 chart, after completing the descending wave, the par has corrected upwards and reached 61.8% fibo. Later, the asset may grow to break the high at 1.3624 and then continue towards the local post-correctional extension area between 138.2% and 161.8% fibo at 1.3790 and 1.3892 respectively. On the other hand, a breakout of the local support at 1.3188 will lead to further decline.
EURJPY, “Euro vs. Japanese Yen”
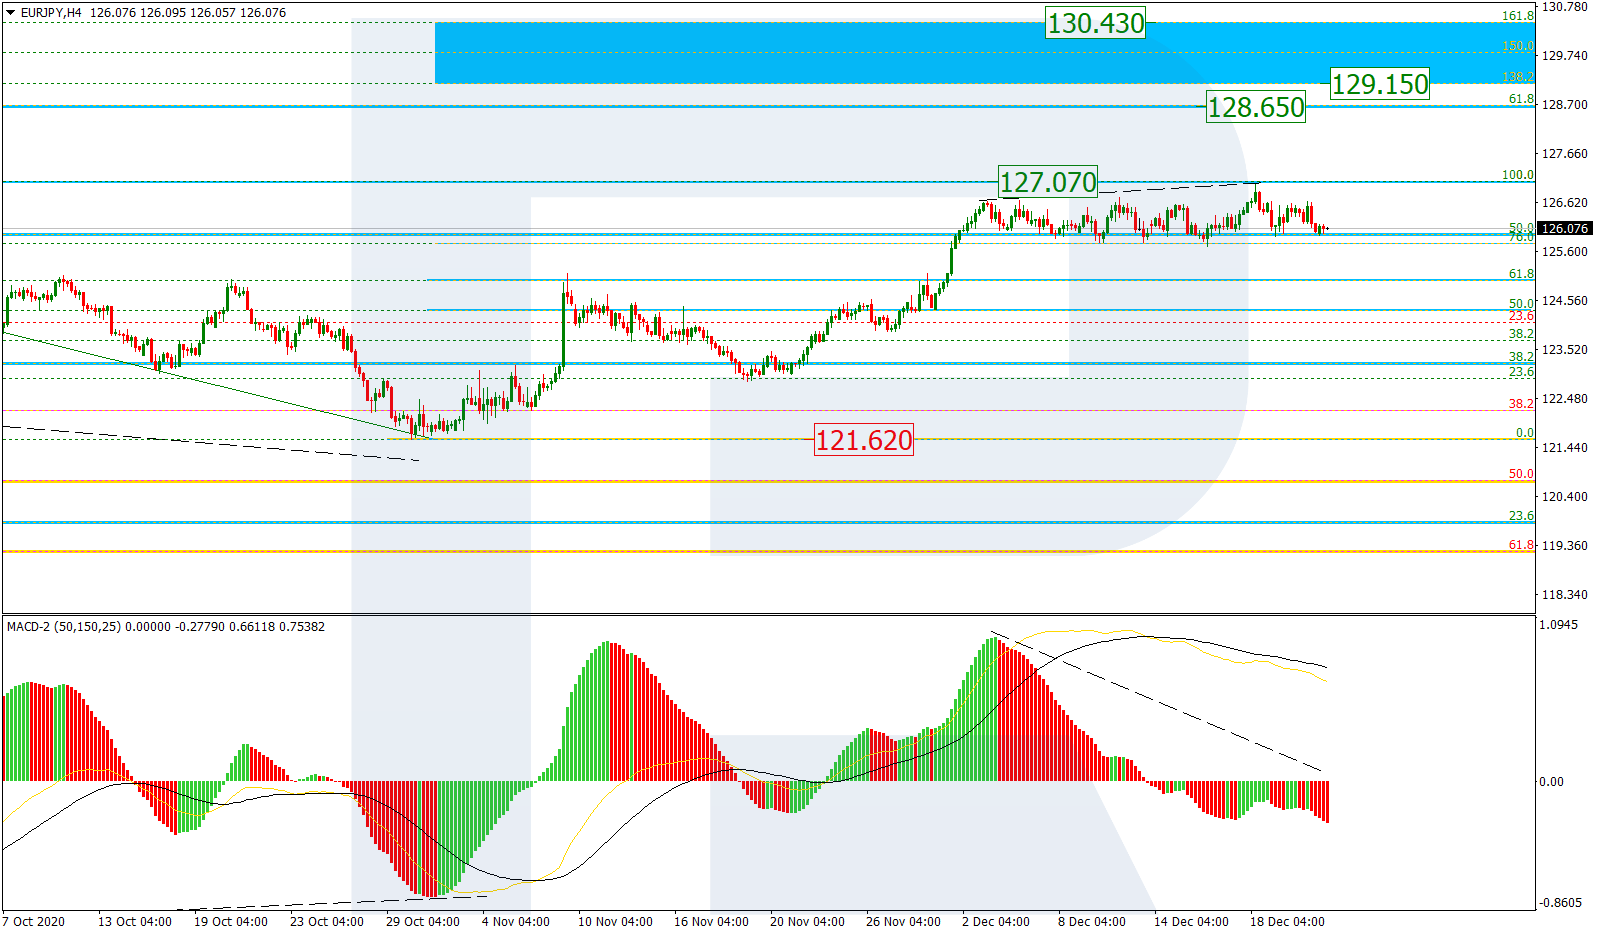
In the H4 chart, EURJPY is rebounding from the high at 127.07 after testing it. Such a rebound may lead to both a short-term decline and a proper descending wave towards the low at 121.61 or even lower. On the other hand, if the pair breaks the high at 127.07, the asset may continue growing towards the mid-term 61.8% fibo at 128.65 and then the post-correctional extension area between 138.2% and 161.8% fibo at 129.15 and 130.40 respectively.
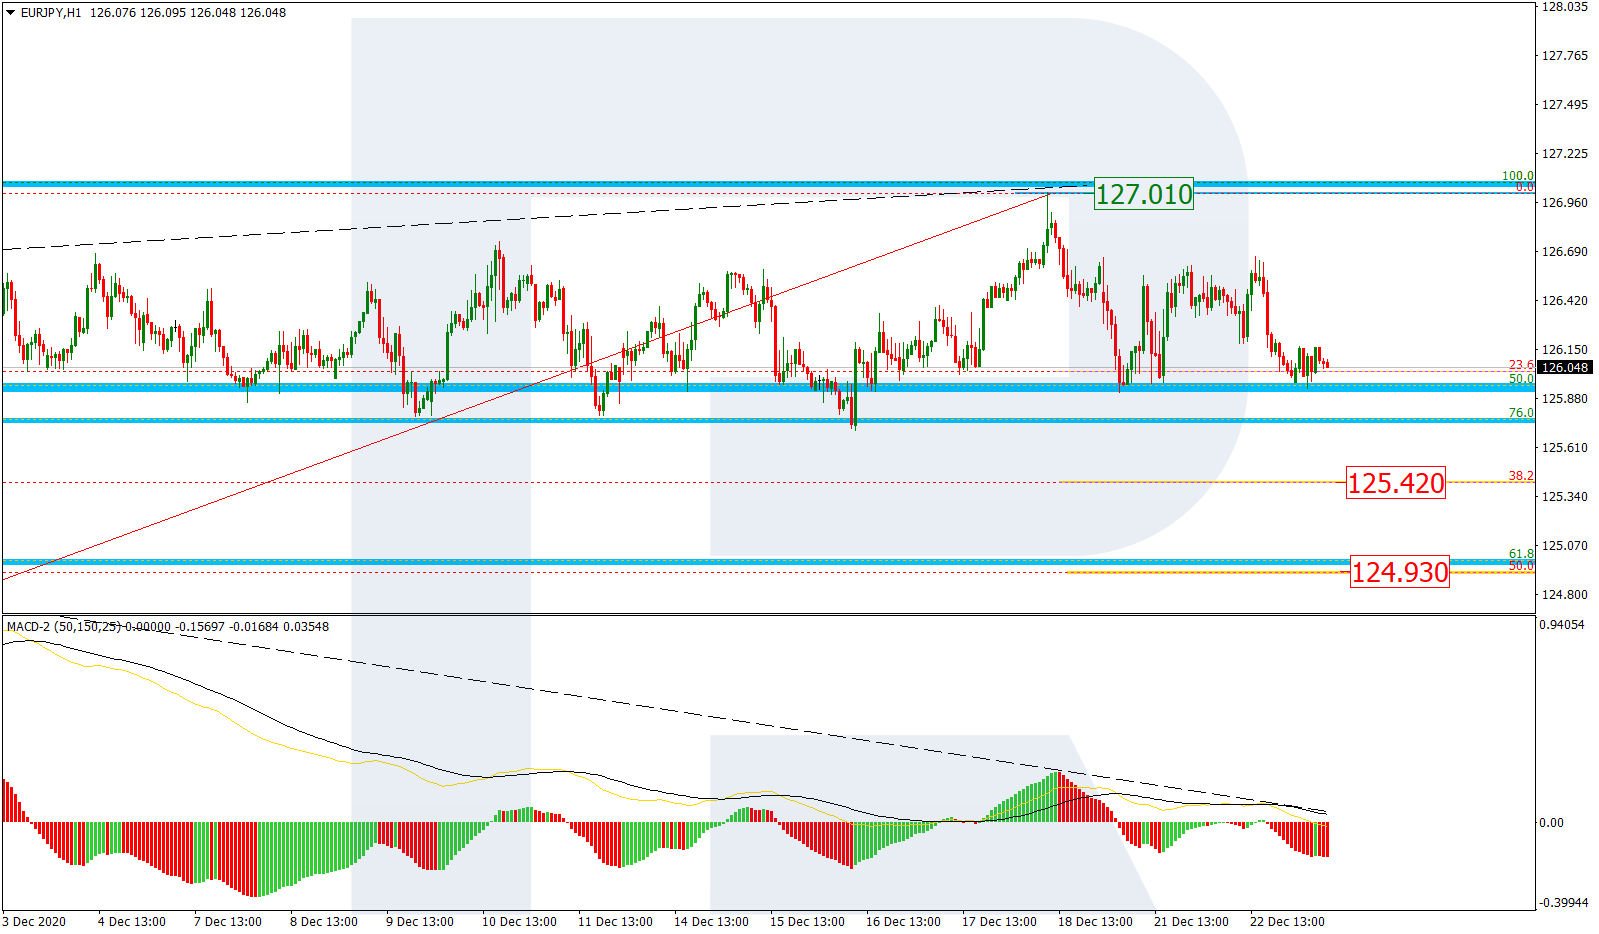
As we can see in the H1 chart, after a divergence on MACD, the asset has tested 23.6% fibo twice. Possibly, the pair may break this level and continue falling towards 38.2% and 50.0% fibo at 125.42 and 124.93 respectively. A breakout of the local high at 127.01 will hint at further uptrend.