Ichimoku Cloud Analysis 19.12.2019 (AUDUSD, NZDUSD, USDCAD)

Ichimoku Cloud Analysis 19.12.2019 (AUDUSD, NZDUSD, USDCAD)

19.12.2019

AUDUSD, “Australian Dollar vs US Dollar”

AUDUSD is trading at 0.6877; the instrument is moving above Ichimoku Cloud, thus indicating an ascending tendency. The markets could indicate that the price may test the cloud’s downside border at 0.6855 and then resume moving upwards to reach 0.6975. Another signal to confirm further ascending movement is the price’s rebounding from the support level. However, the scenario that implies further growth may be canceled if the price breaks the cloud’s downside border and fixes below 0.6835. In this case, the pair may continue falling towards 0.6725.
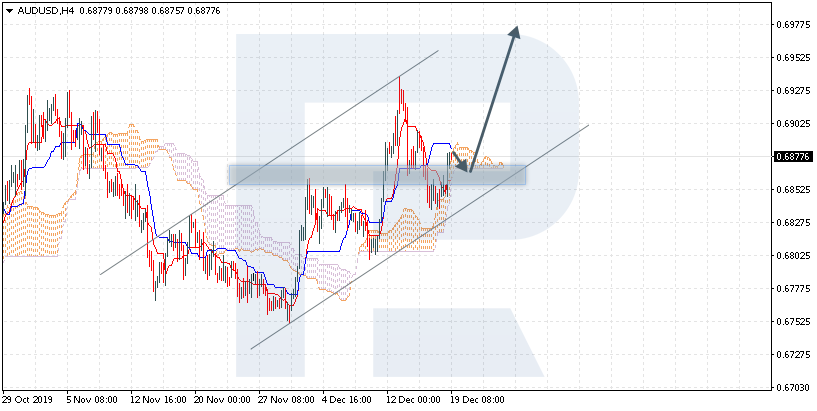
AUDUSD
Risk Warning: the result of previous trading operations do not guarantee the same results in the future

NZDUSD, “New Zealand Dollar vs US Dollar”

NZDUSD is trading at 0.6590; the instrument is moving above Ichimoku Cloud, thus indicating an ascending tendency. The markets could indicate that the price may test the cloud’s downside border at 0.6575 and then resume moving upwards to reach 0.6710. Another signal to confirm further ascending movement is the price’s rebounding from the rising channel’s downside border. However, the scenario that implies further growth may be canceled if the price breaks the cloud’s downside border and fixes below 0.6525. In this case, the pair may continue falling towards 0.6415.
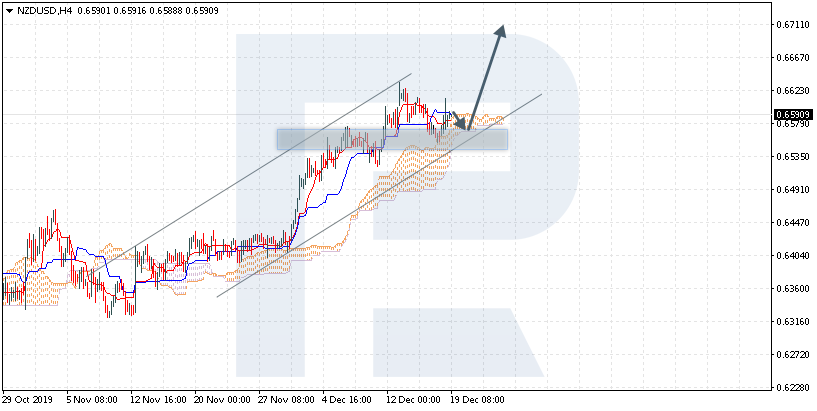
NZDUSD
Risk Warning: the result of previous trading operations do not guarantee the same results in the future

USDCAD, “US Dollar vs Canadian Dollar”

USDCAD is trading at 1.3116; the instrument is moving below Ichimoku Cloud, thus indicating a descending tendency. The markets could indicate that the price may test the cloud’s downside border at 1.3145 and then resume moving downwards to reach 1.3005. Another signal to confirm further descending movement is the price’s rebounding from the descending channel’s upside border. However, the scenario that implies further decline may be canceled if the price breaks the cloud’s upside border and fixes above 1.3245. In this case, the pair may continue growing towards 1.3305.

USDCAD
Risk Warning: the result of previous trading operations do not guarantee the same results in the future

Murrey Math Lines 18.12.2019 (USDJPY, USDCAD)

Murrey Math Lines 18.12.2019 (USDJPY, USDCAD)

18.12.2019

USDJPY, “US Dollar vs. Japanese Yen”

As we can see in the H4 chart, USDJPY is moving inside the “overbought area”. In this case, the price is expected to break 8/8 and then continue falling to reach the support at 6/8. However, this scenario may no longer be valid if the price breaks +1/8 to the upside. After that, the instrument may start a new growth towards the resistance at +2/8.

USDJPY_H4
Risk Warning: the result of previous trading operations do not guarantee the same results in the future

In the M15 chart, the pair may break the downside line of the VoltyChannel indicator and, as a result, continue trading downwards.

USDJPY_M15
Risk Warning: the result of previous trading operations do not guarantee the same results in the future

USDCAD, “US Dollar vs Canadian Dollar”

As we can see in the H4 chart, USDCAD is consolidating. In this case, the pair may break 4/8 and resume growing to reach the resistance at 5/8. However, this scenario may no longer be valid if the price breaks 3/8. After that, the instrument may continue falling towards the support at 2/8.

USDCAD_H4
Risk Warning: the result of previous trading operations do not guarantee the same results in the future

In the M15 chart, the pair may break the upside line of the VoltyChannel indicator and, as a result, continue moving upwards.

USDCAD_M15

Japanese Candlesticks Analysis 11.12.2019 (EURUSD, USDJPY)

Japanese Candlesticks Analysis 11.12.2019 (EURUSD, USDJPY)

11.12.2019

EURUSD, “Euro vs. US Dollar”

As we can see in the H4 chart, after completing a quick ascending structure and expanding the descending channel’s borders, EURUSD is still trading close to the resistance level; by now, the pair has reversed after forming Hanging Man pattern. We may assume that later the price may test the resistance level and get back to 1.1055 to resume the descending tendency. However, one shouldn’t exclude a possibility that the price may continue growing towards 1.1133.

EURUSD
Risk Warning: the result of previous trading operations do not guarantee the same results in the future

USDJPY, “US Dollar vs. Japanese Yen”

As we can see in the H4 chart, the pair continues trading close to the rising channel’s downside border. By now, USDJPY has formed another Hammer reversal pattern. Later, after finishing one more correction, the pair may reverse and resume growing towards 109.60 to continue forming the ascending tendency. At the same time, the pair may choose another scenario and start a new decline to reach 108.54.

USDJPY

How Much Money to Trade?

Knowing how much money you need to trade allows you to get on with the business of trading itself without worrying about your trader pay cheque

How much money do you need to trade? How much can your trading system’s tap provide? It can be ‘cranked up’ to provide a greater flow, but there will always be a limit. Know your system’s limits to know the answer…

One of the first questions a beginning trader asks is “How much money do I need to survive as a trader?”

It’s often asked by someone with a very small account size who is nervous about taking the first step into trading.

If they are thinking of leaving their job to trade, the very fact that they are asking the question should raise alarm bells.

(For a short but extremely relevant discussion of this dilemma see the first of our forex myths, click the following link to go to Forex Myths)

Even though it’s asked by newbie traders, it’s a valid and important question. You should have the answer to this question before you ever contemplate relying solely on trading for an income.

There is a basic equation that gives the answer to the question. The simple maths goes like this:

Frequency * Magnitude equals = Expected Value

Where:

  • Frequency refers to the number of trades your system provides on average over a certain period. For example, if you wanted to know how much your system makes in an average year, the Frequency would be the number of times your system trades in an average year.
  • Magnitude refers to the size of the outcome – the win or the loss – of your average trade. This can be expressed in a number of ways: as pips, as percentage, as units or as a currency value, e.g. in dollar terms. For our purposes here, since we are trying to discern if your system will provide you with a living (you can’t eat pips, percentages or units :-)), we will use the dollar value.

Let’s assume the following inputs to the calculation:

  • your system trades on average one hundred and fifty times per year
  • your system makes 1% or one unit (see Forex Pip for a discussion on the use of pips, percentages and units) each time it trades
  • you have a trading account size of $100,000
  • you will risk 1% of your account each time you trade, i.e 1% of $100,000, or $1000

Professional traders only risk from 0.2% to 1.5% per trade. Beyond this risk level is reckless!CLICK TO TWEET

We now have all the elements to do the estimates:

Frequency * Magnitude equals = Expected Value

150            * $1000                    = $150,000 (yearly income from trading this system)

So that is the very simple method for working out how much money you are going to need in order to live off your trading.

If you find the yearly income is too low or too high, you can of course adjust how much you will risk per trade. Be careful of letting greed influence you here: most professional traders risk anywhere from 0.2% to 1.5% per trade. Anything above this is generally considered to be venturing into the danger zone!

Finally, the most important considerations in answering the question “how much money will I need to trade?” are:

  • Knowing how much money you have to devote to your trading account. Be careful of throwing your life savings into this effort, especially in the early years of your trading career. Start slowly and build as your successes and confidence increase.
  • Selecting the right approach to trading, i.e. your chosen strategies or systems
  • Knowing your trading systems inside out – which means knowing all the parameters such as Frequency – will be necessary in answering the question “How Much Money Do I Need to Trade?”

For more on basic forex education click the following link to go to Forex School or continue on to more advanced topics in Forex University