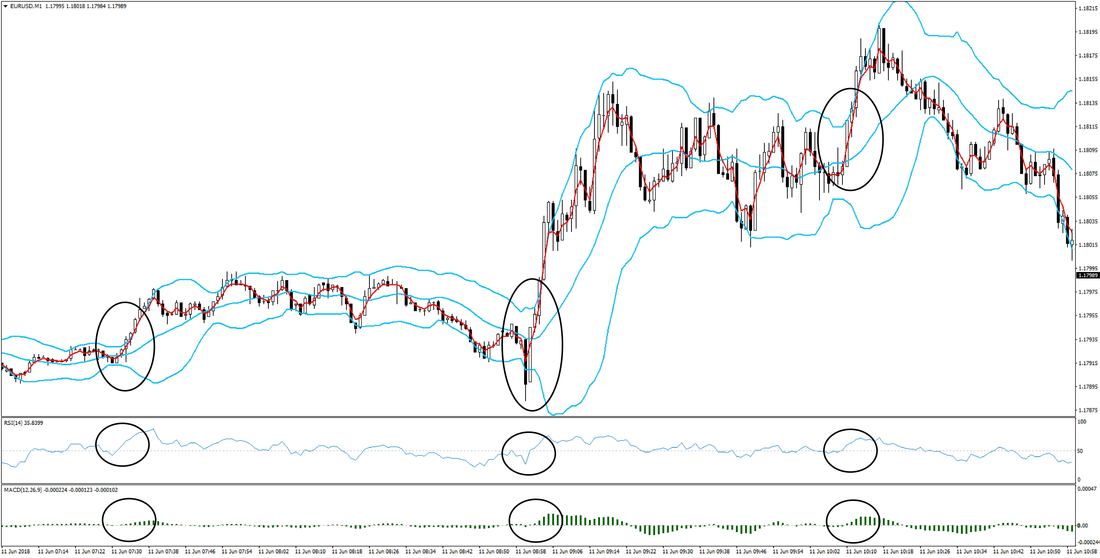
As you probably know by now, day trading is a preferable trading style for many traders over other approaches to crypto trading due to how it’s much faster when it comes to execution and profiting. Besides that, short-term trading is where technical analysis really shines, which many traders find very precise and also entertaining. |
The Advantages Of 1 Minute Charts
Another secret advantage is that 1-minute charts let you visualize a huge spectrum of price swings when zoomed out, which you can use for longer-term trades as well.
Scalping With The 1 Minute Chart
Scalping requires you to be able to perform technical analysis quickly and in minutes. That is not suitable on timeframes higher than the 5-minute chart, so the 1-minute chart is normally the first choice for scalpers.
Let’s have a look at this:
Or another great approach is to analyze higher time-frames (like 5m and above) and go in the direction of that time-frame, but open and time trade entries for example based on the 1m chart.
This is called MTF – multi-timeframe analysis – and it’s a very successful approach to trading that is applied by many professionals in the trading world.
You can read more about how that works in one of our Forex articles here.
- Wait for the full pattern to be verified – that is, wait for the second shoulder.
- As soon as it happens, locate your neckline. On this chart, I averaged it and marked it with a blue line (it’s also possible to draw the neckline by a trendline connecting both support levels of the shoulders – the neckline would be located around the same price level as the blue line on the chart).
- Wait for the price to break below the neckline – blue line. Thanks to the short timing, you can do this manually or place a BUY/SELL stop order.
- For S/L, locate the shoulder line and place it there (red line).
- For T/P, I always prefer to place T/P based on support /resistance zones. If there are no near S/R levels, you can use your S/L as a reference. For example, in this case, I gave it twice the size of my S/L.
As you can spot, following that standard procedure gave a nice $4 reward!
Extra: 1 Minute Chart For Longer Trades
Look at this view of a full trading day on a 30-minute chart:
Sure enough, this means that you need to process much more, so it may be less intuitive, but an experienced trader can get much more from the second chart than from the first one!
On the first chart, you can see how many times the trend reversed, which is a great indicator for determining when you should exit the trade.
On the other hand, the second chart also shows the same trend, but it lacks the information that you could’ve used to predict the ending point of the trend.
So, with all that said, I wish you much success and a lot of profits in your trading adventures!
Take care and trade well!


