China remains gripped in a slowdown, which is bad news for Australia, as the Asian giant is China’s largest trading partner. Chinese manufacturing PMI dropped to 50.1 in April, pointing to stagnation. Building approvals swung wildly, falling 15.5% in March, after a gain of 19.1% a month earlier.
In the U.S, the focus was on inflation. The producer price index slowed to 0.2% in April, down from 0.6% a month earlier. The core release also lost ground, dropping from 0.3% to 0.1%. This was followed by consumer inflation reports. CPI dropped from 0.4% to 0.3%, shy of the estimate of 0.4%. The core release remained stuck at 0.1%, short of the estimate of 0.2%.
President Donald Trump made good on his tariff threat, as the U.S. raised tariffs on $200 billion worth of Chinese goods on Friday, from 10% to 25%. Trump announced the move on Sunday, which sent shock waves across equity markets during the week. Risk appetite dropped, but the Australian dollar managed to hold its own last week.
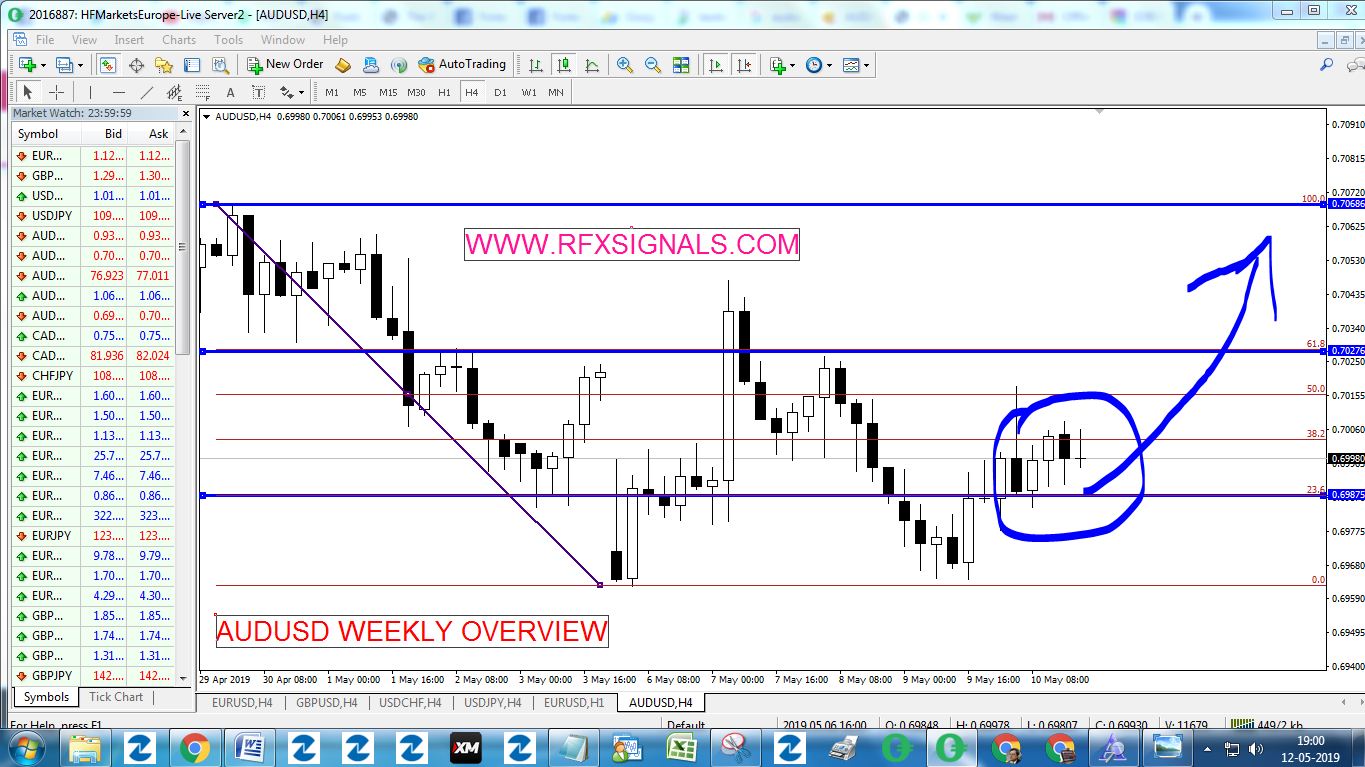
AUD/USD daily graph with support and resistance lines on it. Click to enlarge:
- Home Loans: Monday, 1:30. Home loans rebounded in February with a gain of 2.0%, after three straight declines. This reading easily beat the estimate of -3.0%. Another strong gain is expected in March, with an estimate of 2.2%.
- NAB Business Confidence: Tuesday, 1:30. The National Australia Bank survey has been losing ground and fell to zero in April, as the limping Australian economy continues to weigh on business sentiment.
- Westpac Consumer Sentiment: Wednesday, 00:30. The indicator has been alternating between gains and declines in recent months. Consumer confidence rebounded in April, with a gain of 1.9%.
- Wage Price Index: Wednesday, 1:30. This key inflation indicator has been fairly steady and edged lower to 0.5% in Q1, just shy of the forecast of 0.6%. The estimate for Q2 stands at 0.6%.
- MI Inflation Expectations: Thursday, 1:00. The Melbourne Institute indicator is a useful gauge for tracking actual inflation numbers. The indicator slowed to 3.9% in March, down from 4.1% a month earlier. Will the downturn continue in the April release?
- Employment Data: Thursday, 1:30. Job creation has been a bright spot in the Australian economy. In March, the economy created 25.7 thousand jobs, well above the estimate of 15.2 thousand. The forecast remains at 15.2 thousand for the April release. The unemployment rate ticked up to 5.0% in March, up from 4.9% a month earlier. No change is expected in the April release.
- Parliamentary Elections: Friday, All Day. Australians go to the polls in a general election. Prime Minister Scott Morrison, who heads a minority government, will attempt to win a third term. An unexpected result could push the Aussie downwards.
*All times are GMT
AUD/USD Technical Analysis
Technical lines from top to bottom:
We start with resistance at 0.7480. This marked the high point of the pair in mid-July and defends the round 0.75 level.
The round number of 0.74 was the high point reached at the wake of December. This is followed by 0.7340, which the pair breached in late November.
0.7315 was a swing high seen in late September. Further down, 0.7240 separated ranges in September and in October.
0.7190 is next.
Close by, 0.7165 (mentioned last week) was a swing low after a recovery in mid-November.
0.7085 was a low point in September.
0.6988 marked the low point in April. It remained relevant throughout the week.
Below, 0.6825 supported the pair in late 2016 and early 2017.
0.6744 was a low point in January.
0.6686 was an important cap back in January 2000. It is the final support line for now.
I remain bearish on AUD/USD
The RBA has stubbornly refrained from cutting rates, but the bank remains dovish as the Chinese slowdown continues to take a toll on the Australian economy. If economic numbers do not improve, a rate cut is a strong possibility. This would make the Aussie less attractive to investors.


