Essential For Your Trade- 123 Forex Trading Strategy

Powerful 123 Forex Trading Strategy

The 123 Forex trading strategy is based on price action and normal Forex market structure that any trader should know.  The 1 2 3 trading strategy is used as a continuation trading setup that is designed to take advantage of the trend of the market.

The failure of the 123 trading strategy is also a trade setup but can also warn you of potential price consolidation in the market or even a trend reversal in whatever Forex pair you are watching.

Keep in mind that even though it is a continuation pattern upon confirmation, it is also a reversal pattern from the short term trend direction.

1 2 3 Trading Pattern Formation

In any trending market, there is a pattern of higher highs and higher lows.  In order for the trend to the upside to remain active, each successive impulse swing must take out the point 2 in the formation.  When price surpasses the price at #2, the trader can use that as confirmation that the 1 2 3 chart pattern is present.

This is a line chart that explains the concept of the 1 2 3 trading pattern and in this case, we are assuming an up trending market

1 2 3 Trading Strategy

1 2 3 Trading Strategy

Let’s walk through each number and this pattern should be familiar to any trader who’s been looking at charts for a while.

  1. When an uptrend pulls back, it will put in a low and from that low, price continues to rally.
  2. This acts as short term potential resistance.  Price rallies to this point and then begins to retrace back in the direction of the price at #1.  We DO NOT want to see price retrace all the way to the price at #1.  If it does, we will consider that to be the formation of a double bottom chart pattern and would trade that according to the trading plan you have set up for that price pattern.
  3. This level is also considered a #1 only when the price level at #2 is broken.  This price point is the level at which the corrective move completes and the price reversal to the upside begins.

Please note that the 1 2 3 price pattern is only confirmed once the high at point #2 is taken out by price.

You can also see that the 1 2 3 trading strategy is taking advantage of the stair step nature of the market that is needed if a trend is going to continue.  It is at the confirmation of the patter that a trader can place a conservative trading position in the market

1 2 3 Chart Pattern By The Numbers

In an uptrend market situation, price will make 3 points

  • Point 1 is the lowest low point, forms a support level.
  • Point 2 will be the peak or the highest point, forms a level that we consider as potential resistance
  • Point 3 will be the 2nd low point, a support level ( which must be higher that the point 1 which is the lowest low point ).
  • The breakout of price above point 2  signals the continuation of the uptrend.

In a downtrend market, the 1 2 3 chart pattern forms when:

  • Point 1 becomes the highest peak when price finds resistance and moves down.
  • Point 2 becomes the lowest low point (forms support) and price moves up
  • Finds another resistance at point 3.
  • when price breaks the  point 2 support level,it indicates that the market is most likely to continue downward

Trading Strategy Trading Plan

Let’s take a look at a potential trading method to trade the 1 2 3 trading strategy.  We will look at a conservative method for those traders that need a little extra confirmation in their trades.

Keep in mind there is a cost involved.  The longer you wait to get involved in a trading position, the larger you will have to make your stop loss.

123 Trading Plan

123 Trading Plan

Trade Setup 1

You should be familiar with the numbers and what they represent on the chart.  We can see that price rallied from point 3, found resistance at point 2 and retraced.  We now have a double bottom chart pattern and just as the 1 2 3 trading strategy needs a breach of #2 to confirm the pattern, so does the double bottom.

If you do get a double bottom after a move in price, that could signify weakness in the market.  If bulls were fully in chart during the retrace at 2, we should not see two shots at the level #3.

Price breaks above #2 and you can either enter at the breakout or, my preference, take a position at the close of the candlestick to confirm a true break.  You can also put an order to buy slightly above the candlestick that broke the #2 level.

Your stop loss should be below #2 with buffer room to allow for noise.  You can also, my preference is coming, use a 14 period Average True Range x 2.

Trade Setup 2

Price rallies from #1 and gives us a strong reversal candlestick at #2.  Once price begins to retrace, put this currency pair on your radar.  Price find support at #2 (inside the previous consolidation pattern from trade #1) and shows strength as it rallied to #2

Once price shatters the #2 price zone, enter at the close of the daily candlestick (or whatever time frame you are using) and use an ATR stop.  The average true range stop for this trade would actually be in the middle of the candlestick that printed just before the breakout candlestick.

Trade Setup 3

Each trader should understand this pattern by now so let’s focus on the range that is occurring. We have most variables need for the 1 2 3 trading strategy but price is forming a range near the level at #3.

That is NOT something we want to see for a clean 1 2 3 chart pattern.

When price is basing in this fashion, it shows that the side that was dominant, in this case bulls, have tired.  As a trader for years, I have seen the following occur:

  1. Price trends nicely
  2. Weakness shows up in this fashion
  3. Traders will take another run to the upside, break #2 and then see this fail back inside

This formation of the consolidation is also a great trade entry into the potential of the 1 2 3 chart pattern continuing.
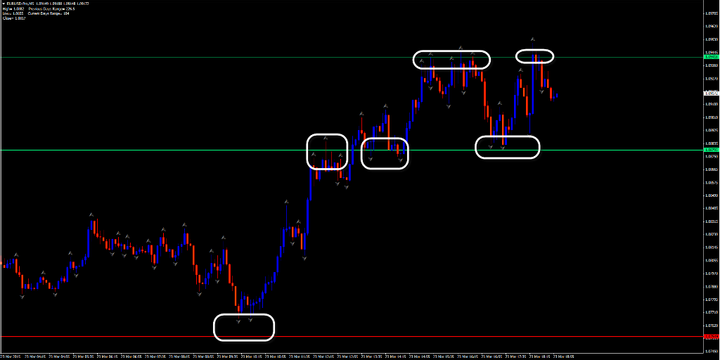
Front Running

Front Running

We can position early in the 1 2 3 formation when we have basing occurring.  Ideally, we would like to see some form of basing near the resistance level (red line).  You can see the green dashed line and then price rockets to resistance.

That is not conducive to a sustained break of resistance.

The more favorable setup is to have either basing near the extreme or a slight pullback in price which we see with orange box.  The break out then occurs after that pullback.

Those types of breaks are more effective and see if you can understand why.  Some would think the first break would carry more weight because the drive started midway in the range.

But traders who positioned lower will also look for scalping Forex trades at the top of the range – is that not how you play a range??  Yes.  The breakout that occurs is driven by traders who went long at the bottom of the range.

Let’s see some detail in this chart

  1. Price could not rally far from the low which is showing the 1 2 3 chart pattern – the stair stepping in a trend – is under attack.  Price can’t break lows so traders go into range trading mode
  2. The formation of this smaller range allows traders to position with a tighter stop loss just under the small range.
  3. You can see there was a drive to this level and then a very weak candlestick shows up.  This is either traders positioning short in the range or the longs taking profits.

That is the type of thinking you want to have as a trader.  Do not trade blind!

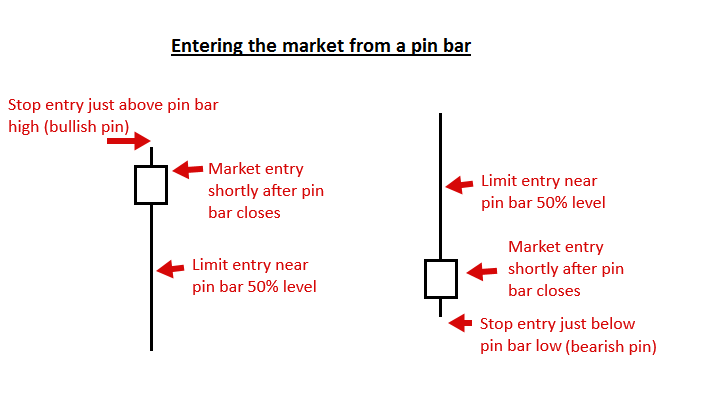
What Is Your Entry Strategy?

As discussed, you can enter at the close of the break out candlestick (signal candlestick) or entering your trading position at a break of the high.

Some traders may want to use a multiple time frame approach and enter on a lower time frame.  In my own trading and in my years as a trader, I look to simplify.  Entering at close or breaks of support levels or resistance levels (highs and lows of breakout candlesticks) is my favored entry

Taking Your Profits

Some traders would like to see specific price targets to add to their trading plan.  Other traders see the power of trailing their stop loss to take as much as the market is willing to give.

You can use structure targets such as higher resistance levels in an uptrend.

You can use legs 1-2=3-4 which suits the 1 2 3 trading strategy.

One to One Targets

One to One Targets

I color coded each swing so you can see where I am measuring from.  I use the 3 point Fibonacci tool and set it to the 100%.  You can see the first two trades nailed the targets.  The third trade hits the .618 Fibonacci level which is quite popular when used to portion out swing points.

Summary

The 1 2 3 trading strategy is a pure price action trading method that uses a sound approach to trading.

No trading indicators are required although I do suggest the ATR for stop loss placement.

You must have a proper risk protocol as part of your trading plan.

The SMA Forex Trading Strategy-For Beginners

The SMA Forex Trading Strategy

One Forex strategy that you might like to try is based on a straightforward indicator known as theSimple Moving Average (SMA). The SMA Forex trading strategy aims to provide the highest possible return for the amount of risk assumed. The SMA measures a security’s value during a specific time frame, to give traders a better sense of when to buy and sell a currency pair.

For example, if you set up a 12-period SMA with 15-minute intervals, any increase in the currency pair’s value above the 12-period SMA could present a signal to buy. Likewise, should the currency pair’s price fall below the 12-period SMA, it could be a signal to sell. This popular Forex trading strategy may be good for beginners as it can be used with any time frame, and with most trading instruments.

Additionally, you can combine the SMA with helpful tools, like indicators. Traders may choose to use the SMA as the foundation of their strategy, and then build from there. No matter what you do, remember to test all Forex trading strategies on a Demo Account first, before going live. One way beginners can develop their own approach is to test more understandable SMA-based trading strategies, and then add other indicators when and if consistently desirable results are achieved.

Optimise Potential Profit with Positional Trading

You cannot predict which strategy will provide you with the most success, or indeed any at all. However, positional trading could be a potentially profitable Forex strategy. Positional trading involves holding positions over the long term – usually, between one month and a year. It has the advantage of being largely hands-off. However, it requires a long-term plan, and the ability to predict future market direction. To get started with positional trading, you must first pick an asset. When determining which currency pair to use, there are three factors you need to consider:

High Long-Term Volatility

Volatility is crucial for turning a profit. You need to pay for ‘SWAPs’ every night in order to hold a trade open, and you could easily suffer a loss on any given night, unless your currency pair experiences some notable price movements within a few months. One way to increase the odds of success is to select currency pairs that may feel influence from:

  • Upcoming political events
  • Economic events in the near future.

Low Short-Term Volatility

A currency pair with low short-term volatility is more likely to move slowly in the direction of your trade, instead of experiencing sharp fluctuations that might prompt you to close your position.

Use Low Margin

While Forex traders frequently trade with very high leverage, this approach is not suitable for positional trading. When it comes to positional trading, keep one thing in mind – the less leverage you use, the better it may be. To determine how much margin to use for your Forex strategy, consider the following variables:

  • The amount of money you have outside your trading account – remember to only trade with risk capital
  • How much leverage will provide the best risk-reward ratio

Benefits of Scalping

Profitable Forex strategies. Scalping

Source: EURUSD Chart – Data Range: May 2016 – An example of scalping – Please Note: Past performance does not indicate future results, nor is it a reliable indicator of future performance.

While positional trading may (or may not) produce great benefits, trading can appeal to many different types of people, for different reasons. Some traders enjoy spending time watching the markets, as doing so gets their heart beating and their adrenaline flowing. One Forex strategy that may provide this adrenaline rush is scalping. The idea behind the scalping strategy is to complete a large number of trades that individually generate small rewards – between five to ten pips each.

Traders usually keep these positions for one to five minutes, and spend all day monitoring buy/sell signals. Some professional traders have generated great returns with this approach, including Paul Rotter. Mr. Rotter attained legendary status with scalping and earned the nickname ‘The Flipper’ for his quick trading actions. Rotter would open buy/sell positions simultaneously on the derivatives exchange ‘Eurex’. When traders responded, he would quickly scalp profit from one alternative.

One crucial factor in Rotter’s success was to closely watch the order book. To cultivate your own unique and efficient Forex trading strategy, consider these key variables:

  • Your desired risk-reward ratio
  • Your tolerance for stress
  • How much time per day you want to spend trading

Most importantly, only use techniques you fully understand and never stop improving your strategy. A free Demo account is perfect for testing new things out risk-free, and for working on your overall performance.

Fibonacci Pivot Strategy-For daily traders

The Another one of our free forex strategies trades a confluence between daily Pivots and Fibonacci retracement levels.

The Daily Fibonacci Pivot Strategy uses standard Fibonacci retracements in confluence with the daily pivot levels in order to get trade entries. My preferred parameters are the 38% or 50% Fibonacci levels in confluence with the daily central pivot. The examples following show entries at the 38%, 50% and 62% Fibonacci retracement levels in confluence with the daily central pivot.

As with all free forex strategies, there are many possible interpretations and variations. My particular take on this strategy is as follows:

  • look for an entry on any currency pair where the average true range for the last five day period has been exceeded in the previous day’s trading session
  • at the start of the current trading session draw fibs:
  • look for a confluence of Fibonacci retracement levels with the daily central pivot
  • If price retraces to the confluence identified, either enter at market or wait for a confirmatory candle signal to occur at the confluence before entry. Obviously, it is more risky to enter before getting the confirmatory signal, but such an approach gives a greater possible reward to risk ratio.

Let’s have a look at a few charts to see how this works.

The first chart shows a long entry at the confluence of the 38% Fibonacci retracement and the daily central pivot:

Free Forex Strategies: Fibonacci/Pivot Long Entry 1

It was possible to enter either way here, either by buying at the first touch of that level, or waiting for the morning star candle formation to form. Both entries would have given a possible target at the 127% Fibonacci extension level, which was easily reached.

The suggested stop loss for these trades is behind the Fibonacci level one level away from where you take the trade. In this case it would amount to the 50% retracement level, with a few pips extra thrown in for buffering.

The next trade shows the reverse setup of the previous trade, with a sell occurring at the confluence of the 38% retracement and the daily central pivot:

Free Forex Strategies: Fibonacci/Pivot Short Entry 1

This was a nice set up given the big drop that occurred in the previous trading session. That drop signified a change in sentiment which would have added weight to the decision to sell.

Another example, again, a sell after a long run down the day before:

Free Forex Strategies: Fibonacci/Pivot Short Entry

This time the sell occurs at the 50% retracement level, although it is not in perfect confluence with the daily central pivot. Still, a nice evening star pattern occurred with both the daily central pivot and the 50% retracement level being respected prior to entry,

The last example shows a confluence of the central pivot with the 62% retracement level, plus old lows at the left of the chart:

Free Forex Strategies: Fibonacci/Pivot Short Entry 3

This is an example of the fact that any pivot level can be used in confluence with the daily central pivot. In this case price retraced to once more retest the entry-level on the next day, but you should have had profit taken out of the trade by then, if not having exited at full profit.

As always with any new strategy, and in particular free forex strategies, remember to fully back test and live test in a demo account before going live with this particular play, if you decide it is a good fit for you.

ABCD STRATEGY -YOU MUST NEED TO KNOW ABOUT IT IN YOUR FOREX TRADE

The ABCD is a basic harmonic pattern. All other patterns derive from it. The pattern consists of 3 price swings. The lines AB and CD are called “legs”, while the line BC is referred to as a correction or a retracement. AB and CD tend to have approximately the same size.

A bullish ABCD pattern follows a downtrend and means that a reversal to the upside is likely. A bearish ABCD pattern is formed after an uptrend and signals a potential bearish reversal at a certain level. The rules for trading bullish and bearish ABCD patterns are the same, you will just need to take into account the direction of the pattern you trade and the movement of the market it predicts.

There are several types of ABCD pattern (all the 3 patterns at the picture are bullish).

Screenshot_2.png

In the classic one, the point C should be at 61.8%-78.6% of AB (Use Fibonacci retracement tool on AB: the point C should be close to 61.8%). The point D, in its turn, should be at the 127.2%-161.8% Fibonacci expansion of BC.

Notice that a 61.8% retracement at the point C tends to result in the 161.8% projection of BC, while a 78.6% retracement at the C point will lead to the 127% projection.

There is also the so-called AB=CD pattern. Here CD has exactly the same length as AB. In addition, it takes the market the equal time to travel from A to B as from C to D. As a Result, AB and CD have the same angle. This type of ABCD pattern is seen quite often and is popular among traders.

The third type is when CD is the 127.2%-161.8% extension of AB. CD can be even 2 times (or more) bigger than AB. There actually are some signs that can hint that CD will be much longer than AB. They are a gap after point C or big candlesticks near point C.   

How to trade ABCD pattern

The key thing you should remember is that you can enter the trade only after the price reached the point D.

Study the chart looking at the price’s highs and lows. It may be helpful to use ZigZag indicator (Insert – Indicators – Custom – ZigZag) that marks the chart’s swings.  

Watch the price as it forms AB and BC. In a bullish ABCD, C must be lower than A and should be the intermediate high after the low at B. Point D must be a new low below B.  

When the market arrives at a point, where D may be situated, don’t rush into a trade. Use some techniques to make sure that the price reversed up (or down if it’s a bearish ABCD). The best scenario is a reversal candlestick pattern. A buy order may be set at or above the high of the candle at point D.

Screenshot_3.png

Take profit levels

Here are the target levels for trading the ABCD pattern.  

TP1: 38.2% retracement of AD

TP2: 61.8% retracement of AD

TP3: point A

We recommend using these levels together with support and resistance you identify at the chart using various tools of technical analysis. Don’t forget to have a look at senior timeframes when you hunt for support and resistance levels.  

If the price moved to TP1 fast, the odds are that it will continue towards TP2. On the contrary, if the price is slow to get to TP1, this might mean that it will be the only TP level you’ll get.

There are many cases when the market reversed after AC=CD pattern going beyond point A.

As for Stop Loss, there are no special recommendations. You can put a Stop Loss in line with your risk management rules.

Here’s an example of the ABCD patterns on the chart:

Screenshot_13.png

Conclusion

You can find many ABCD pattern on one chart. The rules for trading each of them are as explained above. Make sure that you know how to apply Fibonacci tools correctly an follow all our tips. 

rfxsignals August 8, 2019 No Comments

DAILY FREE FOREX SIGNALS FOR 08-08-2019 | Форекс – Сообщество Трейдеров |إشارات الفوركس|외환 신호

GBPNZD SELL-1.88049
SL-1.88916
TP1-1.87663
TP2-1.87322

EURAUD SELL-1.65024
SL-1.66237
TP1-1.64624
TP2-1.64191

AUDCAD BUY -0.90225
SL-0.89773
TP1-0.90446
TP2-0.90631

CADJPY SELL-79.771
SL-80.133
TP1-79.586
TP2-79.422

AUDUSD BUY -0.67901
SL-67381
TP1-0.68162
TP2-0.68377

EURJPY SELL-118.856
SL-119.247
TP1-118.654
TP2-118.452

Reason for Gold trades at $1500 for the first time in over past 6 years

Highest level since April 2013

Gold trades at 1500 for the first time since April 2013

The price of gold has reached the 1500 level for the first time in over six years  (April 2013). In the process the pair has now moved above the 50% retracement of the move down from the 2011 high price at $1483.  That is now a close risk level for longs.
The run higher continues as flight to safety flows dominate.  
US stocks are tumbling with the Dow down -568 points or -2.11%. The S&P index is down 1.89% and the NASDAQ index is down -1.63%.
US yields are also tumbling with the 10 year down 9.7 basis points at 1.606%. There was a research report from PIMCO saying US yields going negative is a possibility.  

Pres. Trump is focused on the Fed today, tweeting:

US yields are moving sharply lower
rfxsignals August 7, 2019 No Comments

DAILY FREE FOREX SIGNALS FOR 07-08-2019 | Форекс – Сообщество Трейдеров |إشارات الفوركس|외환 신호

GBPCHF BUY-1.18963
SL-1.18483
TP1-1.19141
TP2-1.19337

EURJPY SELL-118.892
SL-119.450
TP1-118.666
TP2-118.468

AUDNZD BUY -1.04922
SL-1.04299
TP1-1.05250
TP2-1.05601

EURUSD SELL-1.11903
SL-1.12212
TP1-1.11723
TP2-1.11562

USDCHF BUY -0.97692
SL-0.97331
TP1-0.97861
TP2-0.98020

AUDCAD BUY-0.89396
SL-0.88880
TP1-0.89623
TP2-0.89877

EURNZD SELL-1.74346
SL-1.75149
TP1-1.74016
TP2-1.73709

GBPAUD SELL-1.80804
SL-1.81567
TP1-1.80588
TP2-1.80387

USDCAD SELL-1.32868
SL-1.33188
TP1-1.32682
TP2-1.32471

EURAUD SELL-1.66238
SL-1.67173
TP1-1.65920
TP2-1.65609

GBPNZD SELL-1.89294
SL-1.90181
TP1-1.88998
TP2-1.88738

Pin Bar Trading Strategy

Pin Bar Trading Strategy

The Pin Bar Pattern (Reversal or Continuation)

A pin bar pattern consists of one price bar, typically a candlestick price bar, which represents a sharp reversal and rejection of price. The pin bar reversal as it is sometimes called, is defined by a long tail, the tail is also referred to as a “shadow” or “wick”. The area between the open and close of the pin bar is called its “real body”, and pin bars generally have small real bodies in comparison to their long tails.

The tail of the pin bar shows the area of price that was rejected, and the implication is that price will continue to move opposite to the direction the tail points. Thus, a bearish pin bar signal is one that has a long upper tail, showing rejection of higher prices with the implication that price will fall in the near-term. A bullish pin bar signal has a long lower tail, showing rejection of lower prices with the implication that price will rise in the near-term.

pinbar1

How to Trade with Pin Bars

When trading pin bars, there are a few different entry options for traders. The first, and perhaps most popular, is entering the pin bar trade “at market”. That simply means you enter the trade at the current market price.

Note: the pin bar pattern must be closed out before entering the market based on it. Until the bar is closed as a pin bar pattern, it’s not really a pin bar yet.

Another entry option for a pin bar trading signal, is entering on a 50% retrace of the pin bar. In other words, you would wait for price to retrace to about the halfway point of the entire pin bar’s range from high to low, or its “50% level”, where you would have already placed a limit entry order.

A trader can also enter a pin bar signal by using an “on-stop” entry, placed just below the low or above the high of the pin bar.

Here’s an example of what the various pin bar entry options might look like:

pinbar2

Trading Pin Bar Signals in a Trending Market

Trading with the trend is arguably the best way to trade any market. A pin bar entry signal, in a trending market, can offer a very high-probability entry and a good risk to reward scenario.

In the example below, we can see a bullish pin bar signal that formed in the context of an up-trending market. This type of pin bar shows rejection of lower prices (note the long lower tail), so it’s called a “bullish pin bar” since the implication of the rejection reflected in the pin bar is that the bulls will resume pushing price higher…

pinbar3

Trading Pin Bars against the Trend, From Key Chart Levels

When trading a pin bar counter to, or against a dominant trend, it’s widely accepted that a trader should do so from a key chart level of support or resistance. The key level adds extra ‘weight’ to the pin bar pattern, just as it does with counter-trend inside bar patterns. Any time you see a point in the market where price initiated a significant move either up or down, that is a key level to watch for pin bar reversals.

pinbar4

Pin bar Combo Patterns

Pin bars can also be traded in combination with other price action patterns. In the chart below, we can see an inside pin bar combo pattern. This is a pattern in which the inside bar is also a pin bar pattern. These inside pin bar signals work best in trending markets like we see below…

pinbar5

The pattern in the chart below could be considered the ‘opposite’ of the inside-pin bar, it’s an inside bar inside a pin bar signal. It’s relatively common to see an inside bar form within the range of a pin bar pattern. Often, a large breakout move will follow an inside bar formed within a pin bar’s range, for this reason, the pin bar + inside bar combo setup is a very potent price action trading pattern, as we can see in the chart below…

pinbar5-1

Double Pin Bar Patterns

It is not uncommon to see back-to-back or “double pin bar patterns” from at key levels in the market. These patterns are traded just like a normal pin bar, except they provide a trader with a little more ‘confirmation’ since they reflect two consecutive rejections of a level…

pinbar6

Pin Bar Trading Tips

  • As a beginning trader, it’s easiest to learn how to trade pin bars in-line with the dominant daily chart trend, or ‘in-line with the trend’. Counter-trend pin bars are a bit trickier and take more time and experience to become proficient at.
  • Pin bars basically show a reversal in the market, so they are a very good tool for predicting the near-term, and sometimes long-term, direction of price. They often mark major tops or bottoms (turning points) in a market.
  • Not every pin bar is going to be one worth trading. The best ones occur in strong trends after a retrace to support or resistance within the trend, or from a key chart level of support or resistance.
  • As a beginner, keep your eyes peeled for daily chart time frame pin bars as well as 4 hour chart time frame pin bars, as they seem to be the most accurate and profitable.
  • Longer tails on a pin bar indicate a more significant reversal and rejection of price. Thus, long-tailed pin bars tend to be a little higher-probability than their shorter-tailed counter-parts. Long-tailed pin bars also tend to see price retrace to near the pin bar’s 50% level more often than shorter-tailed pins, this means they are typically better candidates for the 50% retrace entry discussed previously.
  • Pin bars will show up in any market. Be sure you practice identifying and trading them on a demo account before trading them with real money. Practice makes perfect.

Pin Bar Strategy -may be change your forex trade style!!!

An Introduction To The Pin Bar Forex Trading Strategy and How to Trade It Effectively…

The pin bar formation is a price action reversal pattern that shows that a certain level or price point in the market was rejected. Once familiarized with the pin bar formation, it is apparent from looking at any price chart just how profitable this pattern can be. Let’s go over exactly what a pin bar formation is and how you can take advantage of the pin bar strategy in the context of varying market conditions.

What is a Pin Bar?

The actual pin bar itself is a bar with a long upper or lower “tail”, “wick” or “shadow” and a much smaller “body” or “real body”, you can find pin bars on any stripped-down, “naked” bar chart or candlestick chart. We use candlestick charts because they show the price action the clearest and are the most popular charts amongst professional traders. Many traders prefer the candlestick version over standard bar charts because it is generally regarded as a better visual representation of price action.

Characteristics of the Pin Bar Formation

• The pin bar should have a long upper or lower tail…the tail is also sometimes called the “wick” or the “shadow”…they all mean the same thing. It’s the “pointy” part of the pin bar that literally looks like a “tail” and that shows rejection or false break of a level.

• The area between the open and close of the pin bar is called the “body” or “real body”. It is typically colored white or another light color when the close was higher than the open and black or another dark color when the close was lower than the open.

• The open and close of the pin bar should be very close together or equal (same price), the closer the better.

• The open and close of the pin bar are near one end of the bar, the closer to the end the better.

• The shadow or tail of the pin bar sticks out (protrudes) from the surrounding price bars, the longer the tail of the pin bar the better.

• A general “rule of thumb” is that you want to see the pin bar tail be two/thirds the total pin bar length or more and the rest of the pin bar should be one/third the total pin bar length or less.

• The end opposite the tail is sometimes referred to as the “nose”

pin bar trading strategy

Bullish Reversal Pin Bar Formation

In a bullish pin bar reversal setup, the pin bar’s tail points down because it shows rejection of lower prices or a level of support. This setup very often leads to a rise in price.

Bearish Reversal Pin Bar Formation

In a bearish pin bar reversal setup, the pin bar’s tail points up because it shows rejection of higher prices or a level of resistance. This setup very often leads to a drop in price.

bullish and bearish pin bar reversal diagram

How to Trade a Pin Bar Formation

The pin bar formation is a reversal setup, and we have a few different entry possibilities for it:

“At market entry” – This means you place a “market” order which gets filled immediately after you place it, at the best “market price”. A bullish pin would get a “buy market” order and a bearish pin a “sell market” order.

“On stop entry” – This means you place a stop entry at the level you want to enter the market. The market needs to move up into your buy stop or down into your sell stop to trigger it. It’s important to note that a sell stop order must be under the current market price, including the spread, and a buy stop order must be above the current market price, including the spread. If you need more help on these “jargon” words checkout my free beginners forex course for more.

On a bullish pin bar formation, we will typically buy on a break of the high of the pin bar and set our stop loss 1 pip below the low of the tail of the pin bar. On a bearish pin bar formation, we will typically sell on a break of the low of the pin bar and place a stop loss 1 pip above the tail of the pin bar. There are other stop loss placements for my various setups taught in my advanced price action course.

“Limit entry” – This entry must be placed above the current market price for a sell and below the current market price for a buy. The basic idea is that some pin bars will retrace to around 50% of the tail, so we can look to enter there with a limit order. This provides a tight stop loss with our stop loss just above or below the pin bar high or low and a large potential risk reward on the trade as a result.

pin bar trading entry types

To effectively trade the pin bar formation you need to first make sure it is well-defined, (see pin bar characteristics listed at the top of this tutorial). Not all pin bar formations are created equal; it pays to only take the pin bar formations that meet the above characteristics.

Next, try to only take take pin bars that are displaying confluence with another factor. Generally, pin bars taken with the dominant daily chart trend are the most accurate. However, there are many profitable pin bars that often occur in range-bound markets or at major market turning points as well. Examples of “factors of confluence” include but are not limited to: strong support and resistance levels, Fibonacci 50% retracement levels, or moving averages.

How to trade pin bars from key chart levels

Trading Pin Bar Signals with Support and Resistance Confirmation, is perhaps one of the most effective ways to trade forex, if not thee most effective way to trade. Below, we will show some examples of trading pin bars from key levels. Follow along closely because this is likely to be one of the most powerful Forex trading strategies you will ever learn.

Pin bars are one of the most valuable tools that price action traders have in their Forex trading arsenal. They often form at major market turning points, correction levels, or within a trend as continuation signals. When combined with a strong support or resistance level, pin bars can be one of the most accurate trading signals available. The best pin bar setups occur near confluent levels of previous price action as the market moves in one direction and then regresses back to re-test a previous support or resistance level. We can see in this daily chart of EUR/USD two successive pin bars testing a previous support and resistance level and then resuming downward movement

pinbarswithtrend

Pin bars occur in all market conditions; up trends, down trends, and range bound. The beauty of price action analysis is that it teaches you how to analyze market movement based on inherently generated data; namely price data. Reversal bars taken at confluent levels can act as a map to long-term profits in the forex market. Trader’s can design a highly profitable trading method entirely around pin bars if they so desire. The more confluence added to a pin bar formation the more accurate it becomes. We can see in this daily chart of GBP/USD below a beautiful pin far formed at a previous support/resistance level with the up trend and also at a Fibonacci 50% retrace level. The more confluence you can combine with a pin bar signal the higher its accuracy becomes.

confluentpinbarsignal

Pin bars are adaptable to ever-changing forex market conditions and can be very profitable even in ranging markets. They can be very accurate if the formation is clear and obvious and combined with solid support or resistance confirmation. We can see in the daily chart of EUR/JPY below two very well formed counter-trend pin bars that formed off support in a range bound market that netted some serious gains for traders with a keen eye for price action analysis. Pin bars of this clarity and magnitude can be entered after the close on a market order.

pinbarsoffsupport

Pin bars can be taken at major market turning points counter-trend if they are very well formed. Often times long-term trend changes are set off by large pin bars that can result in some serious gains for traders aware of the potential. The daily GBP/JPY chart below demonstrates how a large, well formed pin bar can tip off traders to longer-term changes in trend direction. Often times trend changes will occur rapidly and form what is called a “V” bottom with the bottom bar being a pin bar.

vshapedreversalpin

When pin bars form at the top or bottom of a consolidating market that is taking a breather after a large directional movement they can often signal trend resumption is near. In the daily chart of USD/CAD below we can see multiple pin bars formed at the top of a range bound market that was most recently in a large down trend. The last pin bar on the right side of the chart set off a very powerful move that resulted in a breakout of the range and subsequent downward trend resumption.

pintrendcontinuation

pin bar reversals are a great price action tool that forex traders can use in all market conditions. They are best played at confluent levels with strong support and resistance confirmation. Pin bars taken with the dominant daily trend are generally more accurate than counter trend pins. However, counter trend pins can set off long-term directional bias changes that can mean serious cash for traders with a trained eye. Pin bars work great at the tops and bottoms of range-bound markets and provide very accurate setups in these conditions.

Examples of the Pin Bar Formation in Action

Here is a daily chart of CAD/JPY, we can see numerous pin bar formations that were very well defined and worked out very nicely. Note how all the pin bar’s tails clearly protruded from the surrounding price action, showing a defined “rejection” of lower prices. All of the pin bars below have something in common that we just discussed, can you guess what it is?

pin bar trading example

If you said that all the pin bars in the above chart are “bullish pin bar setups”, then you answered the question right. Good job!

In the following daily USD/JPY chart we can see an ideal pin bar formation that resulted in a serious move and trend reversal. Sometimes pin bars like this form at significant market turning points and change the trend very quickly, like we see below. The example in the chart below is also sometimes called a “V bottom reversal”, because the reversal is so sharp it literally looks a V…

pin bar definition

Here is an example of a trending market that formed numerous profitable pin bar setups. The following daily chart of GBP/JPY shows that pin bars taken with the dominant trend can be very accurate. Note the two pin bars on the far left of the chart that marked the start of the uptrend and then as the trend progressed we had numerous high-probability opportunities to buy into it from the bullish pin bars shown below that were in-line with the uptrend.

pin bars in trend

Pin bar in range-bound market and at important market turning point (trend change):

In the chart example below, we can see a bearish pin bar sell signal that formed at a key level of resistance in the EURUSD. This was a good pin bar because it’s tail was clearly protruding up through the key resistance and from the surrounding price action, indicating that a strong rejection as well as false-break of an important resistance had taken place. Thus, there was a high probability of a move lower after that pin bar. Note the 50% limit sell entry that presented itself as the next bar retraced to about 50% of the pin bar’s length before the market fell significantly lower…

pin bar 50 percent entry

Pin bar in-line with trend with multiple factors of confluence:

In the chart example below, we are looking at a bearish pin bar sell signal that formed in the context of a down-trending market and from a confluent area in the market. The confluence between the 8 / 21 dynamic EMA resistance layer, the horizontal resistance at 1.3200 and the downtrend, gave a lot of “weight” to the pin bar signal. When we get a well-defined pin bar like this, that has formed at a confluent area or level in the market like this, it’s a very high-probability setup…

pin bar with confluence

Other names you might find pin bars described by:

There are several different names used in ‘classic’ Japanese candlestick patterns that refer to what are basically all pin bars, the terminology is just a little different. The following all qualify as pin bars and can be traded as I’ve described above:

• A bearish reversal or top reversal pin bar formation can be called a “long wicked inverted hammer”, “long wicked doji”, “long wicked gravestone”, or “shooting star”.

• A bullish reversal or bottom reversal pin bar formation can be called a “long wicked hammer”, “long wicked doji”, or “long wicked dragonfly”.

rfxsignals August 6, 2019 No Comments

DAILY FREE FOREX SIGNALS FOR 06-08-2019 | Форекс – Сообщество Трейдеров |إشارات الفوركس|외환 신호

AUDUSD BUY -0.68011
SL-0.67643
TP1-0.68252
TP2-0.68480

AUDCAD BUY -0.89665
SL-0.89273
TP1-0.89886
TP2-0.90114

GBPJPY BUY -129.773
SL-128.583
TP1-130.186
TP2-130.639

GBPUSD BUY -1.21946
SL-1.21381
TP1-1.22174
TP2-1.22404

EURGBP SELL-0.91936
SL-0.92476
TP1-0.91727
TP2-0.91509

GBPCAD BUY -1.60777
SL-1.60077
TP1-1.61013
TP2-1.61245

GBPCHF BUY -1.18781
SL-1.18244
TP1-1.19019
TP2-1.19201

EURAUD SELL-1.64860
SL-1.66279
TP1-1.64375
TP2-1.63864

NZDUSD BUY -0.65494
SL-0.65089
TP1-0.65708
TP2-0.65905

EURNZD SELL-1.70911
SL-1.72447
TP1-1.70293
TP2-1.69655