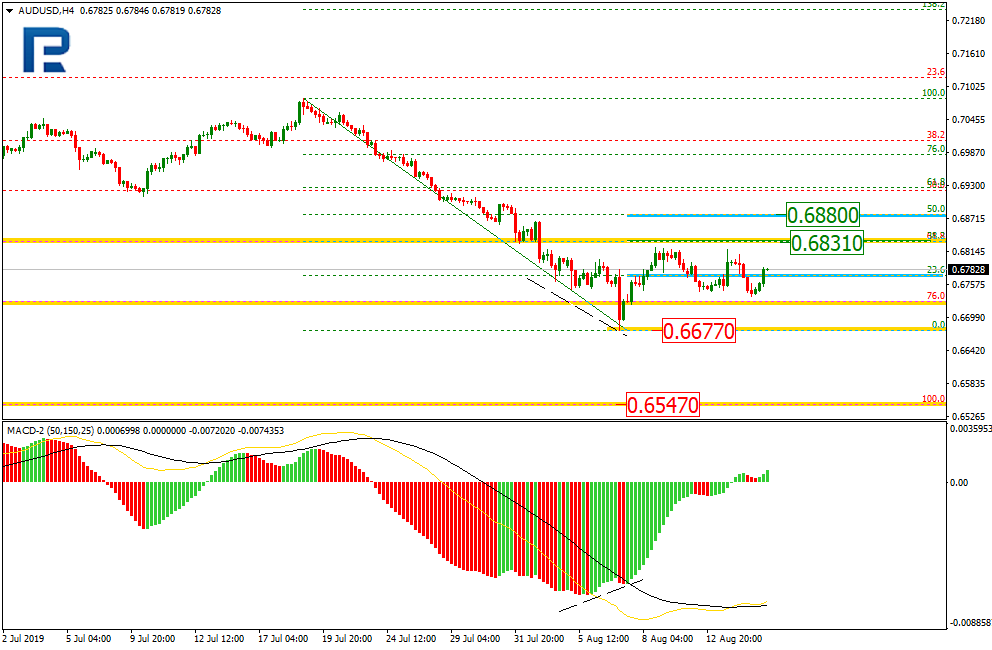
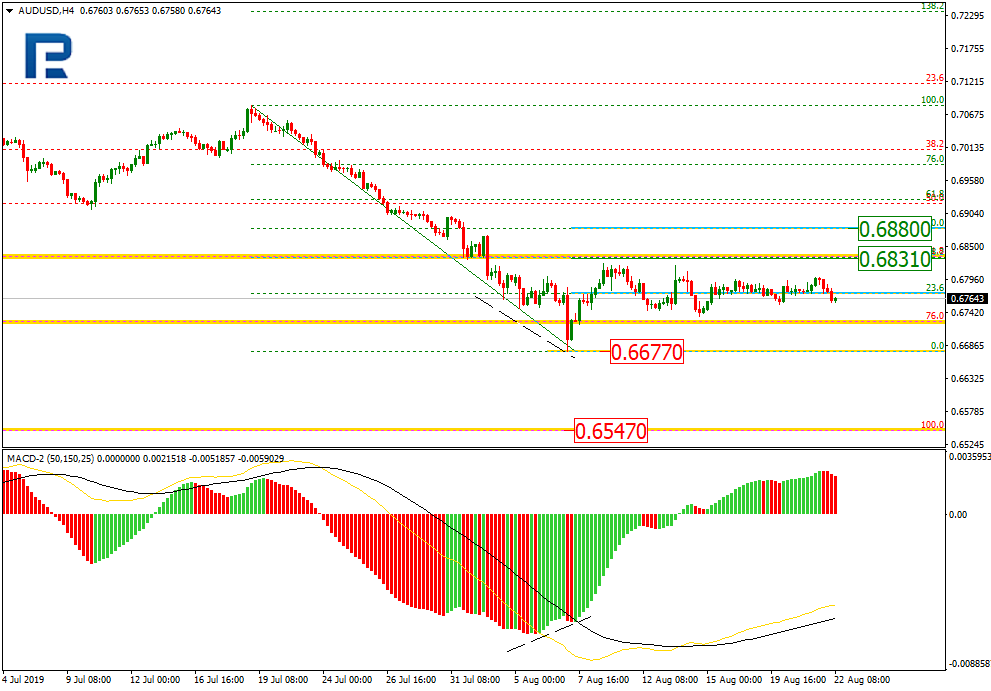
As we can see in the H4 chart, the convergence made AUDUSD start a new pullback, which was very close to 38.2% fibo at 0.6831 several times, but hasn’t reached it yet. After breaking this level, the pair may continue growing towards 50.0% fibo at 0.6880. When the correction is over, the instrument may break the local support at 0.6677 and then continue falling to reach the long-term low at 0.6547.
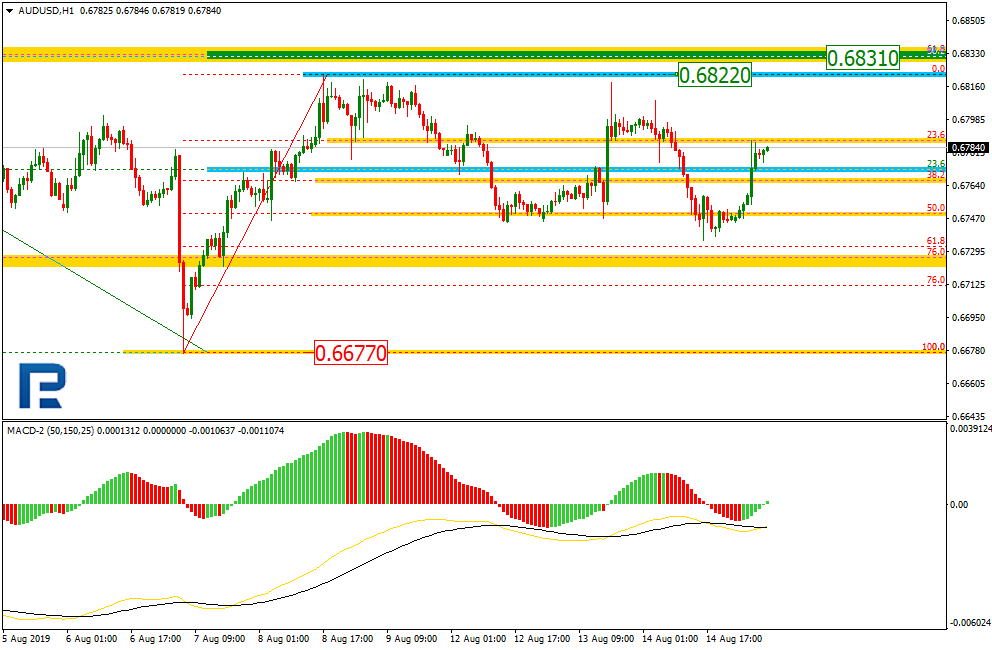
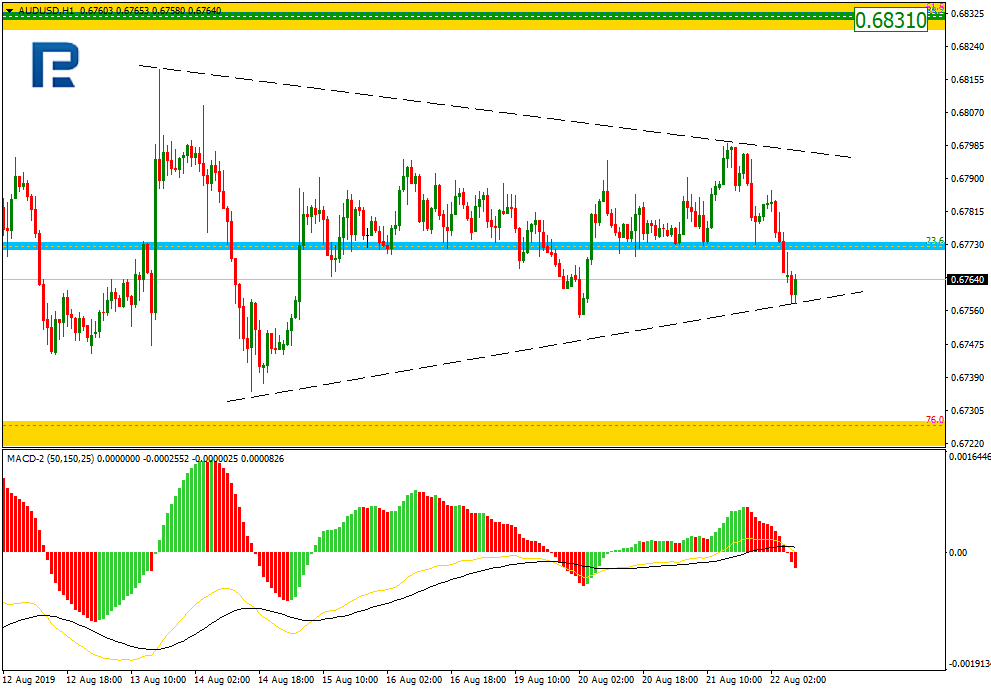
In the H1 chart, AUDUSD has been corrected to the downside by 50.0%. Right now, the pair is forming a new rising impulse towards the local high at 0.6822.
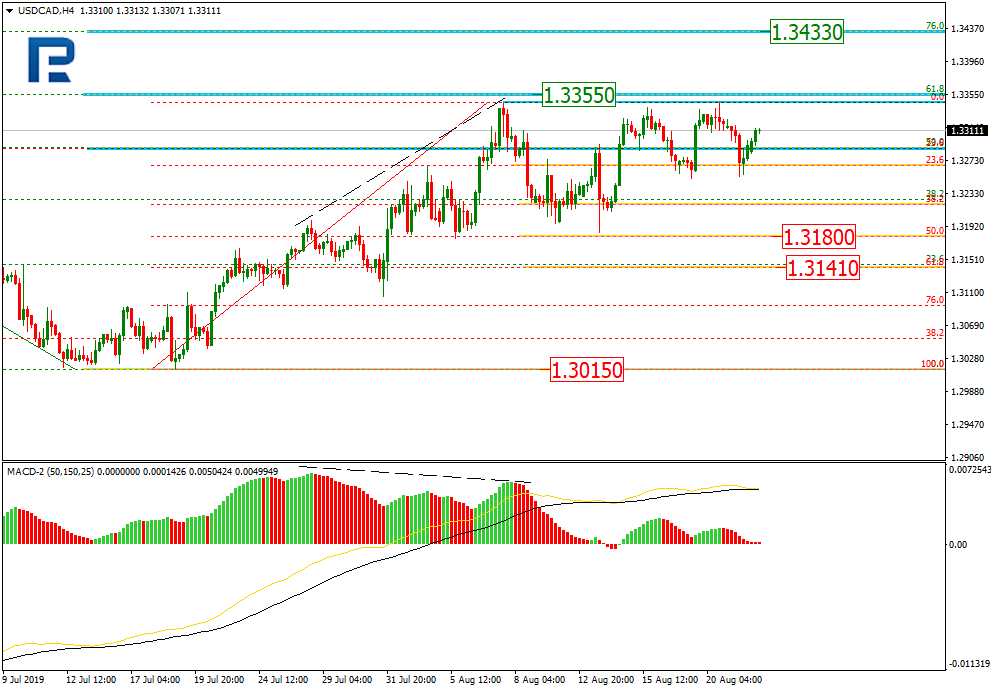
USDCAD, “US Dollar vs Canadian Dollar”
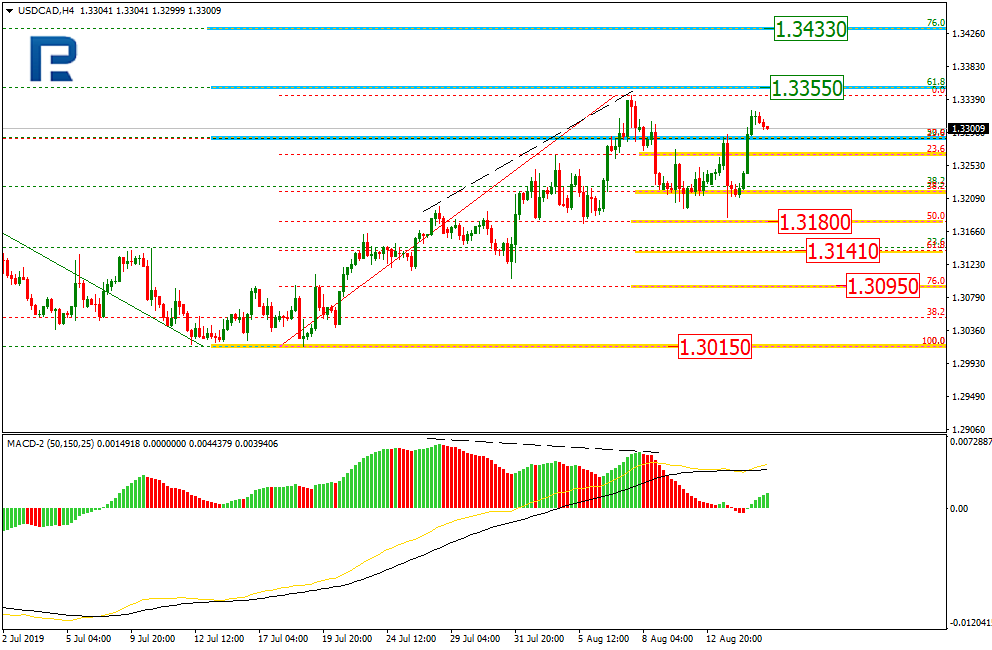
As we can see in the H4 chart, after reaching 50.0% fibo at 1.3180, USDCAD has rebounded towards the high. If the pair breaks it, the price may continue trading to reach 61.8% and 76.0% fibo at 1.3355 and 1.3433 respectively. Otherwise, the instrument may resume falling towards 50.0%, 61.8%, and 76.0% fibo at 1.3180, 1.3141, and 1.3095 respectively. The key target is the low at 1.3015.
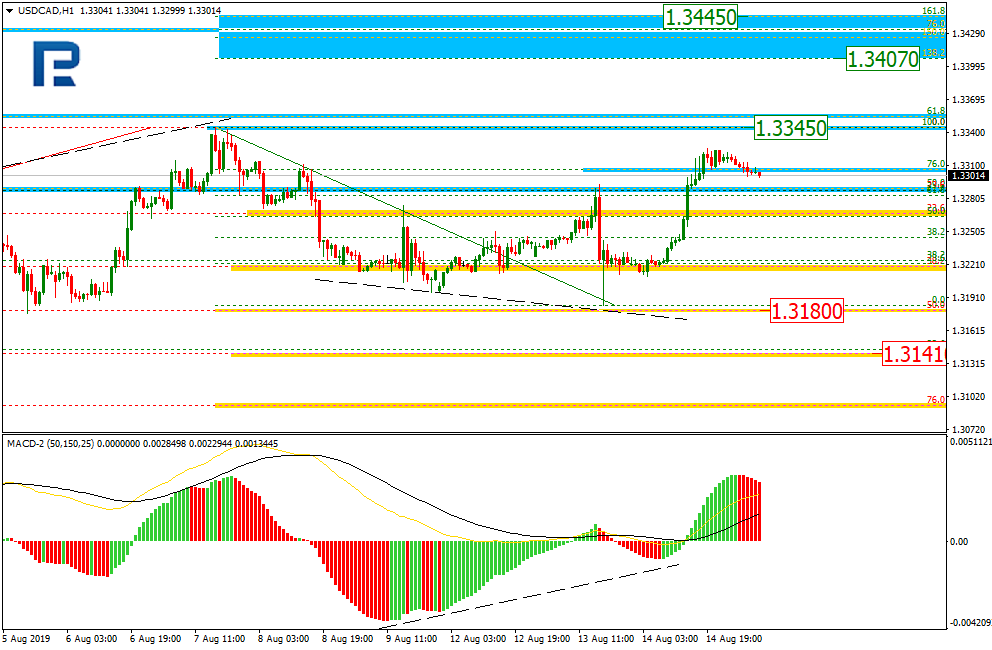
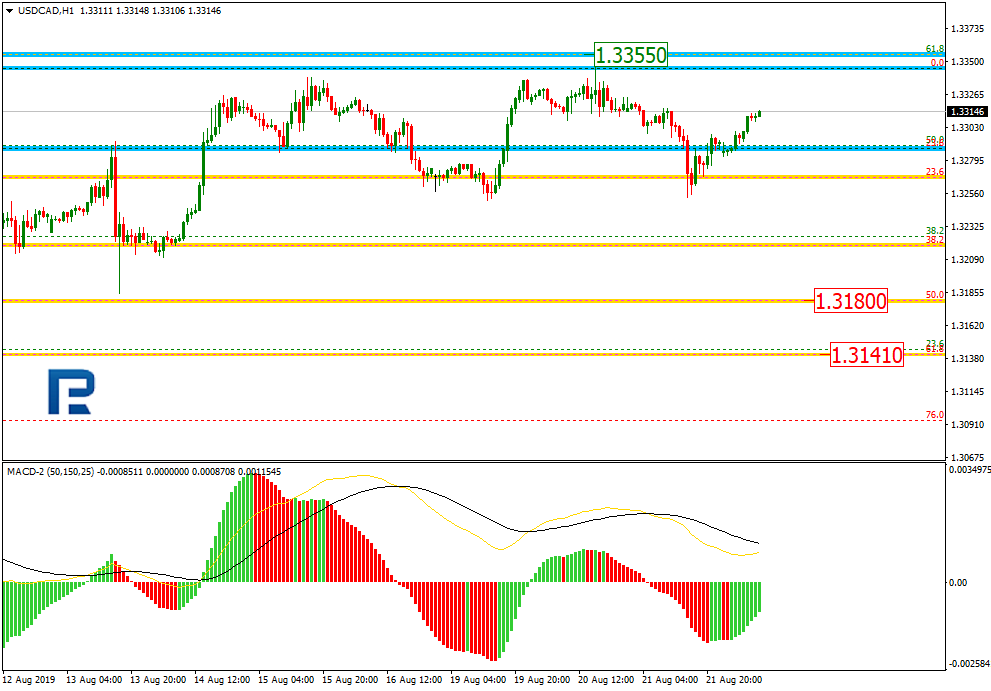
In the H1 chart, USDCAD is trading upwards to reach the high at 1.3345. If the price breaks the high in the nearest future, the instrument may continue growing towards the post-correctional extension area between 138.2% and 161.8% fibo at 1.3407 and 1.3445 respectively.
Forecasts presented in this section only reflect the author’s private opinion and should not be considered as guidance for trading. RoboForex bears no responsibility for trading results based on trading recommendations described in these analytical reviews.
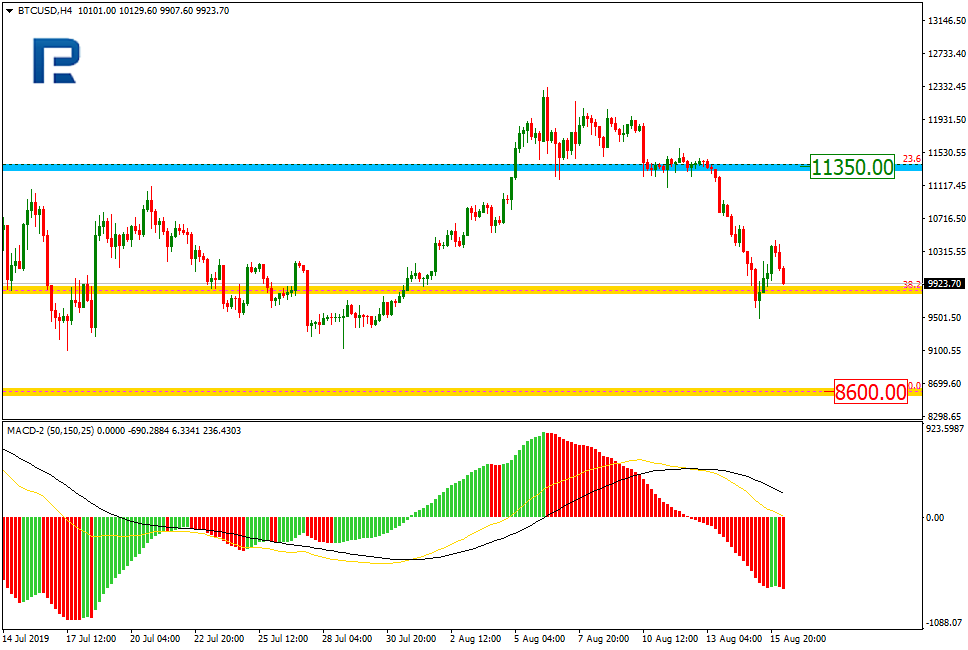
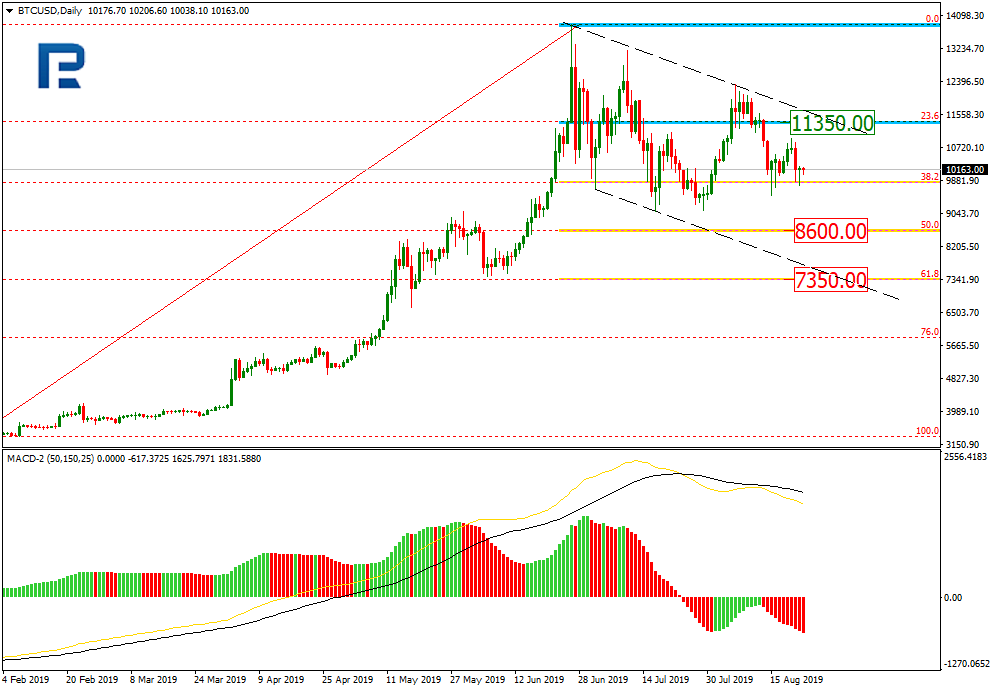
As we can see in the daily chart, after testing 23.6% fibo at 11350.00, BTCUSD failed to continue this rising impulse and started a new descending wave towards 50.0% and 61.8% fibo at 8600.00 and 7350.00 respectively.
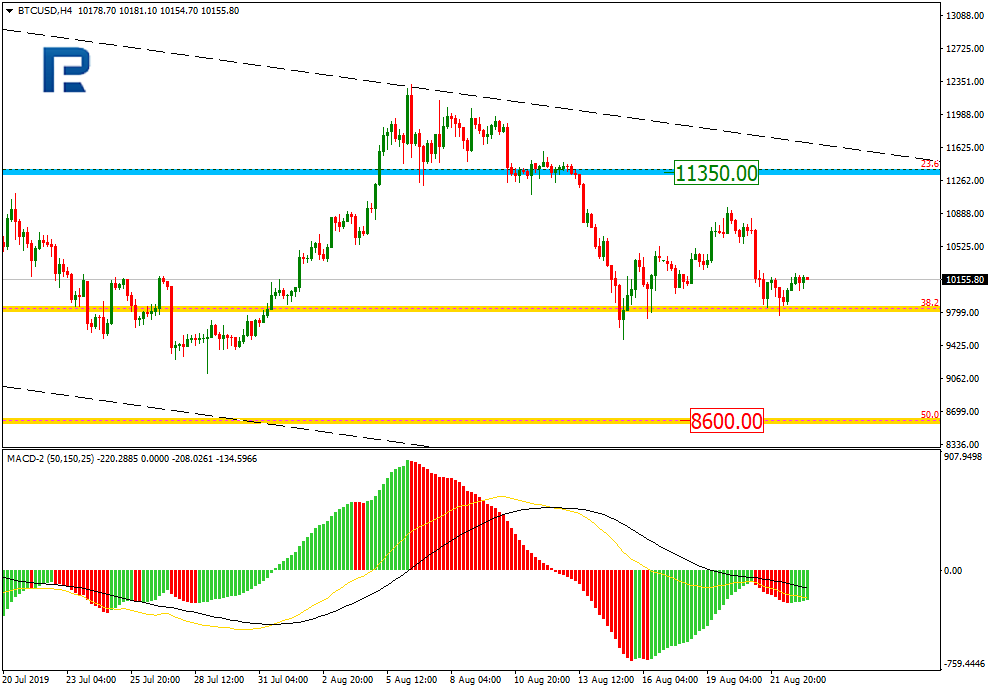
In the H4 chart, the pair is about to complete the short-term pullback, which may be followed by a new descending impulse to reach 50.0% fibo at 8600.00. The resistance is at 11350.00.
ETHUSD, “Ethereum vs. US Dollar”
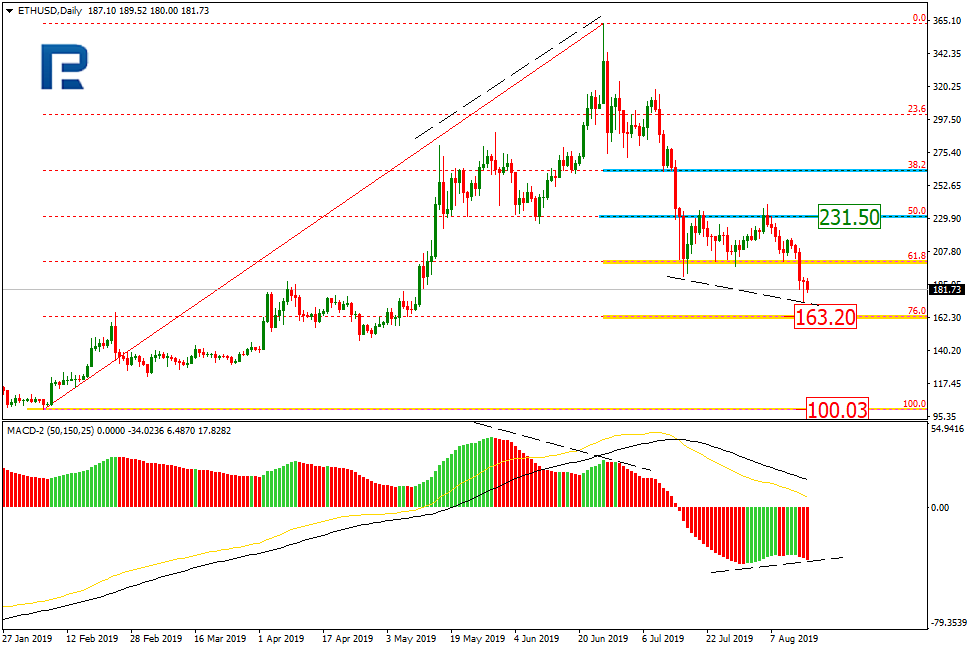
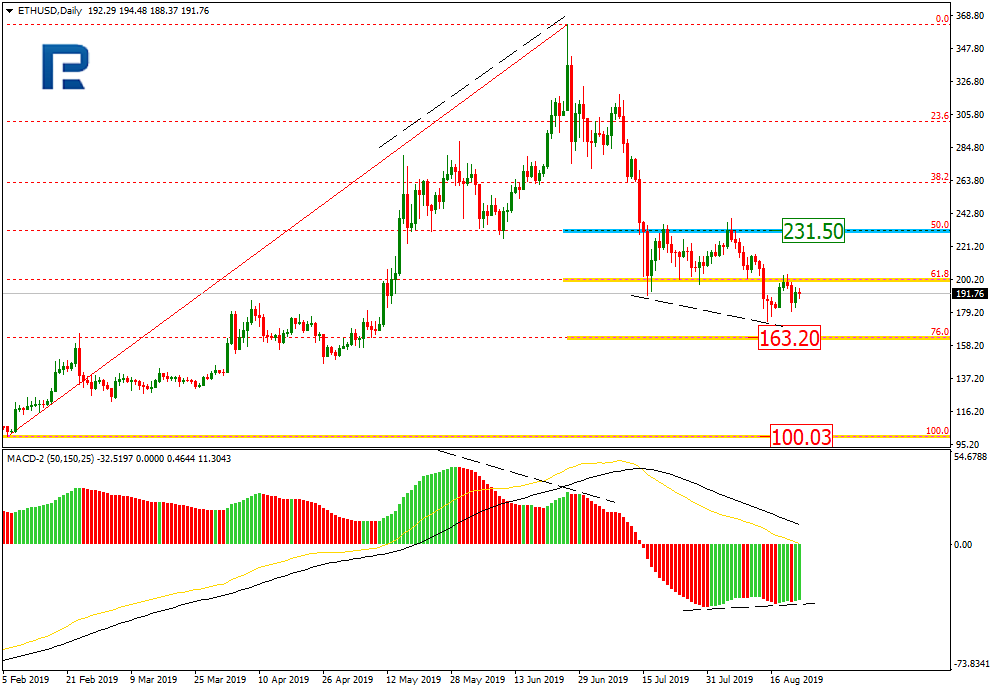
As we can see in the daily chart, after testing 50.0% and 61.8% fibo, ETHUSD started forming a new descending impulse; the target is 76.0% fibo at 163.20. At the same time, there is a convergence, which may indicate a possible pullback. The resistance is 50.0% fibo at 231.50.
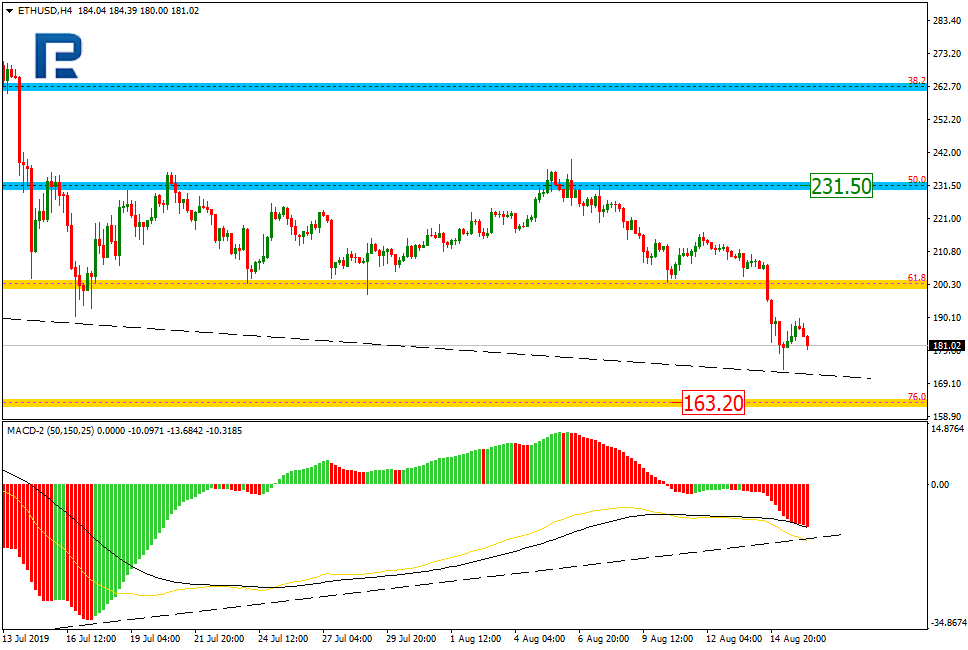
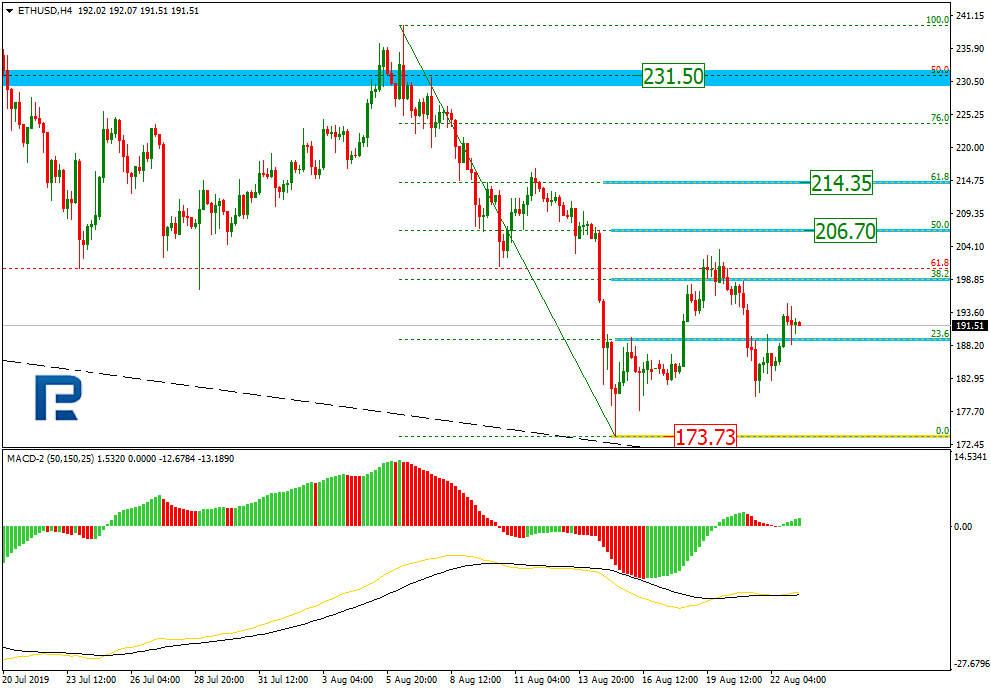
In the H4 chart, the instrument is quickly falling and getting closer to 76.0% fibo at 163.20.
Forecasts presented in this section only reflect the author’s private opinion and should not be considered as guidance for trading. RoboForex bears no responsibility for trading results based on trading recommendations described in these analytical reviews.
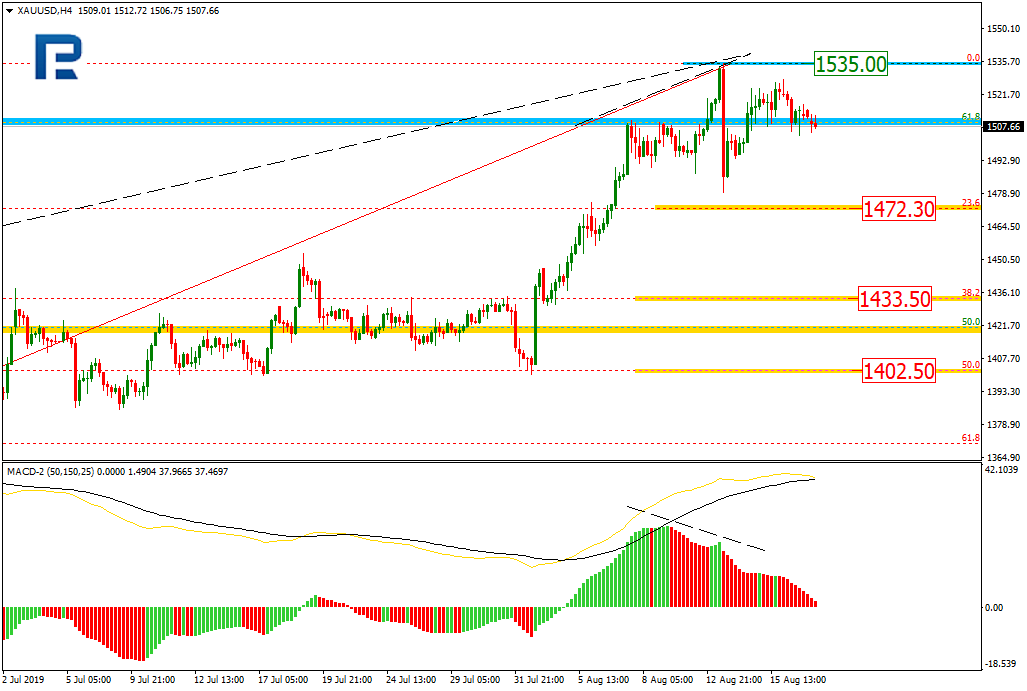
On H4, the instrument has formed two divergences upon reaching the long-term level of 61.8%: a long-term divergence and a short-term one. A stable decline to the levels of 23.6% (1472.30), 38.2% (1433.50) and 50.0% (1402.50) may follow, judging by the situation. The resistance is at the maximum of 1535.00.
On H1, the quotations return to the long-term level of 61.8% Fibo after a swift impuse of descending. The closest aim of the new impulse may be at 23.6% (1472.30) Fibo.
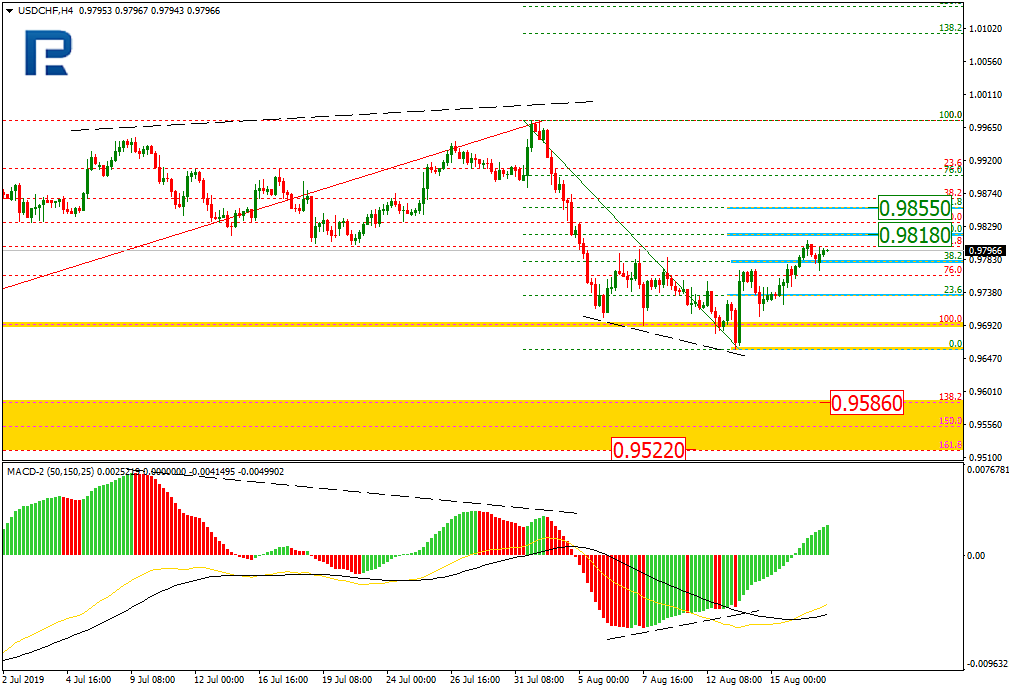
USDCHF
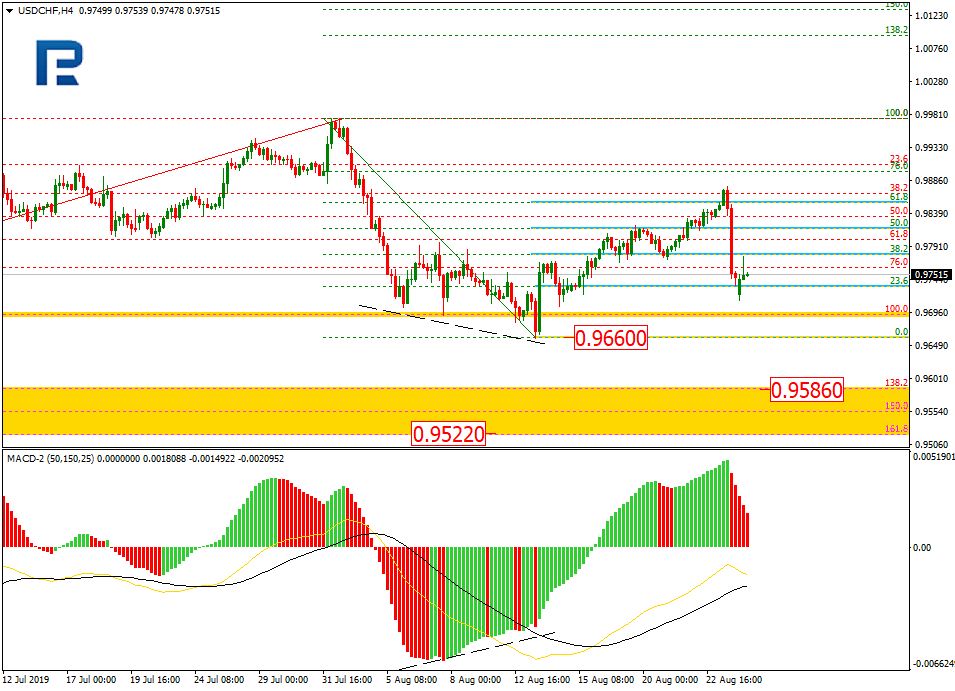
On H4, the instrument is developing a correction phase after testing the significant minimum, and a convergence. The correction has reached 38.2% Fibo by now. Further growth may aim at 50.0% (0.9818) and 61.8% (0.9855). A breakaway of the local minimum may be followed by a decline to a post-correctional extension of 138.2-161.8% (0.9586-0.9522).
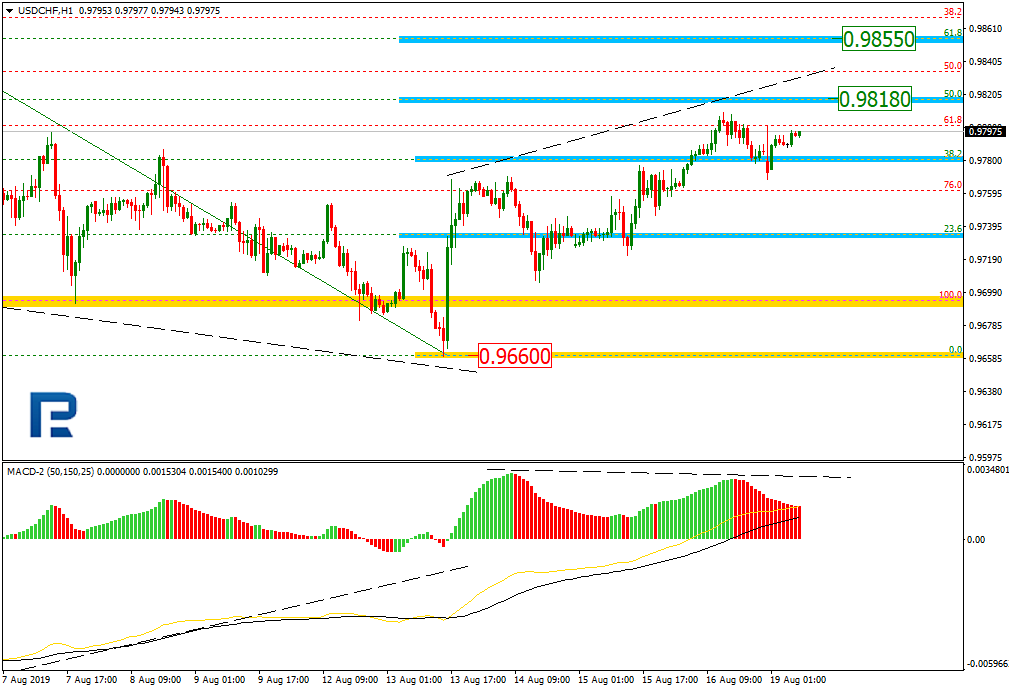
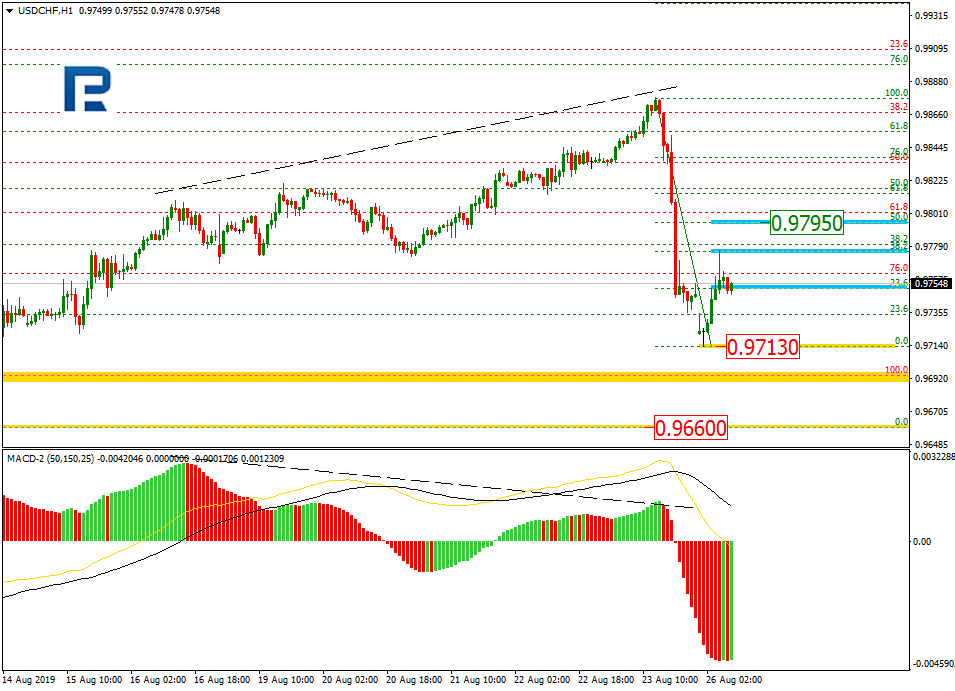
On H1 the pair is demonstrating an uptrend inside the previous declining wave. The growth is aiming at 50.0% (0.9818) Fibo; at the same time, a local divergence is forming, hinting on a potential for a reversal.
Forecasts presented in this section only reflect the author’s private opinion and should not be considered as guidance for trading. RoboForex bears no responsibility for trading results based on trading recommendations described in these analytical reviews.
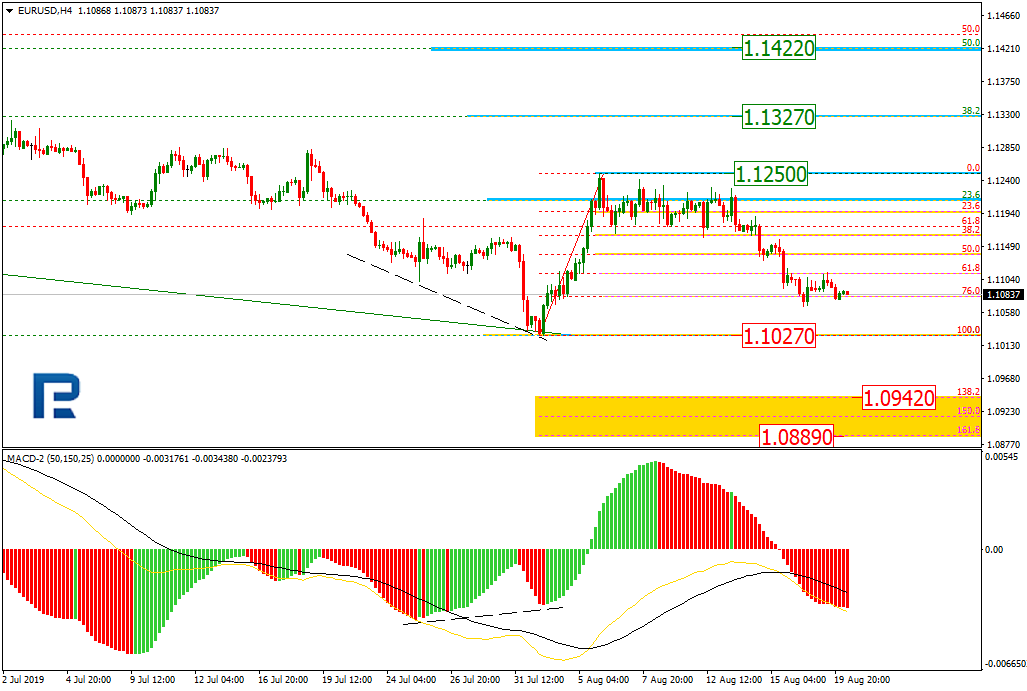
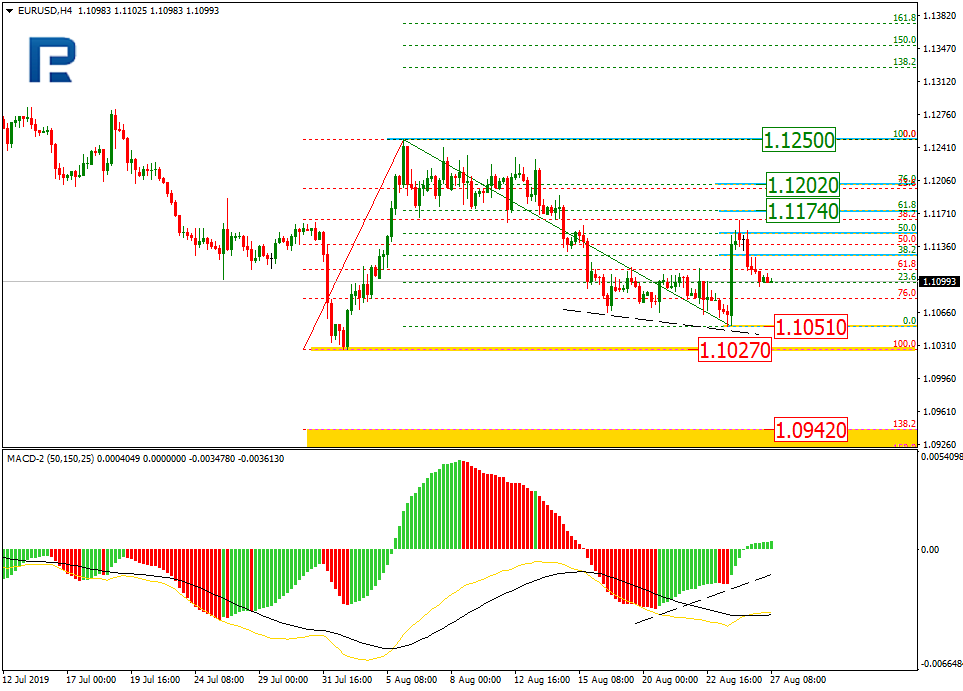
As we can see in the H4 chart, EURUSD has reached a very significant correctional level, 76.0% fibo and may continue falling towards the lows at 1.1027. After breaking the low, the price may continue trading towards the post-correctional extension area between 138.2% and 161.8% fibo at 1.0942 and 1.0889 respectively. Another scenario implies that the pair may start a new rising wave without breaking the low. In this case, the ascending correction may continue towards 38.2% and 50.0% fibo at 1.1327 and 1.1422 respectively.
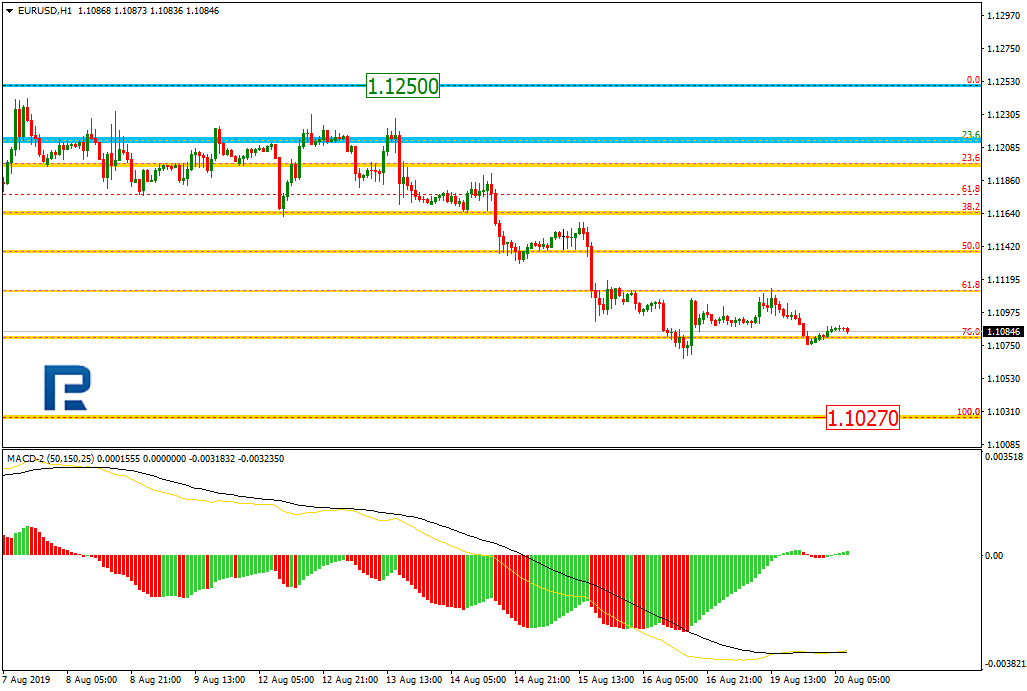
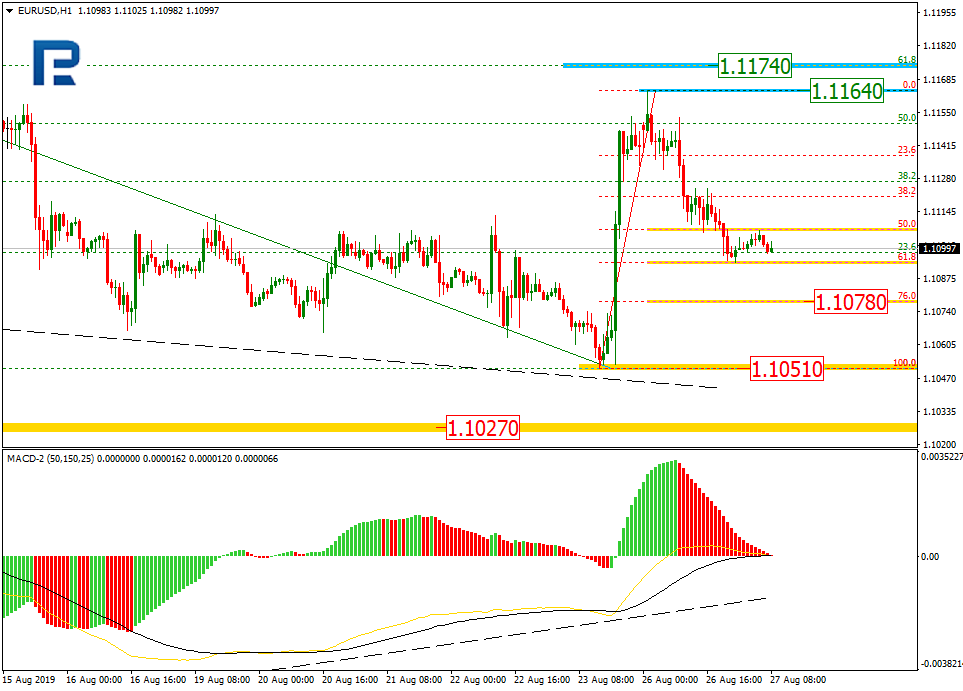
In the H1 chart, the downtrend is slowing down at 76.0% fibo, but it may be just a local pullback. The resistance is at 50.0% fibo.
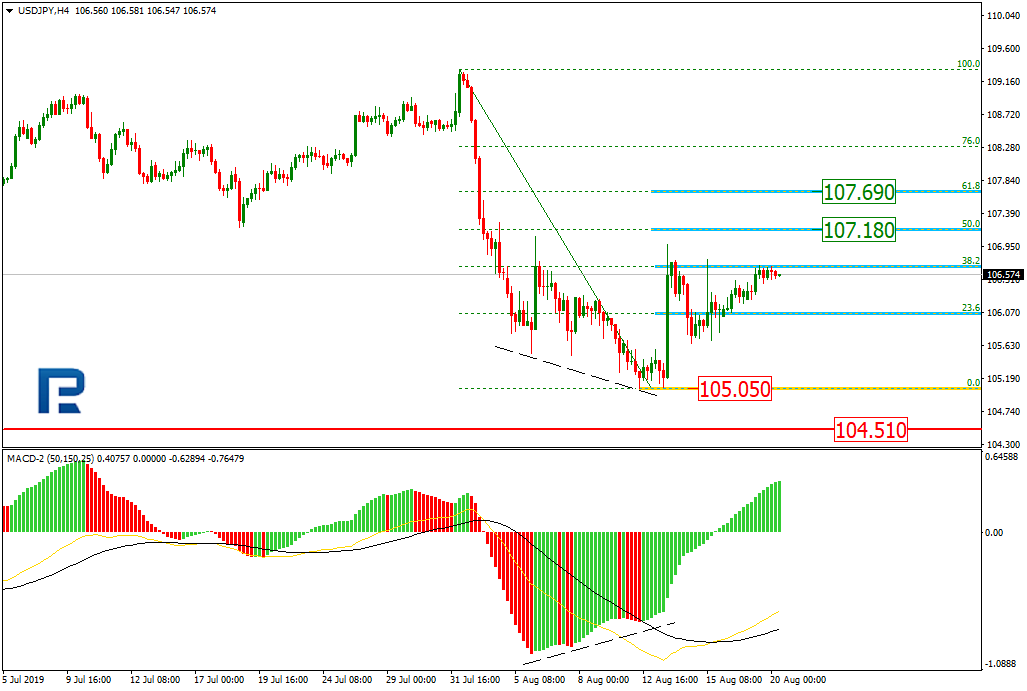
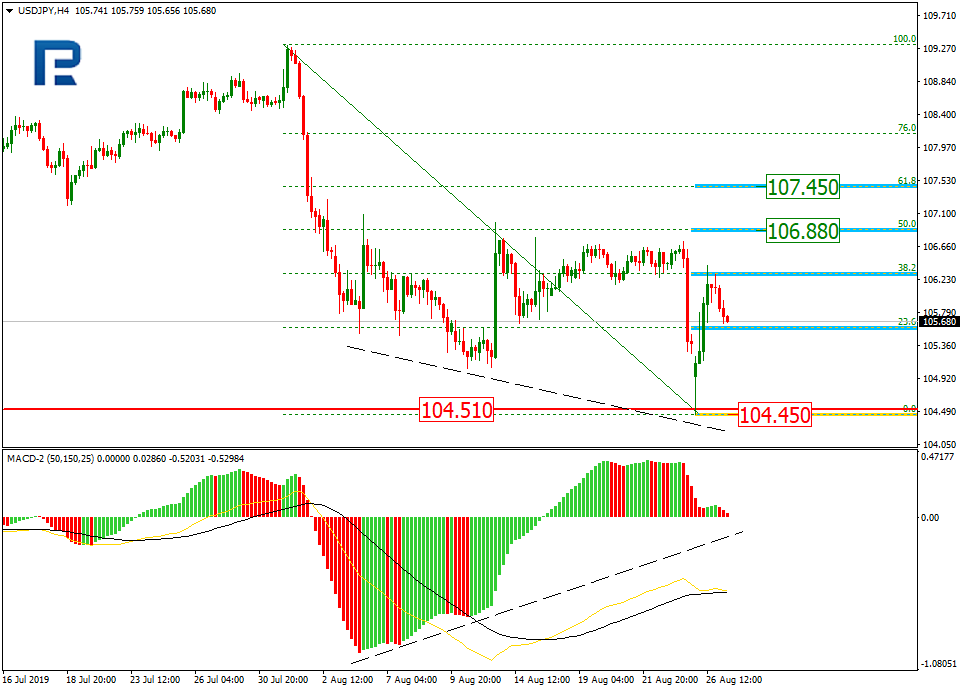
USDJPY, “US Dollar vs. Japanese Yen”
As we can see in the H4 chart, the pair is being corrected to the upside and has already reached 38.2% fibo. In the future, the correction may continue towards 50.0% and 61.8% fibo at 107.18 and 107.69 respectively. After finishing the correction, the price may resume falling to break the current low at 105.05 and then continue moving downwards to reach the long-term low at 104.51.
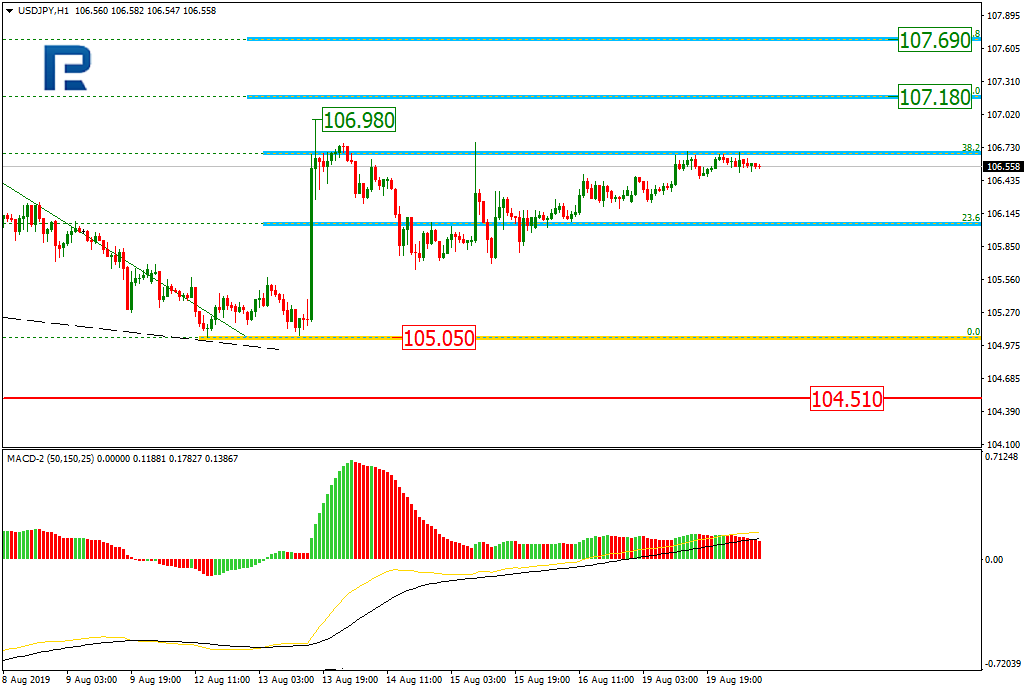
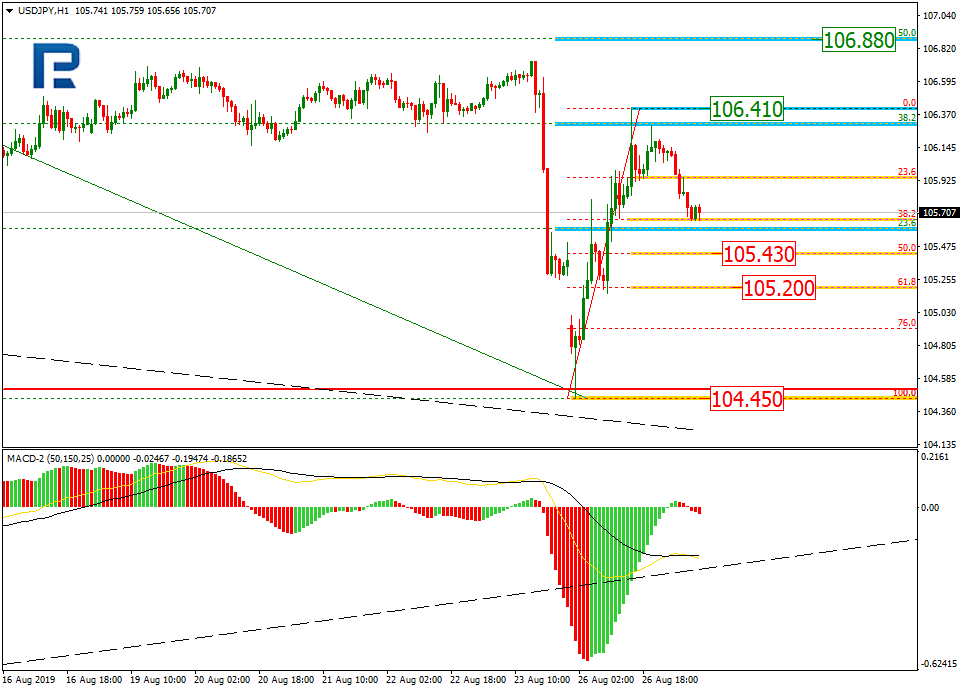
In the H1 chart, USDJPY is growing towards the local high at 106.98. After breaking it, the instrument may trade towards 50.0% and 61.8% fibo at 107.18 and 107.69 respectively.
Forecasts presented in this section only reflect the author’s private opinion and should not be considered as guidance for trading. RoboForex bears no responsibility for trading results based on trading recommendations described in these analytical reviews.
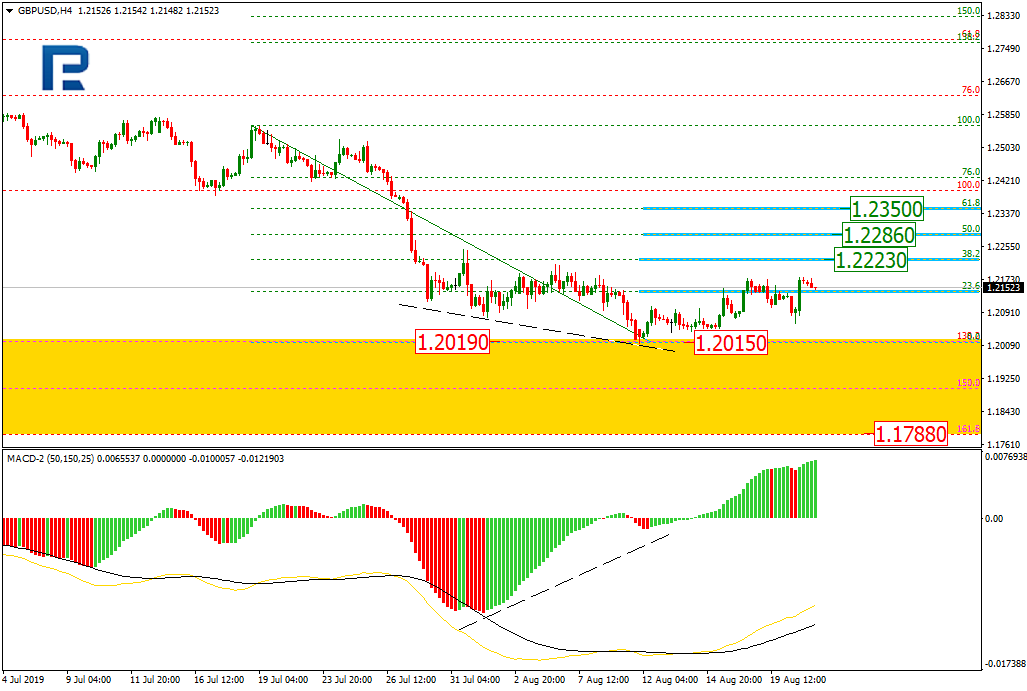
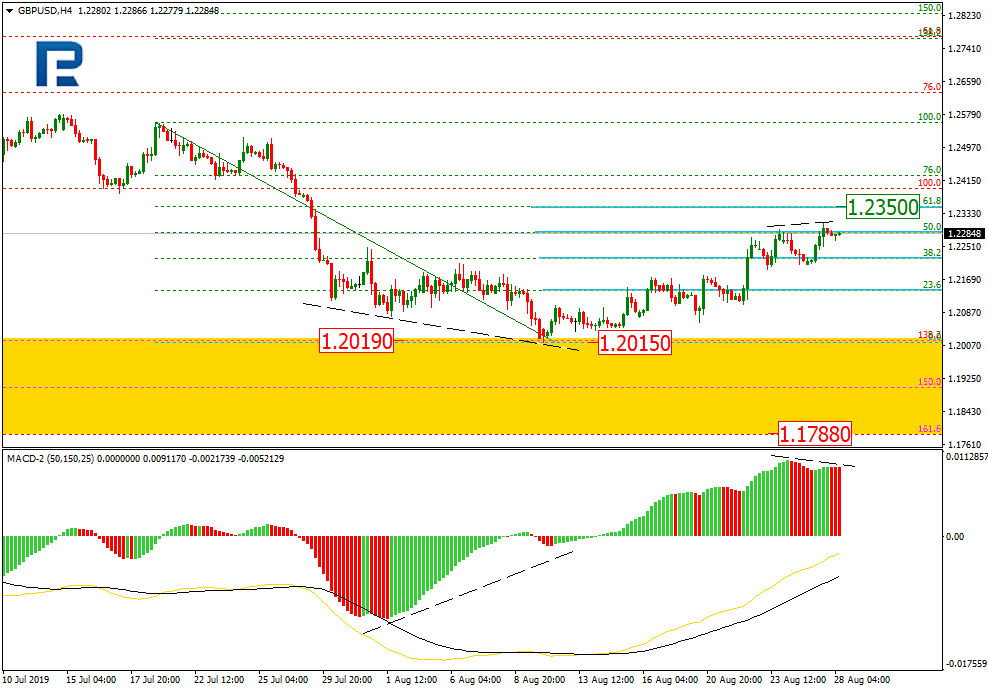
As we can see in the H4 chart, there was a convergence on MACD after the pair had reached the post-correctional extension area between 138.2% and 161.8% fibo at 1.2019 and 1.1788 respectively, which indicated a new pullback. By now, the pullback has reached 23.6% fibo and may continue towards 38.2%, 50.0%, and 61.8% fibo at 1.2230, 1.2286, and 1.2350 respectively. The support is the low at 1.2015.
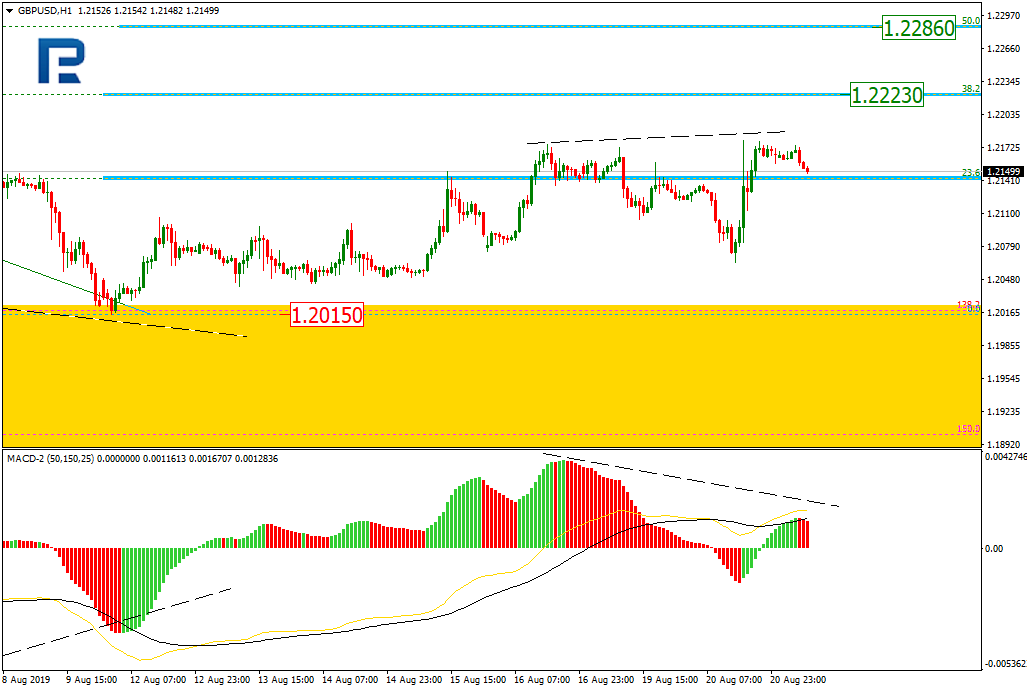
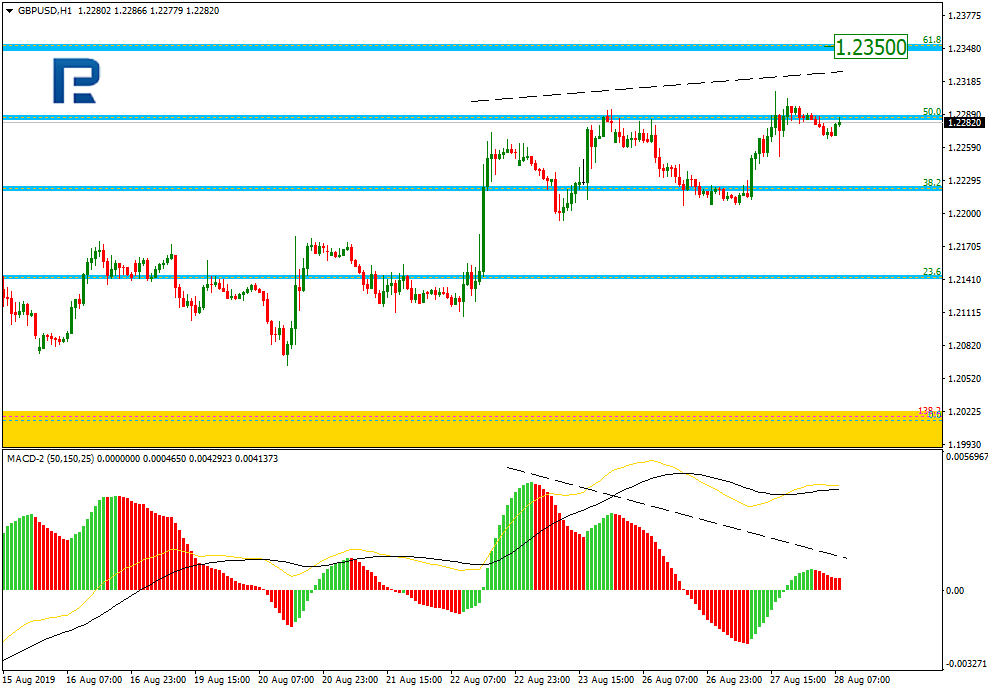
The short-term scenario is shown on the H1 chart. Here, there is a local convergence, which may indicate a slowdown in the correctional uptrend towards 38.2% and 50.0% fibo at 1.2223 and 1.2286 respectively.
EURJPY, “Euro vs. Japanese Yen”
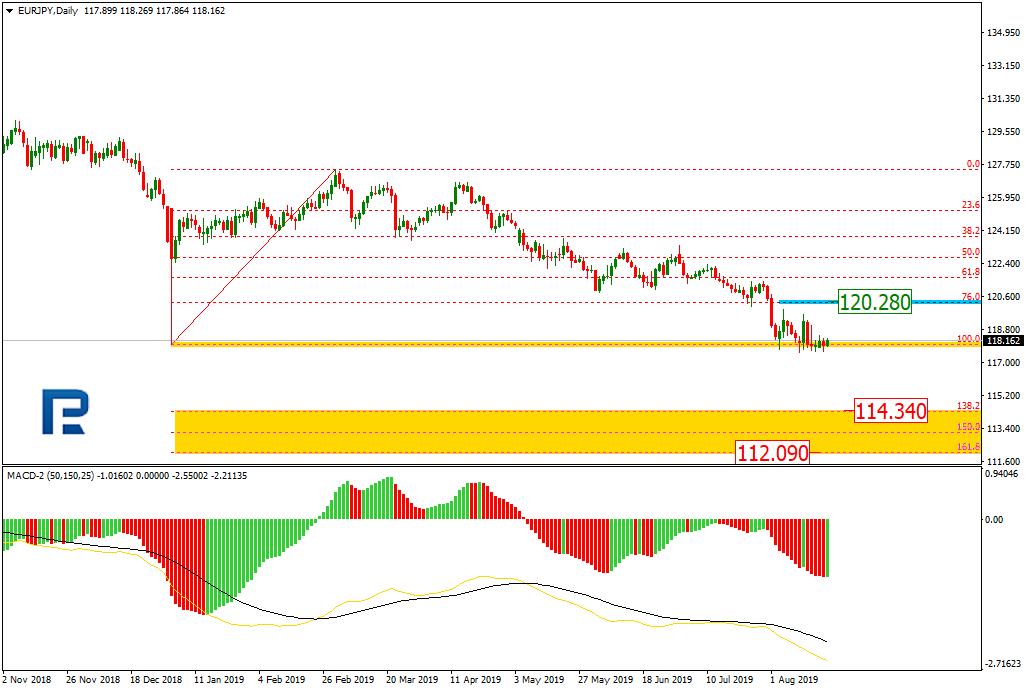
As we can see in the daily chart, EURJPY is still testing the long-term low again. After breaking the low and fixing below it, the descending tendency may continue towards the post-correctional extension area between 138.2% and 161.8% fibo at 114.34 and 112.09 respectively. The resistance is close to 76.0% fibo at 120.28.
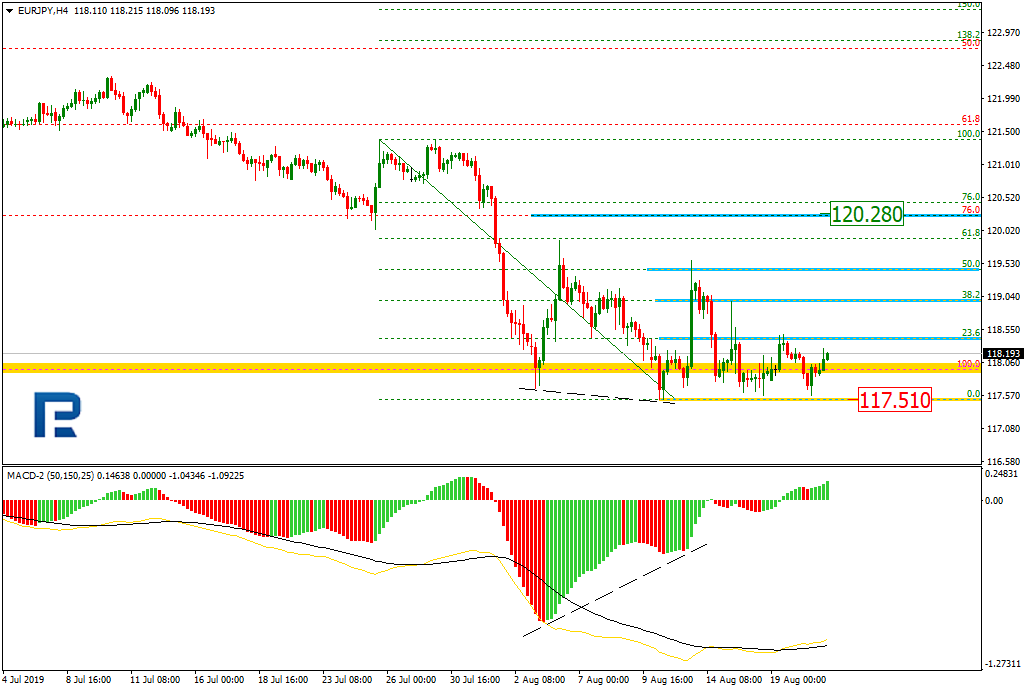
In the H4 chart, after being corrected to the upside by 50.0%, the pair is trading downwards to reach the low at 117.51.
Forecasts presented in this section only reflect the author’s private opinion and should not be considered as guidance for trading. RoboForex bears no responsibility for trading results based on trading recommendations described in these analytical reviews.
As we can see in the H4 chart, the convergence made AUDUSD start a new pullback, which was very close to 38.2% fibo at 0.6831 several times, but hasn’t reached it yet. Right now, the pair consolidating. As it is known, the longer the consolidation, the stronger the breakout of the range. That’s why, after breaking this level, the pair may quickly reach 50.0% fibo at 0.6880. When the correction is over, the instrument is expected to break the local support at 0.6677 and then continue falling to reach the long-term low at 0.6547.
The H1 chart shows more detailed structure of the current consolidating channel. AUDUSD is trading close to 23.6% fibo.
USDCAD, “US Dollar vs Canadian Dollar”
As we can see in the H4 chart, after reaching 50.0% fibo at 1.3180, USDCAD has rebounded towards the high. If the pair breaks it, the price may continue trading to reach mid-term 61.8% and 76.0% fibo at 1.3355 and 1.3433 respectively. Otherwise, the instrument may resume falling towards 50.0%, 61.8%, and 76.0% fibo at 1.3180, 1.3141, and 1.3095 respectively.
In the H1 chart, USDCAD is forming a new pullback after testing the high.
Forecasts presented in this section only reflect the author’s private opinion and should not be considered as guidance for trading. RoboForex bears no responsibility for trading results based on trading recommendations described in these analytical reviews.
As we can see in the daily chart, BTCUSD has tested 38.2% fibo again. The previous rising impulse couldn’t continue moving towards the high. The resistance is 23.6% fibo at 11350.00. Judging by MACD, the current decline may continue, that’s why after breaking its local lows, the instrument may fall towards 50.0% and 61.8% fibo at 8600.00 and 7350.00 respectively.
In the H4 chart, highs and lows are getting closer to each other, which means that the pair is consolidating. Possibly, the price may grow to reach 23.6% fibo at 11350.00 again in the nearest future. However, the major tendency remains descending.
ETHUSD, “Ethereum vs. US Dollar”
As we can see in the daily chart, the convergence made the pair start a new pullback, which has quickly reached 61.8% and 76.0% fibo. The resistance is 50.0% fibo at 231.50, which may be the target of the correction. The target of the next impulse may be 76.0% fibo at 163.20).
In the H4 chart, the instrument is being corrected to the upside; the first correctional wave has already reached 38.2% fibo. The next targets may be 50.0% and 61.8% fibo at 206.70 and 214.35 respectively.
Forecasts presented in this section only reflect the author’s private opinion and should not be considered as guidance for trading. RoboForex bears no responsibility for trading results based on trading recommendations described in these analytical reviews.
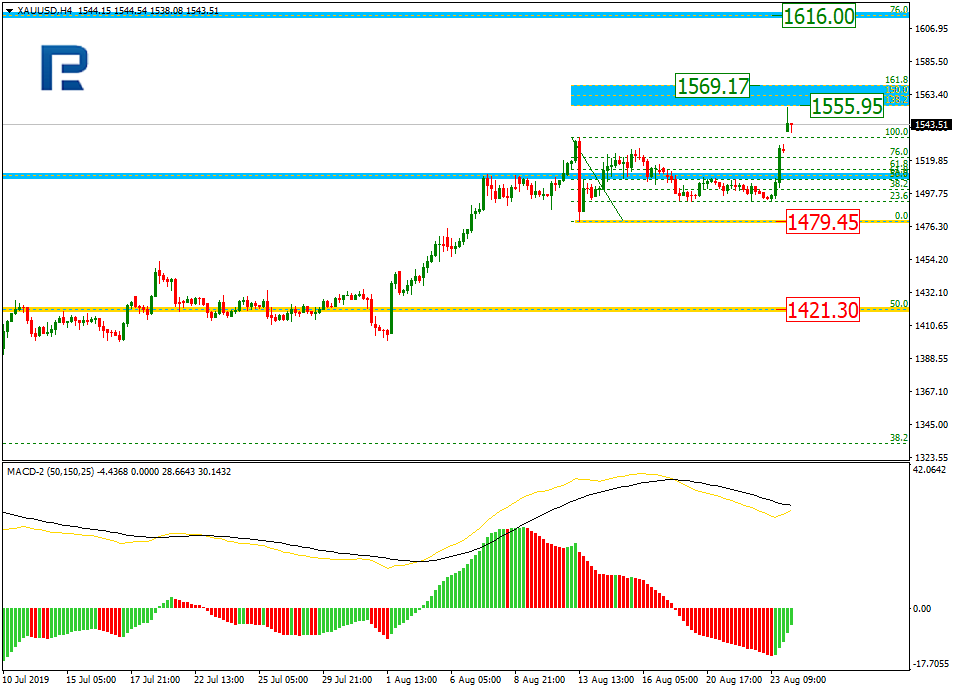
In the H4 chart, after completing a slight correction and breaking the previous high, XAUUSD is still trading upwards. The short-term targets are inside the post-correctional extension area between 138.2% and 161.8% fibo at 1555.95 and 1569.27 respectively; the long-term target is 76.0% fibo at 1616.45. The local support is the low at 1479.45.
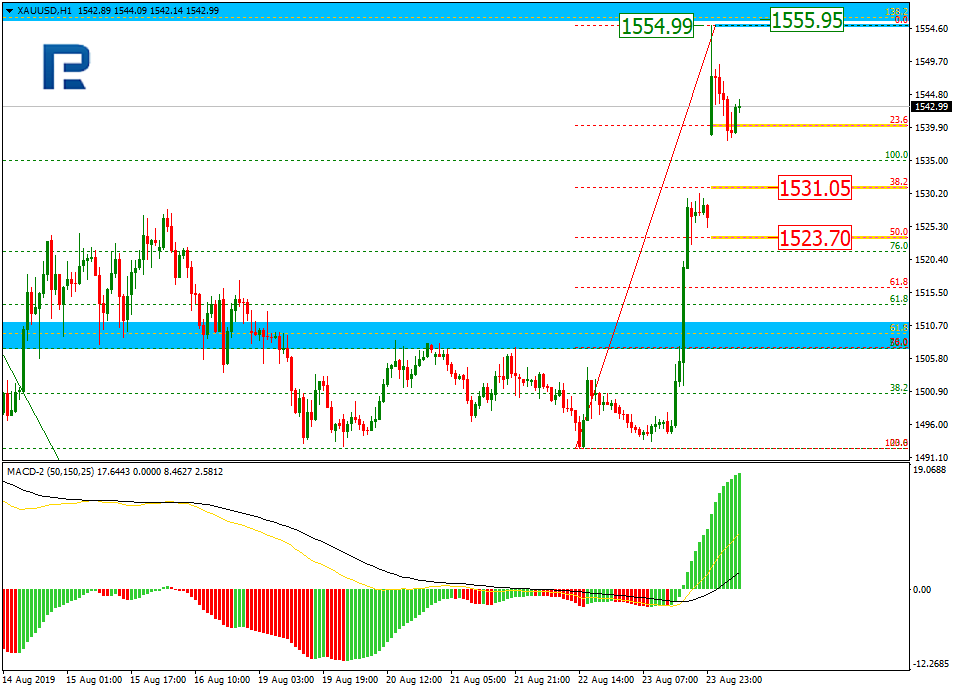
As we can see in the H1 chart, there was a gap at the beginning of today’s trading session and the pair started a new short-term pullback, which has already reached 23.6% fibo. The next downside targets may be 38.2% and 50.0% fibo at 1531.05 and 1523.70 respectively. If the price breaks the local high at 1554.99, the uptrend will continue.
USDCHF, “US Dollar vs Swiss Franc”
As we can see in the H4 chart, the previous correctional uptrend has reached 61.8% fibo; right now, the price is falling towards the low at 0.9660. After breaking the low, the instrument may continue falling towards the post-correctional extension area between 138.2% and 161.8% fibo at 0.9586 and 0.9522 respectively.
In the H1 chart, after finishing the descending impulse, USDCHF is being corrected to the upside; it has already reached 38.2% fibo and may yet continue towards 50.0% fibo at 0.9795. The support is the low at 0.9713.
Forecasts presented in this section only reflect the author’s private opinion and should not be considered as guidance for trading. RoboForex bears no responsibility for trading results based on trading recommendations described in these analytical reviews.
In the H4 chart, after completing a slight correction and breaking the previous high, XAUUSD is still trading upwards. The short-term targets are inside the post-correctional extension area between 138.2% and 161.8% fibo at 1555.95 and 1569.27 respectively; the long-term target is 76.0% fibo at 1616.45. The local support is the low at 1479.45.
As we can see in the H1 chart, there was a gap at the beginning of today’s trading session and the pair started a new short-term pullback, which has already reached 23.6% fibo. The next downside targets may be 38.2% and 50.0% fibo at 1531.05 and 1523.70 respectively. If the price breaks the local high at 1554.99, the uptrend will continue.
USDCHF, “US Dollar vs Swiss Franc”
As we can see in the H4 chart, the previous correctional uptrend has reached 61.8% fibo; right now, the price is falling towards the low at 0.9660. After breaking the low, the instrument may continue falling towards the post-correctional extension area between 138.2% and 161.8% fibo at 0.9586 and 0.9522 respectively.
In the H1 chart, after finishing the descending impulse, USDCHF is being corrected to the upside; it has already reached 38.2% fibo and may yet continue towards 50.0% fibo at 0.9795. The support is the low at 0.9713.
Forecasts presented in this section only reflect the author’s private opinion and should not be considered as guidance for trading. RoboForex bears no responsibility for trading results based on trading recommendations described in these analytical reviews.
As we can see in the H4 chart, the convergence made EURUSD start a new rising impulse, which reached 50.0% fibo and was later followed by a pullback. After completing this pullback, the pair may continue growing towards 61.8% and 76.0% fibo at 1.1174 and 1.1202 respectively. The key target of this rising impulse will be the high at 1.1250. However, we shouldn’t ignore a possibility that the instrument may yet break the local low at 1.1051. In this case, the price may continue falling towards the support at 1.1027 and the post-correctional extension area between 138.2% and 161.8% fibo at 1.0942 and 1.0889 respectively.
The H1 chart shows more detailed structure of the current pullback. EURUSD slowed down at 61.8% fibo, but may yet continue falling towards 76.0% fibo at 1.1078. The resistance is the local high at 1.1164.
USDJPY, “US Dollar vs. Japanese Yen”
As we can see in the H4 chart, after testing the long-term low at 104.51, USDJPY started a new correction due to the convergence and has already reached 38.2% fibo. In the future, the correction may continue towards 50.0% and 61.8% fibo at 106.88 and 107.45 respectively. The support is at 104.45.
In the H1 chart, USDJPY is correcting downwards after completing the rising wave. The pair has already reached 38.2% fibo and may continue falling towards 50.0% and 61.8% fibo at 105.43 and 105.20 respectively. If the price breaks the high at 106.41, the instrument may resume trading upwards.
Forecasts presented in this section only reflect the author’s private opinion and should not be considered as guidance for trading. RoboForex bears no responsibility for trading results based on trading recommendations described in these analytical reviews.
As we can see in the H4 chart, the correctional uptrend is heading towards 61.8% fibo at 1.2350. After completing the correction, GBPUSD may form a new descending structure to reach the support at 1.2015. The mid-term downside targets are inside the post-correctional extension area between 138.2% and 161.8% fibo at 1.2019 and 1.1788 respectively.
More detailed structure of the current correction is shown on the H1 chart. Right now, the pair is re-testing 50.0% fibo. Later, the market may continue moving towards 61.8% fibo at 1.2350. At the same time, there is a divergence within the uptrend on MACD, which may indicate a forthcoming reverse.
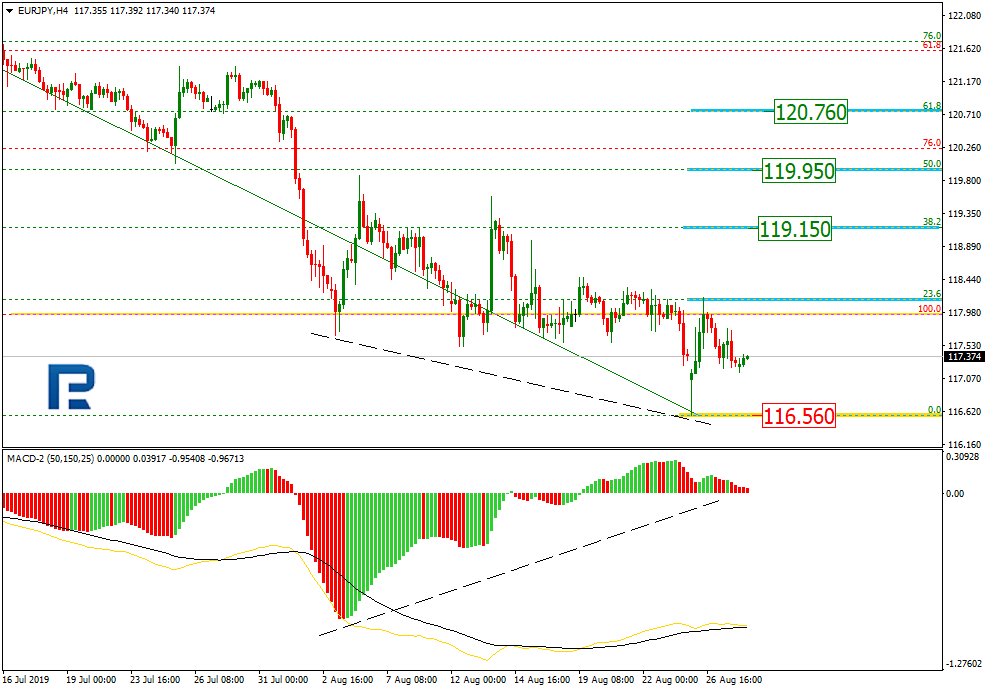
EURJPY, “Euro vs. Japanese Yen”
As we can see in the H4 chart, after EURJPY broke the significant low, there was a convergence on MACD, which was later followed by the first correctional impulse towards 23.6% fibo. The next correctional targets may be 38.2%, 50.0%, and 61.8% fibo at 119.15, 119.95, and 120.76 respectively. The support is at 116.56.
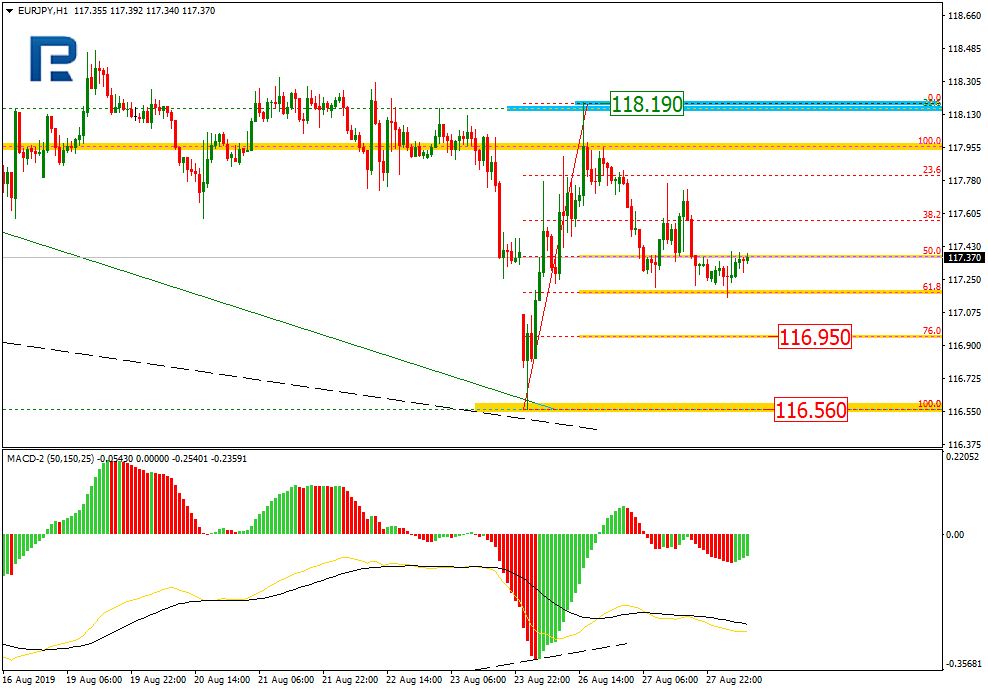
In the H1 chart, after completing the rising impulse, the pair is correcting to the downside and has already reached 61.8% fibo. Later, the market may continue the correction towards 76.0% fibo at 116.95.
Forecasts presented in this section only reflect the author’s private opinion and should not be considered as guidance for trading. RoboForex bears no responsibility for trading results based on trading recommendations described in these analytical reviews.