29.08.2019
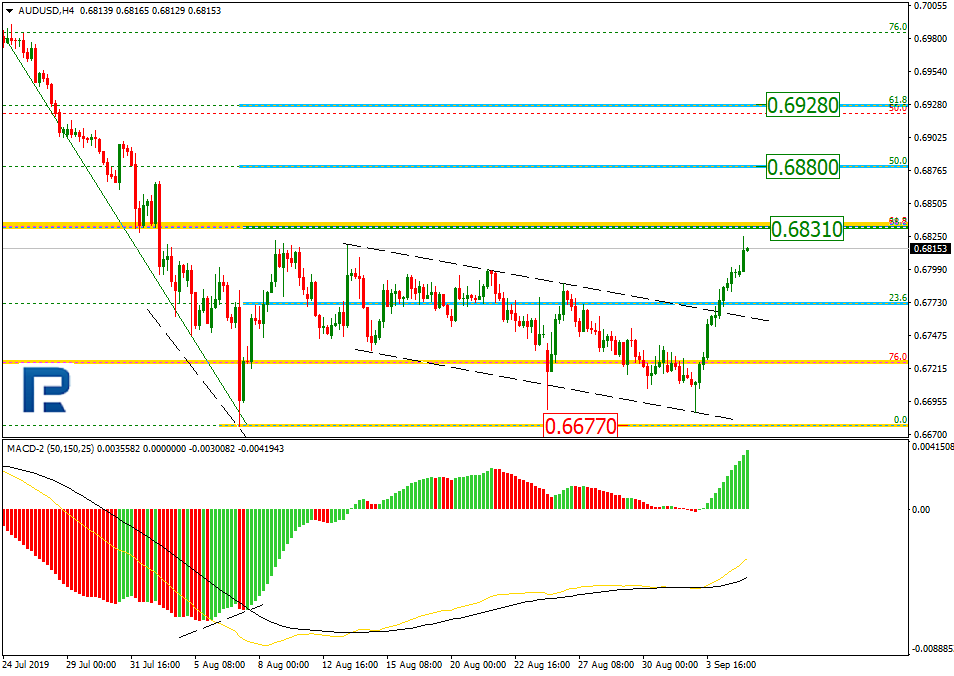
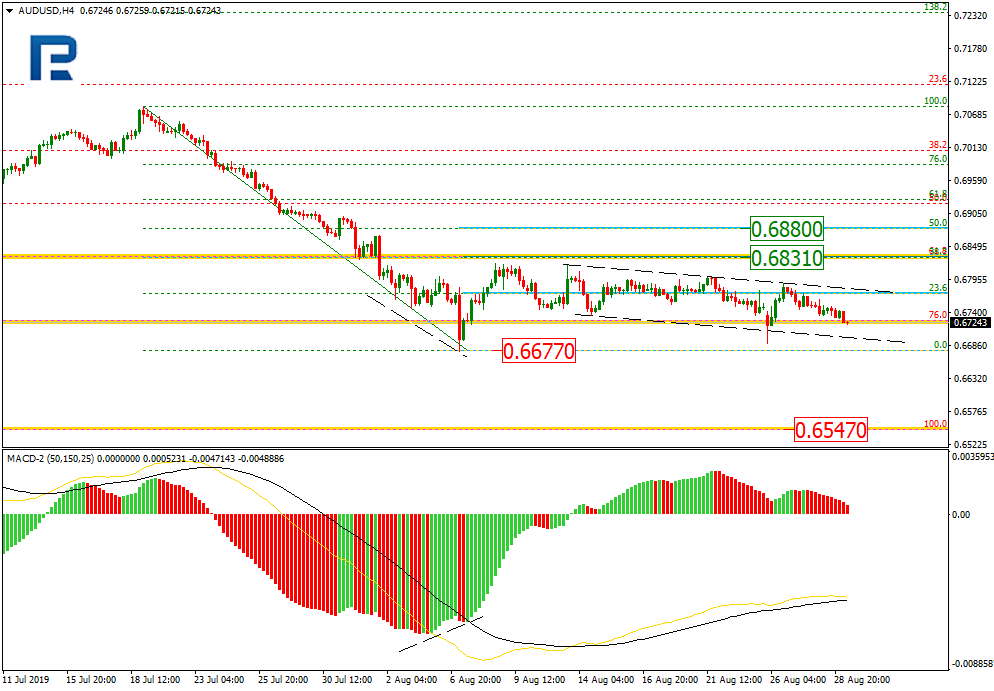
AUDUSD, “Australian Dollar vs US Dollar”
As we can see in the H4 chart, AUDUSD is trying to start a new decline, but the correction continues. The pair tested 23.6% fibo several times, but couldn’t reach 38.2% fibo at 0.6831. After breaking the local support at 0.6677, the instrument may continue falling to reach the long-term low at 0.6547.

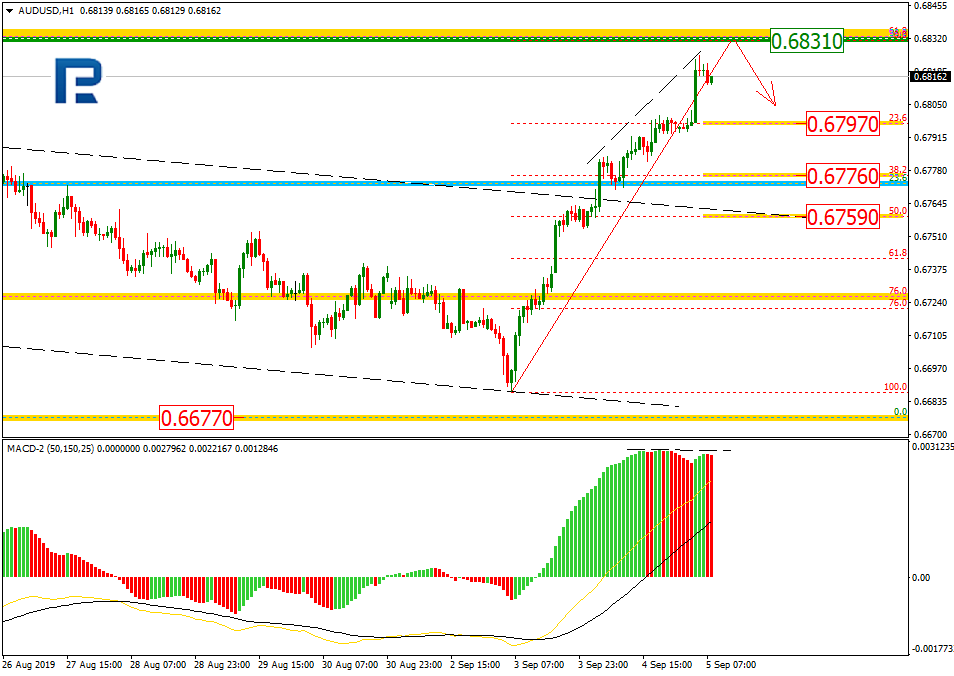
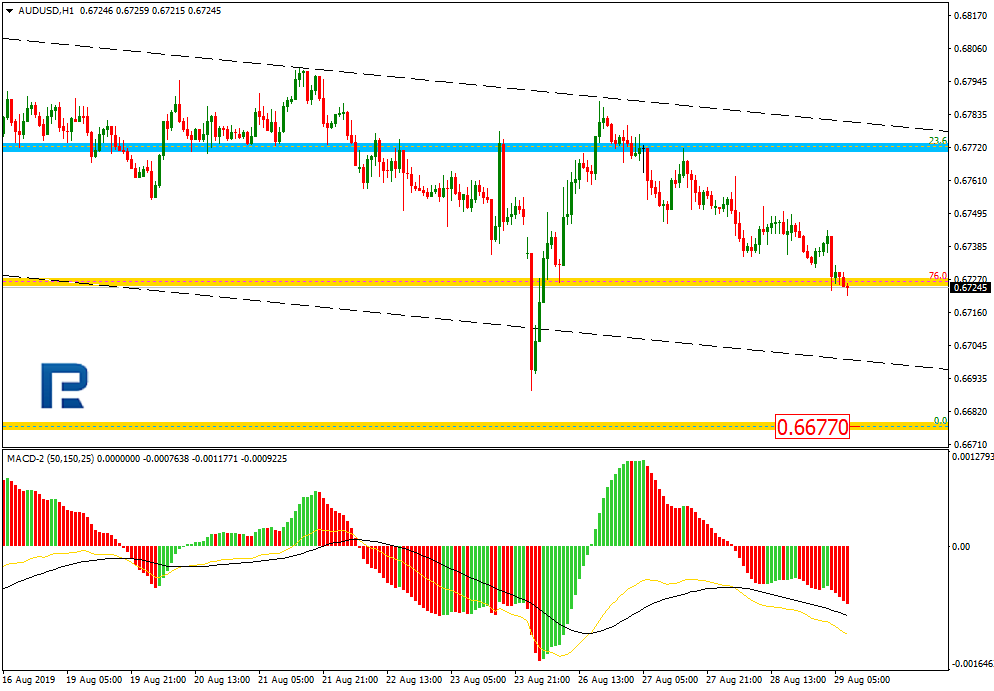
The H1 chart shows more detailed structure of the current descending tendency. AUDUSD is heading towards the local low at 0.6677.
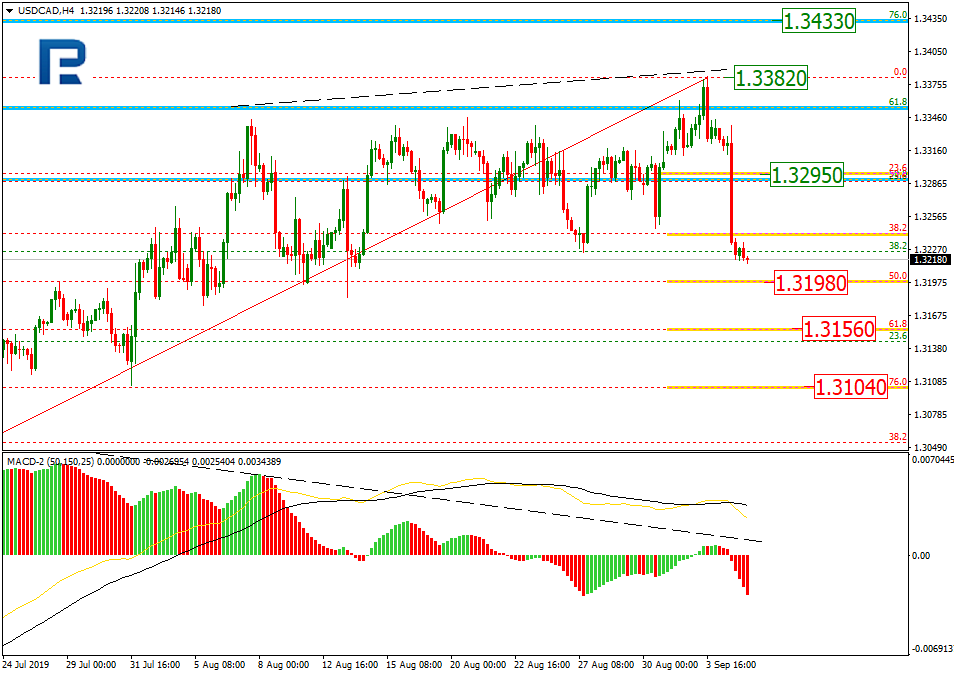
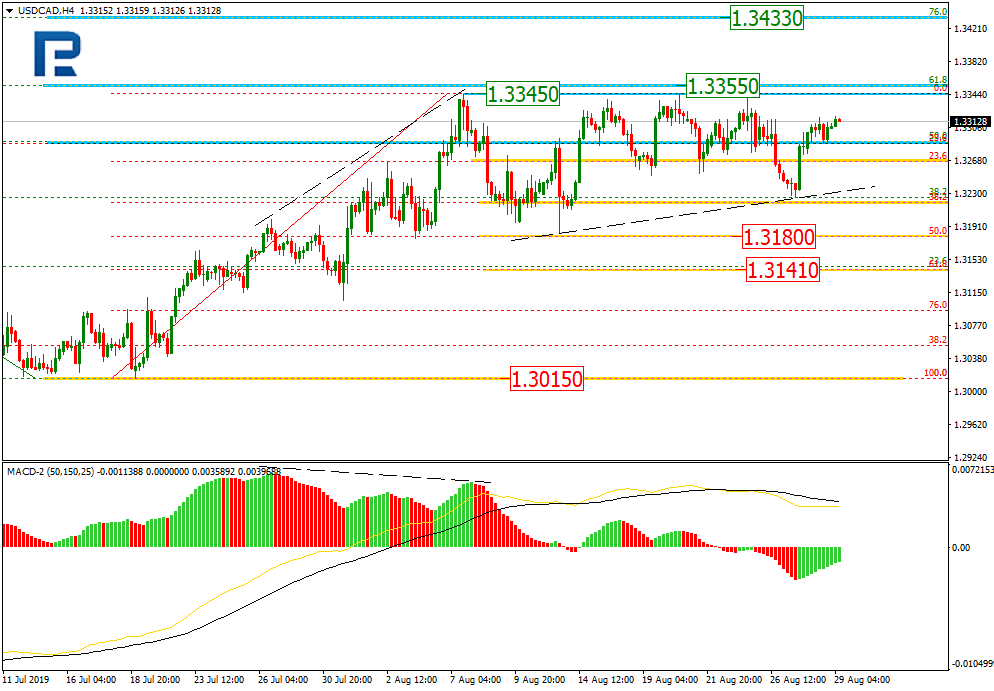
USDCAD, “US Dollar vs Canadian Dollar”
As we can see in the H4 chart, after testing 38.2% fibo again and rebounding from it, USDCAD is still forming the correctional channel in the form of Pennant, which may indicate a possible breakout of the high at 1.3345 and further growth towards mid-term 61.8% and 76.0% fibo at 1.3355 and 1.3433 respectively. Otherwise, the instrument may resume falling towards 50.0% and 61.8% fibo at 1.3180 and 1.3141 respectively.
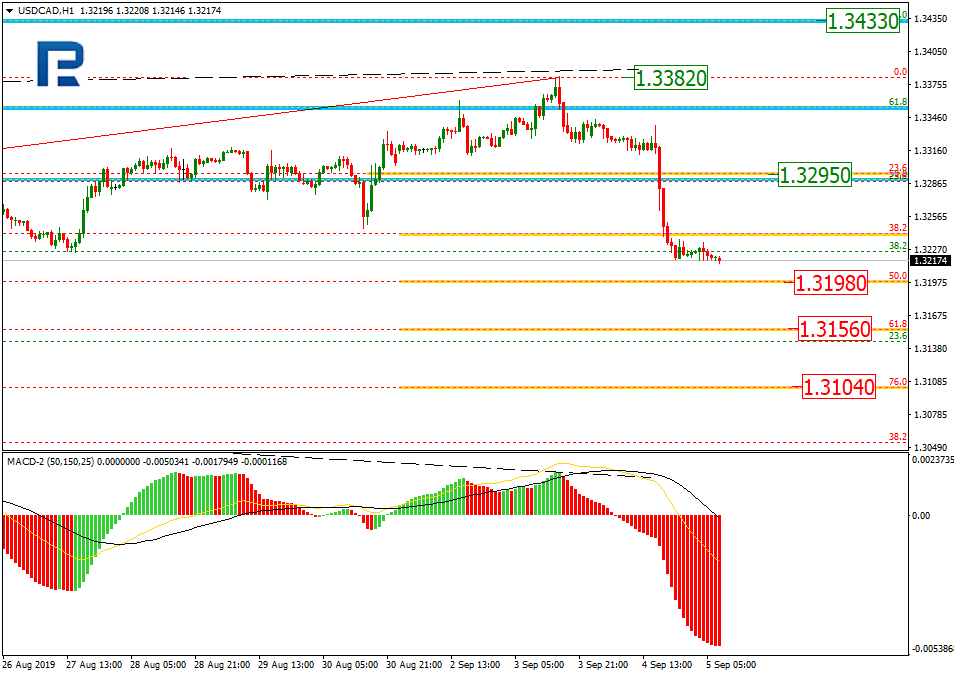
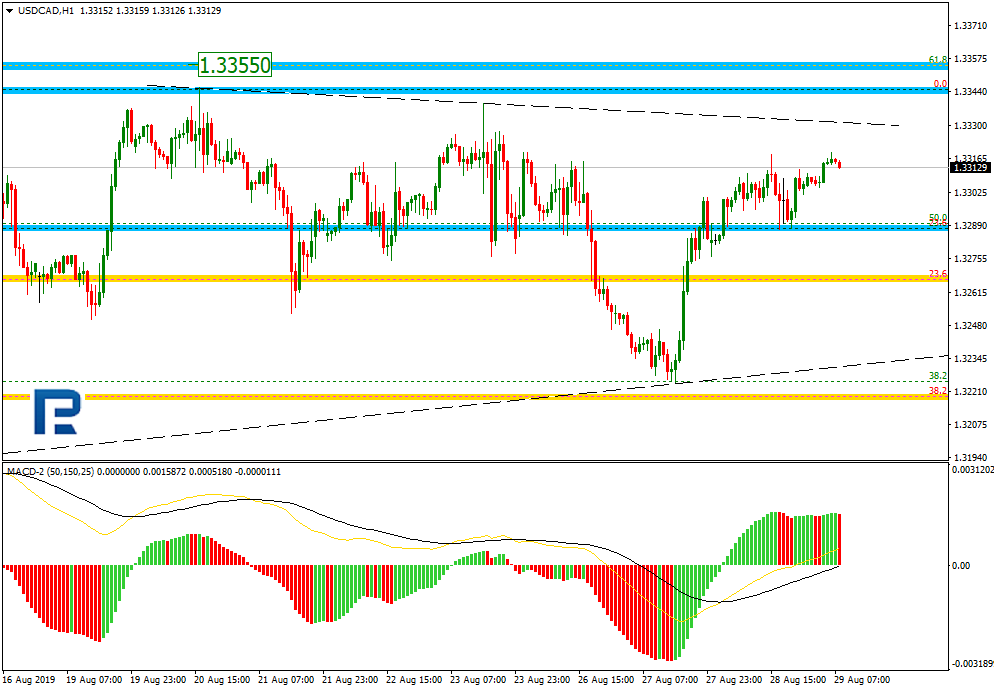
In the H1 chart, USDCAD has completed the rising impulse and may resume falling to test 38.2% fibo.
Back to listAttention!
Forecasts presented in this section only reflect the author’s private opinion and should not be considered as guidance for trading. RoboForex bears no responsibility for trading results based on trading recommendations described in these analytical reviews.