Ichimoku Cloud Analysis 26.11.2019 (AUDUSD, NZDUSD, USDCAD)

Ichimoku Cloud Analysis 26.11.2019 (AUDUSD, NZDUSD, USDCAD)

26.11.2019

AUDUSD, “Australian Dollar vs US Dollar”

AUDUSD is trading at 0.6780; the instrument is moving below Ichimoku Cloud, thus indicating a descending tendency. The markets could indicate that the price may test the cloud’s downside border at 0.6790 and then resume moving downwards to reach 0.6670. Another signal to confirm further descending movement is the price’s rebounding from the resistance level. However, the scenario that implies further decline may be canceled if the price breaks the cloud’s upside border and fixes above 0.6845. In this case, the pair may continue growing towards 0.6935.

AUDUSD
Risk Warning: the result of previous trading operations do not guarantee the same results in the future

NZDUSD, “New Zealand Dollar vs US Dollar”

NZDUSD is trading at 0.6420; the instrument is moving above Ichimoku Cloud, thus indicating an ascending tendency. The markets could indicate that the price may test the cloud’s downside border at 0.6385 and then resume moving upwards to reach 0.6535. Another signal to confirm further ascending movement is the price’s rebounding from the rising channel’s downside border. However, the scenario that implies further growth may be canceled if the price breaks the cloud’s downside border and fixes below 0.6345. In this case, the pair may continue falling towards 0.6265.

NZDUSD
Risk Warning: the result of previous trading operations do not guarantee the same results in the future

USDCAD, “US Dollar vs Canadian Dollar”

USDCAD is trading at 1.3309; the instrument is moving above Ichimoku Cloud, thus indicating an ascending tendency. The markets could indicate that the price may test the cloud’s upside border at 1.3275 and then resume moving upwards to reach 1.3445. Another signal to confirm further ascending movement is the price’s rebounding from the rising channel’s downside border. However, the scenario that implies further growth may be canceled if the price breaks the cloud’s downside border and fixes below 1.3215. In this case, the pair may continue falling towards 1.3130.

USDCAD

Forex Technical Analysis & Forecast 25.11.2019 (EURUSD, GBPUSD, USDCHF, USDJPY, AUDUSD, USDRUB, USDCAD, GOLD, BRENT, BTCUSD)

Forex Technical Analysis & Forecast 25.11.2019 (EURUSD, GBPUSD, USDCHF, USDJPY, AUDUSD, USDRUB, USDCAD, GOLD, BRENT, BTCUSD)

25.11.2019

EURUSD, “Euro vs US Dollar”

EURUSD has reached the short-term target of another descending impulse at 1.1015; right now, it is consolidating around 1.1020. Possibly, today the pair may extend the structure towards 1.1012 and then start a new correction to reach 1.1030, at least. After that, the instrument may resume trading downwards with the predicted target at 1.0933.

EURUSD
Risk Warning: the result of previous trading operations do not guarantee the same results in the future

GBPUSD, “Great Britain Pound vs US Dollar”

GBPUSD continues forming the second descending impulse. Today, the pair may reach 1.2783 and then start another correction towards 1.2855, at least. Later, the market may form a new descending structure with the target at 1.2750.

GBPUSD
Risk Warning: the result of previous trading operations do not guarantee the same results in the future

USDCHF, “US Dollar vs Swiss Franc”

USDCHF has reached the short-term upside target at 0.9975; right now, it is consolidating above 0.9968. possibly, the pair may break this level to the downside and start a new correction towards 0.955, at least. After that, the instrument may resume growing with the target at 0.9995.

USDCHF
Risk Warning: the result of previous trading operations do not guarantee the same results in the future

USDJPY, “US Dollar vs Japanese Yen”

USDJPY has broken 108.69 upwards. Possibly, the pair may choose an alternative scenario and continue the correction towards 108.93. According to the main scenario, the price is expected to continue trading inside the downtrend to reach 107.04.

USDJPY
Risk Warning: the result of previous trading operations do not guarantee the same results in the future

AUDUSD, “Australian Dollar vs US Dollar”

AUDUSD is consolidating around 0.6797 without any particular direction. The main scenario implies that the price may continue trading inside the downtrend with the target at 0.6773.

AUDUSD
Risk Warning: the result of previous trading operations do not guarantee the same results in the future

USDRUB, “US Dollar vs Russian Ruble”

USDRUB is consolidating around 63.73. Possibly, the pair may form one more ascending structure to reach 63.88. Later, the market may resume trading inside the downtrend with the target at 63.11.

USDRUB
Risk Warning: the result of previous trading operations do not guarantee the same results in the future

USDCAD, “US Dollar vs Canadian Dollar”

USDCAD has finished the ascending impulse towards 1.3297. Today, the pair may consolidate around this level. If later the price breaks this range to the downside at 1.3270, the market may resume falling towards 1.3220; if to the upside at 1.3303 – form one more ascending structure with the target at 1.3343.

USDCAD
Risk Warning: the result of previous trading operations do not guarantee the same results in the future

XAUUSD, “Gold vs US Dollar”

Gold has completed the descending impulse at 1459.60. Possibly, today the pair may consolidate around 1463.00. After that, the instrument may break 1459.50 and continue trading inside the downtrend with the target at 1444.00.

GOLD
Risk Warning: the result of previous trading operations do not guarantee the same results in the future

BRENT

Brent has finished the correction towards 63.00; right now, it is still trading upwards to reach 63.66. Later, the market may break this level and continue growing with the first target at 65.50.

BRENT
Risk Warning: the result of previous trading operations do not guarantee the same results in the future

BTCUSD, “Bitcoin vs US Dollar”

After failing to form a new ascending impulse from 7500.00, BTCUSD has broken 7350.00 to the downside to continue the downtrend with the target at 6400.00. Today, the pair may reach 6464.00 and then form one more ascending structure towards 6888.00. Later, the market may resume trading downwards to reach the above-mentioned target.

BITCOIN
Risk Warning: the result of previous trading operations do not guarantee the same results in the future

Fibonacci Retracements Analysis 21.11.2019 (AUDUSD, USDCAD)

Fibonacci Retracements Analysis 21.11.2019 (AUDUSD, USDCAD)

21.11.2019

AUDUSD, “Australian Dollar vs US Dollar”

As we can see in the H4 chart, after completing the descending wave, AUDUSD is correcting towards 61.8%. In the future, the price is expected to finish the pullback and resume falling to reaсh 76.0% fibo at 0.6732. However, the key downside target is the fractal low at 0.6670.

AUDUSD_H4
Risk Warning: the result of previous trading operations do not guarantee the same results in the future

The H1 chart shows more detailed structure of the current correctional uptrend, which has already reached 38.2% fibo. Despite the local decline towards the low at 0.6769, the pair may yet form a new ascending impulse to reach 50.0% fibo at 0.6849.

AUDUSD_H1
Risk Warning: the result of previous trading operations do not guarantee the same results in the future

USDCAD, “US Dollar vs Canadian Dollar”

As we can see in the H4 chart, USDCAD continues forming the ascending tendency towards fractal highs at 1.3346 and 1.3386. After breaking 76.0% fibo at 1.3274, the pair has formed a local support there. At the same time, while the pair is moving towards the highs, there is a divergence on MACD, which may indicate a possible pullback soon.

USDCAD_H4
Risk Warning: the result of previous trading operations do not guarantee the same results in the future

In the H1 chart, the pair is starting a new correction to the downside with the targets at 23.6%, 38.2%, and 50.0% fibo at 1.3295, 1.3275, and 1.3259 respectively.

USDCAD_H1
Risk Warning: the result of previous trading operations do not guarantee the same results in the future

rfxsignals November 21, 2019 No Comments

The USD did want to grow, but failed nevertheless. Overview for 21.11.2019

21.11.2019

On Thursday, the major currency pair is consolidating after a pretty volatile trading session yesterday.

EURUSD got into the turbulence zone yesterday, but investors calmed down quite quickly. The current quote for the instrument is 1.1070.

Investors’ attention is still focused on US-China trade talks. The talks were put on hold, which makes market players very nervous. To get things even more complicated, the US Senate passed a bill that implies annual confirmation of the Hongkong autonomy. Beijing already stated that it would brook no interference into the country’s internal affairs from any third parties, and this story might complicate further trade negotiations. It may well be that the agreement won’t be signed until the end of this year, thus increasing investors’ demand for “safe haven” assets.

The FOMC Meeting Minutes published yesterday says that there is no need to continue cutting the rate unless the country’s economy gest much worse. The regulator said it believed that the external uncertainty got a bit lower and called the previous rate cut insurance against economic slowdown.

Today, the macroeconomic calendar offers the Existing Home Sales report for October, which is expected to show 5.49M after 5.38M the month before. Improvement in this component may provide support to the USD.

rfxsignals November 21, 2019 No Comments

DAILY FREE FOREX SIGNALS – 21-11-2019 | Форекс – Сообщество Трейдеров |إشارات الفوركس|외환 신호

AUDUSD BUY -0.68101
SL-0.67687
TP1-0.68308
TP2-0.68464

EURAUD SELL-1.62721
SL-1.63152
TP1-1.62521
TP2-1.62326

AUDCAD BUY -0.90583
SL-0.90152
TP1-0.90772
TP2-0.90915

GBPJPY BUY -140.598
SL-140.165
TP1-140.763
TP2-140.941

EURGBP SELL-0.85593
SL-0.86007
TP1-0.85377
TP2-0.85133

GBPNZD SELL-2.01140
SL-2.01649
TP1-2.00810
TP2-2.00481

The Yen stopped growing, but not for long. Overview for 20.11.2019

20.11.2019

USDJPY stopped falling on Wednesday, but the decline potential remains.

The Japanese Yen stopped falling against the USD in the middle of the week. The current quote for the instrument is 108.54.

Demand for the Japanese currency may return at any moment: the US President Donald Trump yesterday once again threatened China to introduce more import tariffs if the trade agreement wasn’t signed on conditions favorable to the White House.

In the morning, Japan reported on the Trade Balance in October, which showed that the Export plummeted by 9.2% y/y. The indicator has been decreasing for the eleventh month in a row, and that’s the longest period since 2016. The components of the report show that key contributions to the current decline were made by raw materials (-16.5%), manufactured goods (-13.4%), machinery (-12.9%), chemicals (-9.7%), electrical machinery (-8.3%), transport equipment (-7.4%), and foodstuff (-5.2%).

More than half of the Japanese export goes to Asian countries, so among the main trading partners in Asia, exports were mainly dragged by sales to China (-10.3%), Korea (-23.1%), Singapore (-14.6%), and Thailand (-14.6%). The Export to the USA lost 11.4% y/y.

The Import in Japan plunged by 14.8% y/y, although market expectations implied -16.0% y/y.

As one can see, the outside pressure on the Japanese economy is growing: the country is very export-oriented and that’s making it suffer due to global trade wars. All previous delivery schemes, investments, and trade mechanisms stopped working, thus having a negative impact on the Japanese trade balance. As long as the USA and China continue their talks, the situation for Japan will get worse.

rfxsignals November 19, 2019 No Comments

The Yen is in demand. Overview for 19.11.2019

The Yen is in demand. Overview for 19.11.2019

19.11.2019

USDJPY is slowly falling; investors are interested in “safe haven” assets again.

On Tuesday morning, the Japanese Yen is strengthening against the USD. The current quote for the instrument is 108.60.

Lengthy trade talks between the USA and China aren’t making market players too nervous so far, but it’s clearly seen that their demand for “safe haven” assets is going up. They are doing it just in case – the time is passing by, but no new or essential information appears.

Earlier today, the Governor of the Bank of Japan Haruhiko Kuroda said that the Japanese regulator maintained options for further cuts of its rates, which were already negative. However, there were limitations in the monetary policy that the BoJ wasn’t going to break. According to Kuroda, the BoJ has tools for additional rate cuts. His words were some kind of an answer to all those who accuse the regulator of being too inefficient in stimulating the country’s economy.

By now, the BoJ owns almost half of all government bonds. At the same time, the second half is circulating on the debt market, which means that the regulator may continue buying them.

As for economic growth potential, Kuroda is pretty calm, but he does see the amount of external risks and most of them are one way or another related to the global economy.

Fibonacci Retracements Analysis 13.11.2019 (GBPUSD, EURJPY)

13.11.2019

GBPUSD, “Great Britain Pound vs US Dollar”

As we can see in the H4 chart, the descending correction continues after reaching at 76.0% fibo at 1.3040 and the divergence on MACD. The support is at 1.2670. After completing the pullback, the instrument may start another rising impulse to break the previous high at 1.3012 and then reach the key one at 1.3381.

GBPUSD_H4
Risk Warning: the result of previous trading operations do not guarantee the same results in the future

In the H1 chart, after retesting 23.6% fibo, the pair was forced by the convergence to finish the previous descending wave and start moving upwards. It doesn’t necessarily mean that the price will continue growing to reach 1.3012, that’s why one should expect further decline with the possible targets at 38.2%, 50.0%, and 61.8% fibo at 1.2699, 1.2604, and 1.2508 respectively.

GBPUSD_H1
Risk Warning: the result of previous trading operations do not guarantee the same results in the future

EURJPY, “Euro vs. Japanese Yen”

As we can see in the H4 chart, after reaching 76.0% fibo at 121.55, the pair is correcting downwards to reach the local support at 38.2% fibo at 118.73. However, if EURJPY breaks the high at 121.47, the price may continue growing with the key target at 123.36.

EURJPY_H4
Risk Warning: the result of previous trading operations do not guarantee the same results in the future

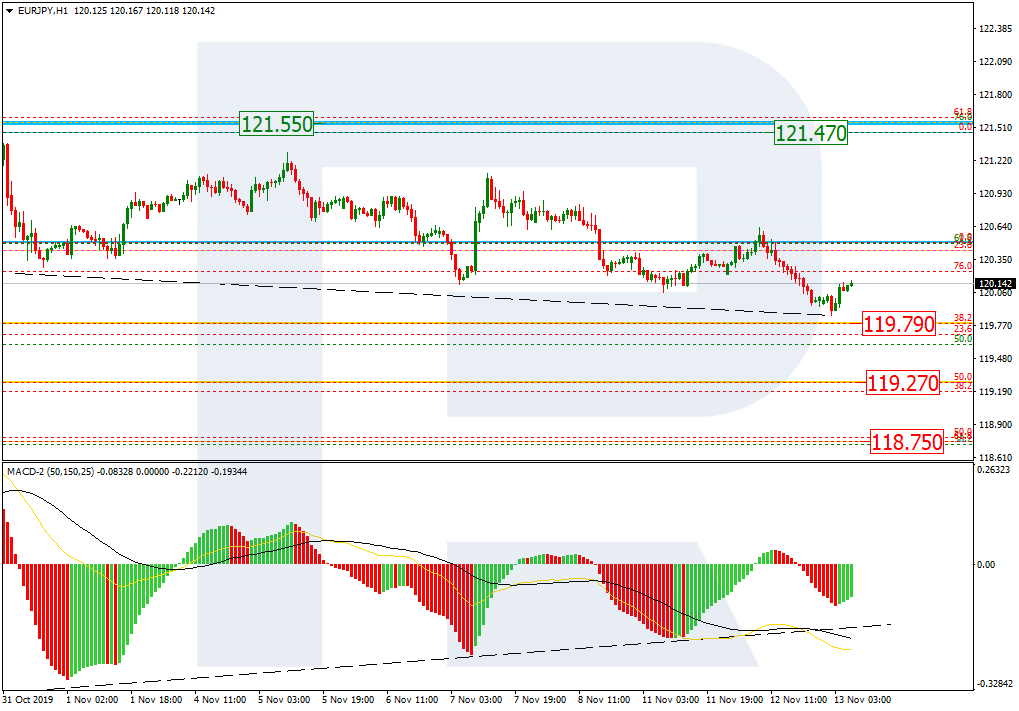
In the H1 chart, the pair is getting closer to 38.2% fibo at 119.79. at the same time, there is s convergence on MACD, which may indicate either a reverse or a short-term pullback. Further decline may be heading towards 50.0% and 61.8% fibo at 119.27 and 118.75 respectively.

EURJPY_H1
Risk Warning: the result of previous trading operations do not guarantee the same results in the future
rfxsignals November 13, 2019 No Comments

DAILY FREE FOREX SIGNALS – 13-11-2019 | Форекс – Сообщество Трейдеров |إشارات الفوركس|외환 신호

USDCHF SELL-0.99113
SL-0.99575
TP1-0.98893
TP2-0.98670

GBPUSD SELL-1.28329
SL-1.28745
TP1-1.28118
TP2-1.27920

EURUSD SELL-1.10034
SL-1.10479
TP1-1.09856
TP2-1.09681

EURAUD BUY -1.60934
SL-1.60458
TP1-1.61115
TP2-1.61354

GBPCHF SELL-1.27185
SL-1.27678
TP1-1.26937
TP2-1.26681

AUDCAD BUY -0.90721
SL-0.90186
TP1-0.90983
TP2-0.91217

CHFJPY BUY -110.131
SL-109.742
TP1-110.385
TP2-110.584

EURCAD BUY -1.45975
SL-1.45595
TP1-1.46157
TP2-1.46357